Notebookcheck Logo

Qualcomm Snapdragon 850 vs HiSilicon Kirin 710A

Qualcomm Snapdragon 850

► remove from comparison Qualcomm SD 850

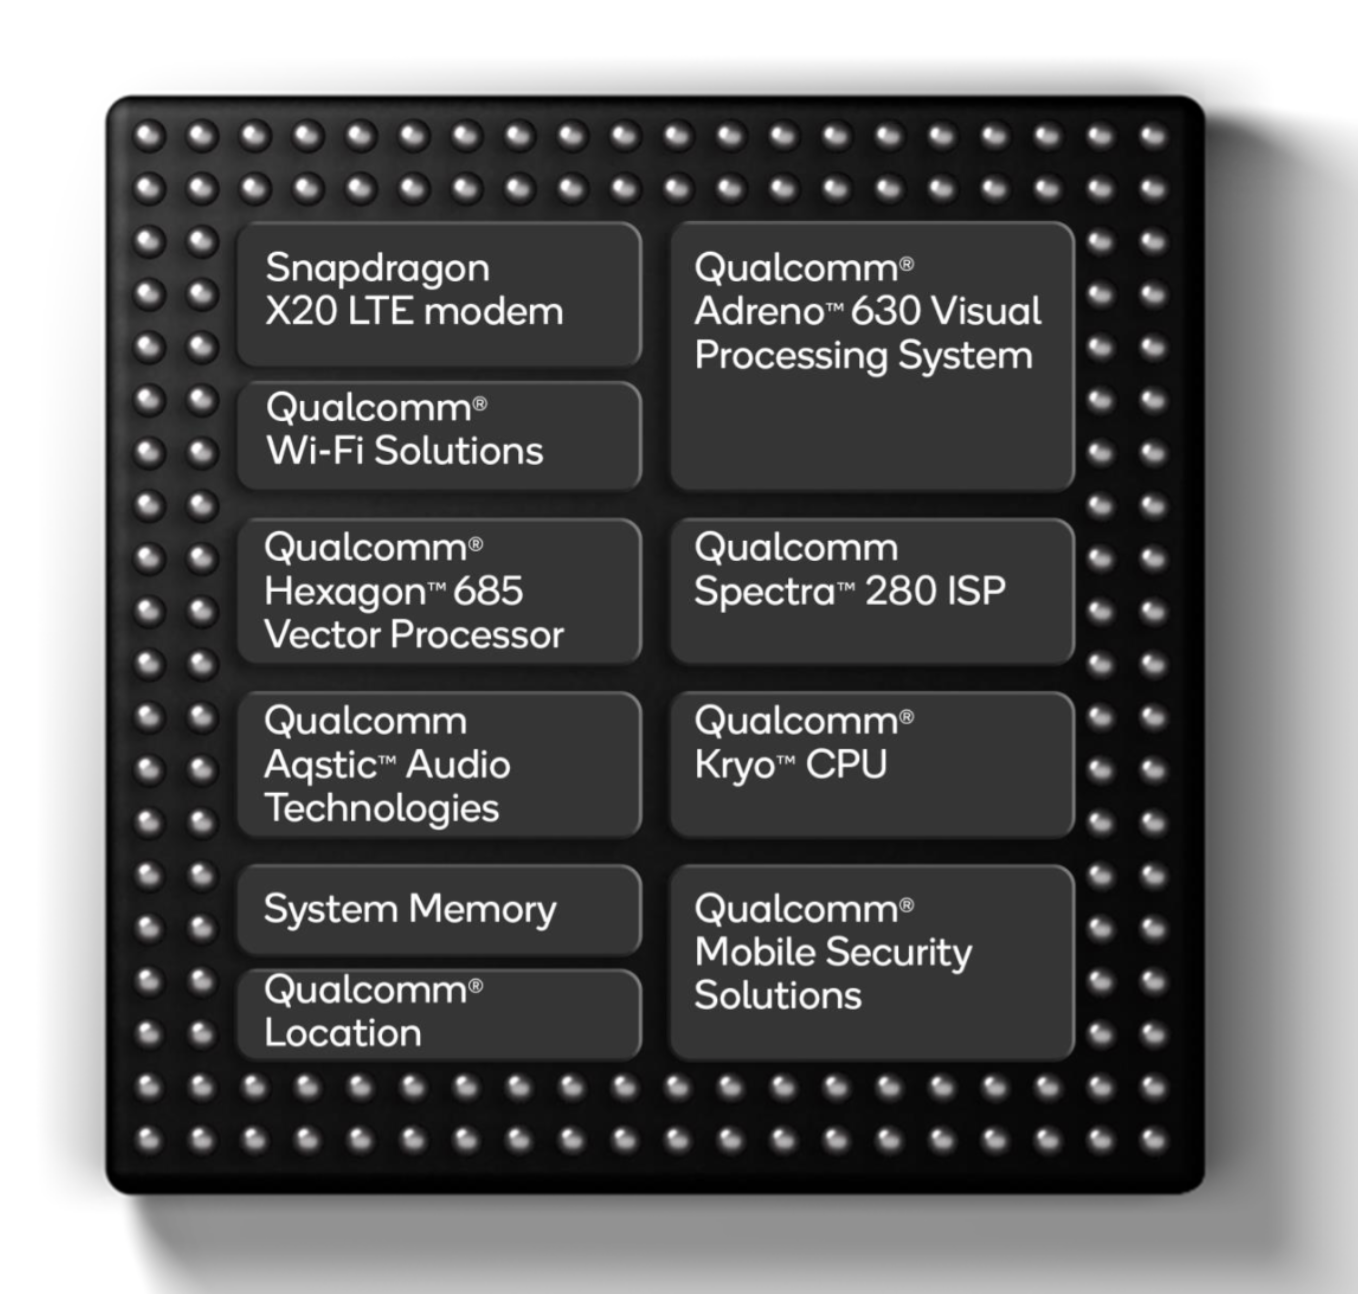
The Qualcomm Snapdragon 850 Mobile Compute Platform (or SD850) is a ARM based SoC for Windows laptops. It is a higher clocked version (3 versus 2.8 GHz) of the Snapdragon 845 for smartphones and also manufactured in 10 nm LPP FinFET at TSMC. It integrates 4x Kryo 385 cores (Cortex-A75) at up to 2.95 GHz (max) for performance and 4x Kryo 385 (at 1.8 GHz?) for efficiency. Furthermore offers an X20 LTE modem (Cat. 18 1.2 Gbps downlink, Cat 13 150 Mbps uplink), ac-WiFi and a dual-channel 32-Bit 1866 MHz LPDDR4x memory controller.

The performance of the Snapdragon 850 in Windows is in theory similar to a Intel Core i5 of the Y-series (e.g. Core i5-7y54). However, this is only the case for native ARM64 compiled applications and games. 32-bit applications that are not compiled for the ARM architecture only run in an emulation and perform much worse (e.g. see Cinebench R11.5 benchmark). 64-bit Intel/AMD apps are not supported at all.

The chip is very power efficient as its produced at TSMC in the modern 10nm LPP process. Therefore, laptops using the Snapdragon 850 can be passively cooled (no fan) and should not throttle under constant load.

HiSilicon Kirin 710A

► remove from comparison HiSilicon Kirin 710A

The HiSilicon Kirin 710A is a ARM-based mid-range Octa-Core-SoC for Android based smartphones and tablets. It is based on the Kirin 710, but manufactured in 14nm FinFET at SMIC (China) versus the TSMC in 12nm. It was announced mid 2020 and contains 8 processor cores (4x Cortex-A73 at up to 2 GHz, 4x Cortex-A53 at up to 1.7 GHz, BigLITTLE), an ARM Mali G51 MP4, a dual-channel LPDDR4 memory controller and a LTE radio (600 Mbps down, 150 Mbps up). Therefore, the CPU part is similar to the Kirin 960 and 970 (both higher clocked), but the graphics card is a lot slower. 

ModelQualcomm Snapdragon 850HiSilicon Kirin 710A
SeriesQualcomm SnapdragonHiSilicon
CodenameCortex-A75 / A55 (Kryo 385)Cortex-A73/-A53
Series: Cortex-A73/-A53
Qualcomm Snapdragon 850 « 2.75 - 2.96 GHz8 / 8 cores2 MB L3 Cortex-A75 / A55 (Kryo 385)
Qualcomm Snapdragon 845 compare2.8 GHz8 / 8 cores2 MB L3 Cortex-A75 / A55 (Kryo 385)
HiSilicon Kirin 970 compare2.4 GHz8 / 8 cores Cortex-A73/-A53
HiSilicon Kirin 960 compare2.4 GHz8 / 8 cores Cortex-A73/-A53
HiSilicon Kirin 960s compare2.1 GHz8 / 8 cores Cortex-A73/-A53
HiSilicon Kirin 710 compare2.2 GHz8 / 8 cores Cortex-A73/-A53
HiSilicon Kirin 710A « 2 GHz8 / 8 cores Cortex-A73/-A53
Clock2750 - 2960 MHz2000 MHz
L1 Cache768 KB
L2 Cache1.5 MB
L3 Cache2 MB
Cores / Threads8 / 88 / 8
Technology10 nm14 nm
FeaturesX20 LTE Modem, Adreno 630 GPUARM Mali-G51 MP4 GPU, 4x Cortex-A73 (2.2 GHz) + 4x Cortex-A53 (1.7 GHz, big.LITTLE), LTE Cat-12 600 Mbps Downlink, Cat-13 150 Mbps Uplink, Bluetooth 4.2, WiFi a/b/g/n 2.4 GHz, AGPS, Glonass, Baidou
iGPUQualcomm Adreno 630ARM Mali-G51 MP4
ArchitectureARMARM
Announced
Manufacturerwww.qualcomm.com
Transistors5500 Million

Benchmarks

Performance Rating - Geekbench 5.5, PCM Work, Sling Shot Physics, Antutu v8 CPU - Kirin 710A
0.5 pt (36%)
HiSilicon Kirin 710A
0.4702
max:
1.3 176%
0%
100%
Cinebench R10 - Cinebench R10 Rend. Single (32bit)
100%
1 SD 850 +
1166 Points (7%)
Cinebench R10 - Cinebench R10 Rend. Multi (32bit)
100%
1 SD 850 +
2284 Points (2%)
wPrime 2.10 - wPrime 2.0 1024m *
100%
1 SD 850 +
1456 s (17%)
wPrime 2.10 - wPrime 2.0 32m *
100%
1 SD 850 +
37 s (7%)
WinRAR - WinRAR 4.0
100%
1 SD 850 +
4745 Points (8%)
X264 HD Benchmark 4.0 - x264 Pass 2
100%
1 SD 850 +
4.9 fps (2%)
X264 HD Benchmark 4.0 - x264 Pass 1
100%
1 SD 850 +
28 fps (6%)
R Benchmark 2.5 - R Benchmark 2.5 *
100%
1 SD 850 +
2.3 sec (51%)
Super Pi mod 1.5 XS 1M - Super Pi mod 1.5 XS 1M *
100%
1 SD 850 +
34 s (7%)
Super Pi mod 1.5 XS 2M - Super Pi mod 1.5 XS 2M *
100%
1 SD 850 +
75 s (3%)
Super Pi Mod 1.5 XS 32M - Super Pi mod 1.5 XS 32M *
100%
1 SD 850 +
1678 s (7%)
3DMark - 3DMark Ice Storm Physics
100%
1 SD 850 +
13397 Points (11%)
3DMark - 3DMark Ice Storm Extreme Physics
100%
1 SD 850 +
12345 Points (10%)
3DMark - 3DMark Ice Storm Unlimited Physics
16059 Points (14%)
min: 12601     avg: 12741     median: 12740.5 (11%)     max: 12880 Points
3DMark - 3DMark Cloud Gate Physics
100%
1 SD 850 +
1116 Points (3%)
3DMark - 3DMark Fire Strike Standard Physics
100%
1 SD 850 +
2132 Points (4%)
3DMark - 3DMark Sling Shot Extreme (ES 3.1) Unlimited Physics
min: 2365     avg: 2426     median: 2411 (9%)     max: 2501 Points
3DMark - 3DMark Sling Shot (ES 3.0) Unlimited Physics
min: 2441     avg: 2464     median: 2441 (28%)     max: 2511 Points
Geekbench 5.5 - Geekbench 5.1 - 5.4 64 Bit Single-Core
488 Points (21%)
min: 296     avg: 297.3     median: 297 (13%)     max: 299 Points
Geekbench 5.5 - Geekbench 5.1 - 5.4 64 Bit Multi-Core
1923 Points (3%)
min: 1256     avg: 1300     median: 1312 (2%)     max: 1332 Points
Geekbench 4.4 - Geekbench 4.1 - 4.4 64 Bit Single-Core
2269 Points (23%)
min: 1422     avg: 1440     median: 1440 (14%)     max: 1458 Points
Geekbench 4.4 - Geekbench 4.1 - 4.4 64 Bit Multi-Core
7118 Points (8%)
min: 5211     avg: 5232     median: 5231.5 (6%)     max: 5252 Points
Geekbench 2 - 32 Bit - Geekbench Stream
3221 Points (26%)
Geekbench 2 - 32 Bit - Geekbench Memory
3498 Points (32%)
Geekbench 2 - 32 Bit - Geekbench Floating Point
10491 Points (21%)
Geekbench 2 - 32 Bit - Geekbench Integer
4894 Points (10%)
Geekbench 2 - 32 Bit - Geekbench Total Score
6201 Points (16%)
Mozilla Kraken 1.1 - Kraken 1.1 Total Score *
2836 ms (3%)
min: 4122     avg: 4267     median: 4266.5 (5%)     max: 4411 ms
Octane V2 - Octane V2 Total Score
13947 Points (13%)
min: 8911     avg: 9454     median: 9453.5 (8%)     max: 9996 Points
WebXPRT 3 - WebXPRT 3 Score
55 Points (11%)
AnTuTu v8 - AnTuTu v8 UX
37557 Points (31%)
AnTuTu v8 - AnTuTu v8 MEM
35829 Points (29%)
AnTuTu v8 - AnTuTu v8 GPU
26575 Points (5%)
AnTuTu v8 - AnTuTu v8 CPU
69743 Points (25%)
AnTuTu v8 - AnTuTu v8 Total Score
169704 Points (16%)
Antutu v9 - AnTuTu v9 Total Score
182567 Points (11%)
Antutu v9 - AnTuTu v9 CPU
62687 Points (17%)
PCMark for Android - PCM f. Android Storage 2.0 score
7061 Points (11%)
PCMark for Android - PCM f. Android Work Score 3.0
6622 Points (31%)
PCMark for Android - PCM f. Android Computer Vision
3345 Points (18%)
PCMark for Android - PCM f. Android Storage
6401 Points (14%)
PCMark for Android - PCM f. Android Work Score 2.0
min: 6287     avg: 7038     median: 7038 (46%)     max: 7789 Points
PCMark for Android - PCM f. Android Work Score
min: 7991     avg: 8101     median: 8101 (41%)     max: 8211 Points
Power Consumption - Geekbench 5.5 Power Consumption 150cd *
6.8 Watt (3%)
Power Consumption - Idle Power Consumption 150cd 1min *
3 Watt (3%)

Average Benchmarks Qualcomm Snapdragon 850 → 100% n=7

Average Benchmarks HiSilicon Kirin 710A → 73% n=7

- Range of benchmark values for this graphics card
- Average benchmark values for this graphics card
* Smaller numbers mean a higher performance
1 This benchmark is not used for the average calculation

Add one or more devices and compare

In the following list you can select (and also search for) devices that should be added to the comparison. You can select more than one device.

restrict list:

show all (including archived), 2024, 2023
v1.26
log 17. 15:14:34

#0 checking url part for id 11391 +0s ... 0s

#1 checking url part for id 12945 +0s ... 0s

#2 not redirecting to Ajax server +0s ... 0s

#3 did not recreate cache, as it is less than 5 days old! Created at Fri, 17 May 2024 11:21:47 +0200 +0.001s ... 0.001s

#4 composed specs +0.067s ... 0.067s

#5 did output specs +0s ... 0.068s

#6 getting avg benchmarks for device 11391 +0.002s ... 0.07s

#7 got single benchmarks 11391 +0.01s ... 0.08s

#8 getting avg benchmarks for device 12945 +0.013s ... 0.093s

#9 got single benchmarks 12945 +0.017s ... 0.109s

#10 got avg benchmarks for devices +0s ... 0.109s

#11 min, max, avg, median took s +0.182s ... 0.291s

#12 return log +0.023s ... 0.315s

Please share our article, every link counts!
> Expert Reviews and News on Laptops, Smartphones and Tech Innovations > Benchmarks / Tech > Processor Comparison - Head 2 Head
Redaktion, 2017-09- 8 (Update: 2023-07- 1)