Notebookcheck Logo

Qualcomm Snapdragon 8 Gen 2 vs AMD Ryzen 7 6800U

Qualcomm Snapdragon 8 Gen 2

► remove from comparison Qualcomm SD 8 Gen 2

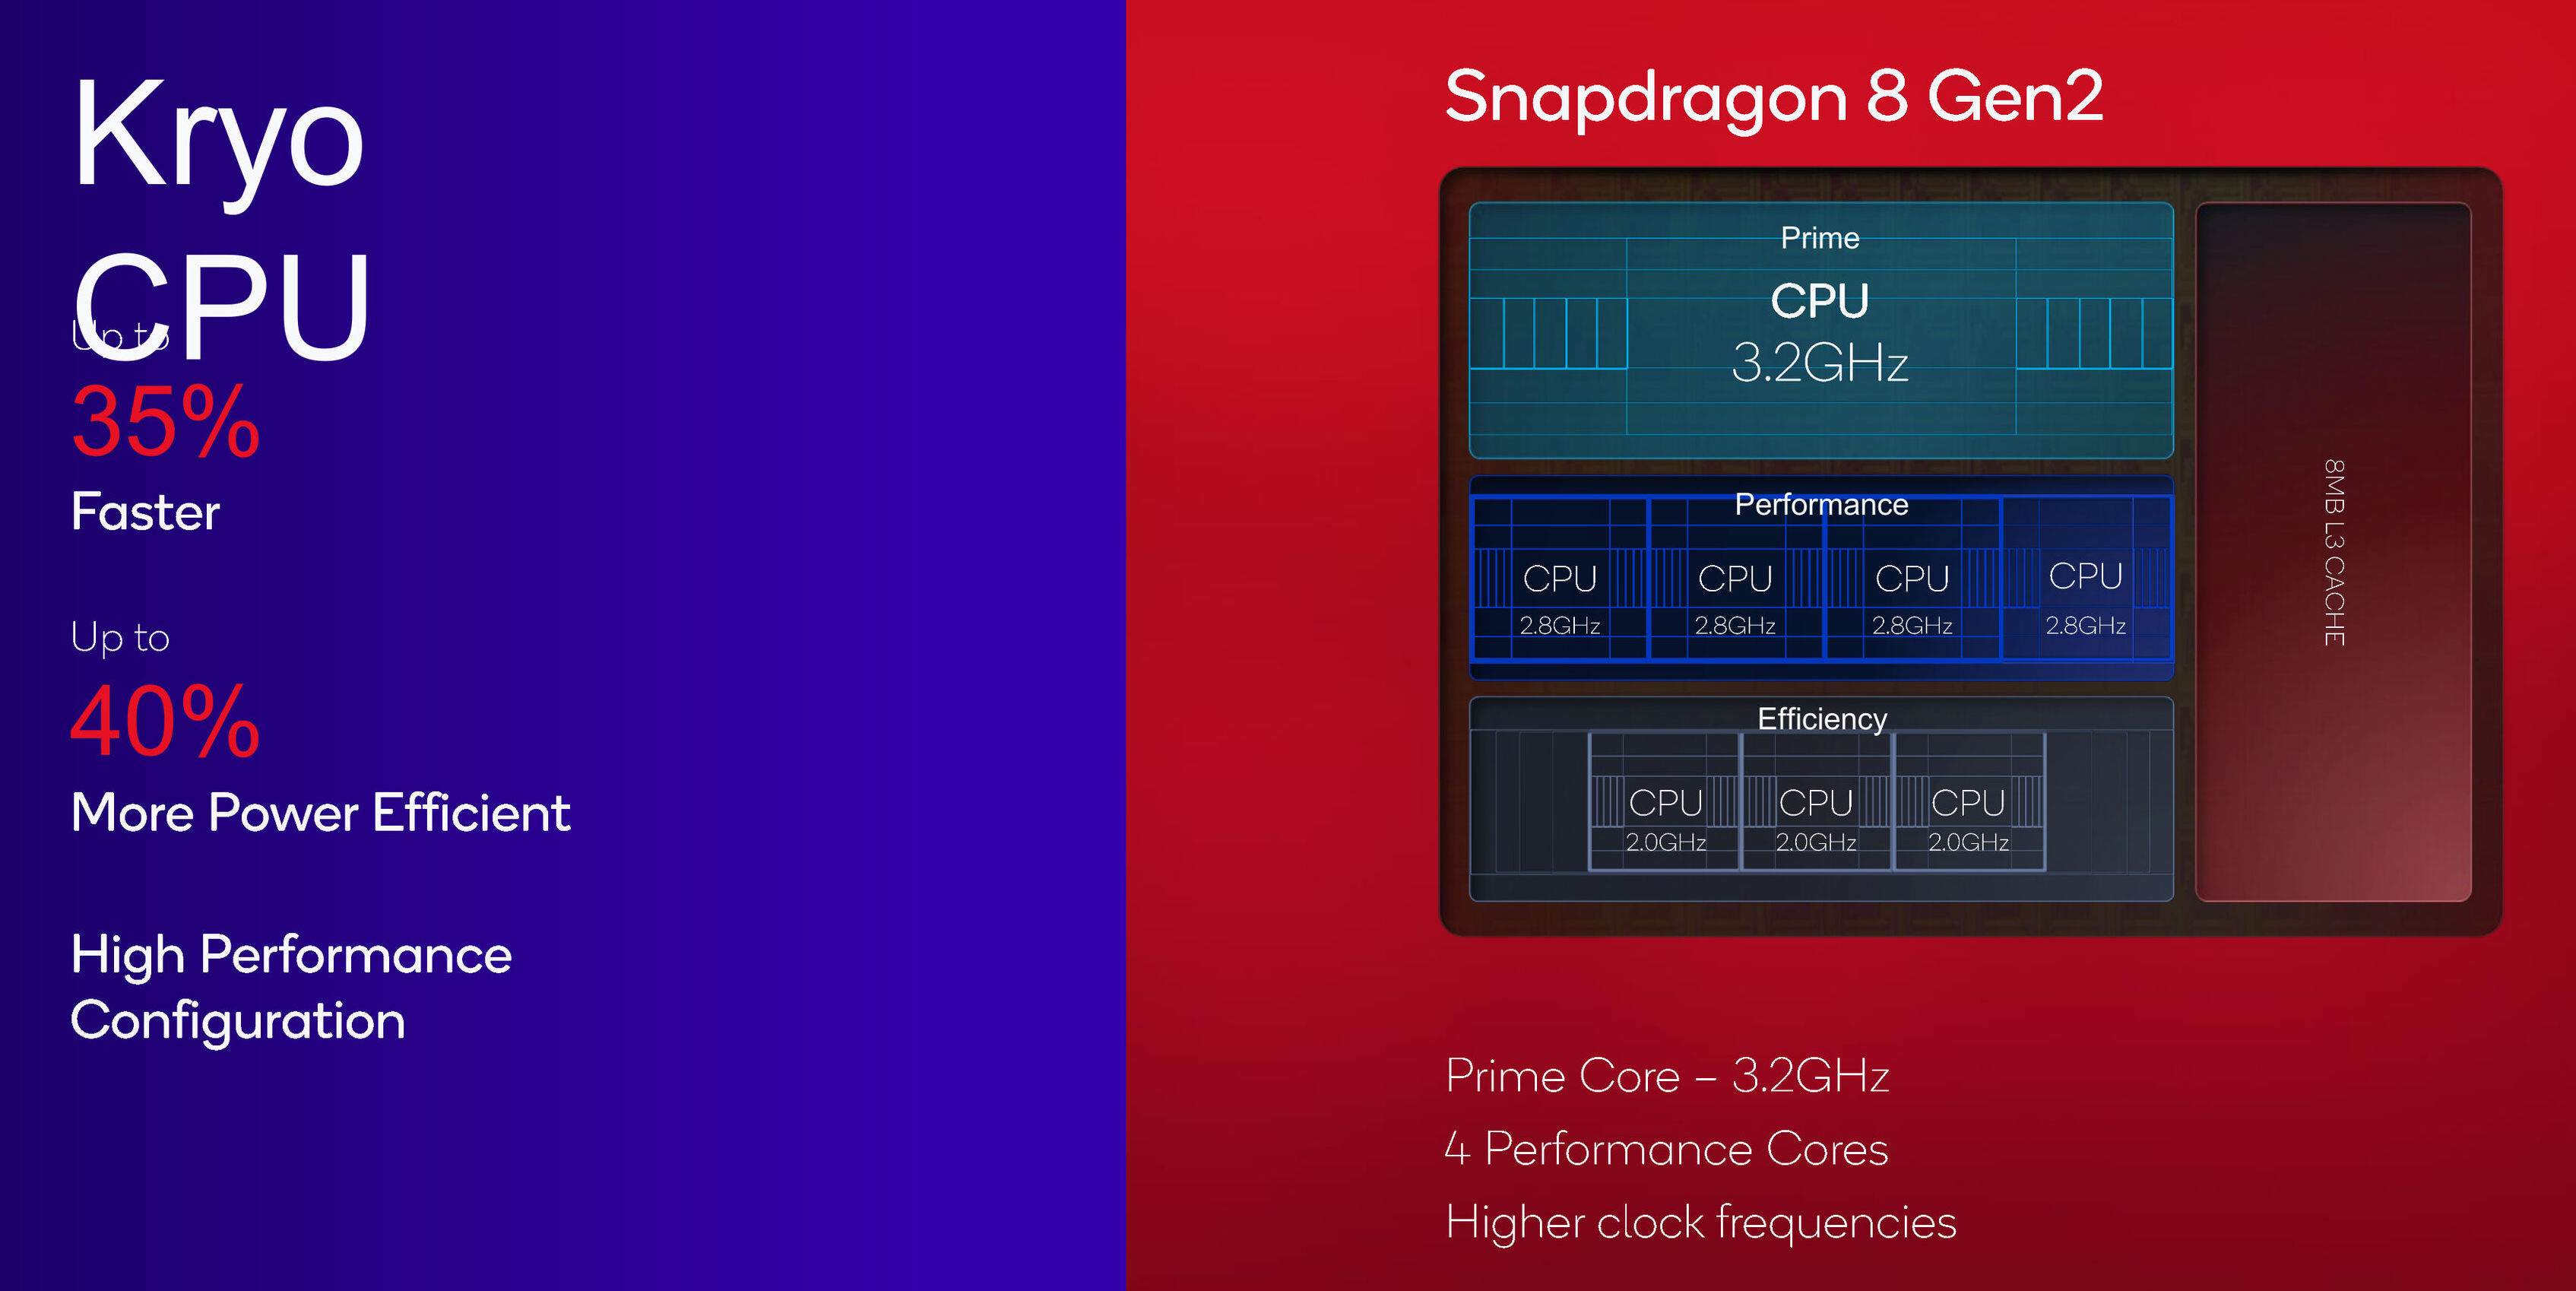
The Qualcomm Snapdragon 8 Gen 2 Mobile Platform is a high-end SoC for smartphones that was introduced in late 2022 and manufactured in 4 nm at TSMC (N4P). It integrates four different CPU clusters. A fast and big prime core based on the ARM Cortex-X3 architecture and clocked at up to 3.2 GHz for 64 bit applications. Two more ARM Cortex-A715 based performance cores clocked at up to 2.8 GHz (also only for 64 bit apps). Two more Cortex-A710 performance cores at up to 2.8 GHz that can also be used for older apps and three efficiency cores (ARM Cortex-A510 with up to 2 GHz). All cores can use the shared 8 MB level 3 cache.

Thanks to the new architecture and high clock rates, the SD 8 Gen 2 is the fastest mobile CPU for Android based devices and is only topped by current Apple SoCs like the Apple A16 (see benchmarks below).

The chip also integrates a Hexagon accelerator for AI workloads (tensor, scalar and vector). Qualcomm states that its one of the first chips with INT4 support and up to 4.35x performance compared to the previous generation. 

The 18-Bit-Spectra ISP is able to process photos with up to 200 MP and work with videos up to 8k30 (including 10-bit, HDR10+, HLG and Dolby Vision).

A big improvement of the Snapdragon 8 G2 is the integrated Adreno 740 GPU, that now supports Hardware Raytracing and tops even the iGPU in the Apple A16.

The integrated AI Engine can offer up to 4x faster AI performance thanks to the bigger Tensor engine. The 18-Bit-Spectra-ISP also saw some big improvements and is now called Snapdragon Sight.

The integrated Adreno 730 offers a 30% graphics boost compared to the previous Adreno 660.

The integrated Snapdragon X70 5G modem is also new as is the FastConnect 7800 modem with Wi-Fi 7 and Bluetooth 5.3 support.

AMD Ryzen 7 6800U

► remove from comparison AMD R7 6800U

The AMD Ryzen 7 6800U is a processor for thin and light laptops based of the Rembrandt generation. The R7 6800U integrates all eight cores based on the Zen 3+ microarchitecture. They are clocked at 2.7 (guaranteed base clock) to 4.7 GHz (Turbo) and support SMT / Hyperthreading (16 threads). The chip is manufactured on the modern 6 nm TSMC process. Compared to the similar R7 6800H, the 6800U offers a lower base clock speed and a lower TDP.

The new Zen 3+ is a refresh of the Zen 3 architecture and should not offer a lot of changes. The chip itself however, offers a lot of new features, like support for USB 4 (40 Gbps), PCI-E Gen 4, DDR5-4800MT/s or LPDDR5-6400MT/s, WiFi 6E, Bluetooth LE 5.2, DisplayPort 2, and AV1 decode.

A big novelty is the integrated GPU Radeon 680M, that is now based on the RDNA2 architecture and offers 12 CUs at up to 2.2 GHz. It should be the fastest iGPU of all at the time of announcement.

Performance

The average 6800U in our database easily shoulders its way towards the best of the best, trading blows with the Core i7-1270P, the Core i7-11850H and the Ryzen 7 PRO 6850H as far as multi-thread benchmark scores are concerned. Throw everything you can at this little guy. He'll take it all and ask for more.

Thanks to its decent cooling solution and a long-term CPU power limit of more than 20 W, the Mercury EM680 is among the fastest systems built around the 6800U that we know of. It can be at least 20% faster in CPU-bound workloads than the slowest system featuring the same chip in our database, as of August 2023.

Power consumption

This Ryzen 7 series chip has a default TDP, also known as the long-term power limit, of 15 W to 28 W, the expectation being that laptop makers will go for a higher value in exchange for higher performance. Either way, a proper cooling solution is a must.

The R7 6800U is manufactured on the 6 nm TSMC process for higher-than-average, as of mid 2023, energy efficiency.

ModelQualcomm Snapdragon 8 Gen 2AMD Ryzen 7 6800U
CodenameCortex-X3 / A715 / A710 / A510 (Kryo)Rembrandt-U (Zen 3+)
SeriesQualcomm Snapdragon 8AMD Rembrandt (Zen 3+)
Series: Rembrandt (Zen 3+) Rembrandt-U (Zen 3+)
Qualcomm Snapdragon 8 Gen 2 for Galaxy compare2 - 3.36 GHz8 / 8 cores8 MB L3
Qualcomm Snapdragon 8 Gen 2 « 2 - 3.2 GHz8 / 8 cores8 MB L3
AMD Ryzen 7 6800U « 2.7 - 4.7 GHz8 / 16 cores16 MB L3
AMD Ryzen 5 6600U compare2.9 - 4.5 GHz6 / 12 cores16 MB L3
Clock2000 - 3200 MHz2700 - 4700 MHz
L3 Cache8 MB16 MB
Cores / Threads8 / 8
1 x 3.2 GHz ARM Cortex-X3
2 x 2.8 GHz ARM Cortex-A715
2 x 2.8 GHz ARM Cortex-A710
3 x 2.0 GHz ARM Cortex-A510
8 / 16
Technology4 nm6 nm
FeaturesAdreno GPU, Spectra ISP, Hexagon, X70 5G Modem, FastConnect 7800 Wi-Fi 7, LPDDR5x 4200 MHz Memory ControllerDDR5-4800/LPDDR5-6400 RAM (incl. ECC), PCIe 4, MMX, SSE, SSE2, SSE3, SSSE3, SSE4A, SSE4.1, SSE4.2, AVX, AVX2, BMI2, ABM, FMA, ADX, SMEP, SMAP, SMT, CPB, AES-NI, RDRAND, RDSEED, SHA, SME
iGPUQualcomm Adreno 740AMD Radeon 680M ( - 2200 MHz)
ArchitectureARM v9x86
Announced
Manufacturerwww.qualcomm.comwww.amd.com
L1 Cache512 KB
L2 Cache4 MB
TDP28 Watt
max. Temp.95 °C
SocketFP7/FP7r2

Benchmarks

Performance Rating - CB R15 + R20 + 7-Zip + X265 + Blender + 3DM11 CPU - R7 6800U
35.1 pt (58%)
AMD Ryzen 7 6800U
35.1
max:
60.1 71%
0%
100%
Restrict / Search: Model: Max. age: years
Cinebench 2024 - Cinebench 2024 CPU Single Core
79 Points (44%)
Cinebench 2024 - Cinebench 2024 CPU Multi Core
496 Points (9%)
Cinebench R23 - Cinebench R23 Multi Core
min: 9130     avg: 10653     median: 10546 (10%)     max: 11741 Points
Cinebench R23 - Cinebench R23 Single Core
min: 878     avg: 1418     median: 1506 (63%)     max: 1534 Points
Cinebench R20 - Cinebench R20 CPU (Single Core)
min: 341     avg: 553     median: 585.5 (64%)     max: 602 Points
Cinebench R20 - Cinebench R20 CPU (Multi Core)
min: 3529     avg: 4122     median: 4083.5 (10%)     max: 4574 Points
Cinebench R15 - Cinebench R15 CPU Multi 64 Bit
min: 1463     avg: 1766     median: 1776 (11%)     max: 1978.53 Points
Cinebench R15 - Cinebench R15 CPU Single 64 Bit
min: 142.6     avg: 225.4     median: 242 (67%)     max: 246 Points
Cinebench R11.5 - Cinebench R11.5 CPU Multi 64 Bit
21.1 Points (27%)
Cinebench R11.5 - Cinebench R11.5 CPU Single 64 Bit
2.9 Points (68%)
Cinebench R10 - Cinebench R10 Rend. Single (32bit)
6450 Points (39%)
Cinebench R10 - Cinebench R10 Rend. Multi (32bit)
35314 Points (26%)
Cinebench R10 - Cinebench R10 Rend. Multi (64bit)
60447 Points (39%)
Cinebench R10 - Cinebench R10 Rend. Single (64bit)
12163 Points (15%)
wPrime 2.10 - wPrime 2.0 1024m *
113.5 s (1%)
wPrime 2.10 - wPrime 2.0 32m *
4.5 s (1%)
WinRAR - WinRAR 4.0
4639 Points (7%)
7-Zip 18.03 - 7-Zip 18.03 Multi Thread 4 runs
min: 40058     avg: 49128     median: 50614 (29%)     max: 53934 MIPS
7-Zip 18.03 - 7-Zip 18.03 Single Thread 4 runs
min: 3398     avg: 5120     median: 5452.5 (64%)     max: 5511 MIPS
X264 HD Benchmark 4.0 - x264 Pass 2
101.1 fps (34%)
X264 HD Benchmark 4.0 - x264 Pass 1
219.5 fps (51%)
HWBOT x265 Benchmark v2.2 - HWBOT x265 4k Preset
min: 11.8     avg: 13.1     median: 13.1 (23%)     max: 14.2 fps
TrueCrypt - TrueCrypt Serpent
1 GB/s (29%)
TrueCrypt - TrueCrypt Twofish
1.5 GB/s (26%)
TrueCrypt - TrueCrypt AES
10.7 GB/s (28%)
Blender - Blender 3.3 Classroom CPU *
min: 474     avg: 516     median: 504 (6%)     max: 572 Seconds
Blender - Blender 2.79 BMW27 CPU *
min: 272     avg: 302.5     median: 304 (2%)     max: 347 Seconds
R Benchmark 2.5 - R Benchmark 2.5 *
min: 0.508     avg: 0.5     median: 0.5 (11%)     max: 0.529 sec
3DMark 06 - CPU - 3DMark 06 - CPU
min: 9102     avg: 9965     median: 9964.5 (21%)     max: 10827 Points
Super Pi mod 1.5 XS 1M - Super Pi mod 1.5 XS 1M *
7.9 s (2%)
Super Pi mod 1.5 XS 2M - Super Pi mod 1.5 XS 2M *
19.3 s (1%)
Super Pi Mod 1.5 XS 32M - Super Pi mod 1.5 XS 32M *
692 s (3%)
3DMark Vantage - 3DM Vant. Perf. CPU no Physx
min: 52884     avg: 55833     median: 55833 (43%)     max: 58782 Points
3DMark 11 - 3DM11 Performance Physics
min: 12198     avg: 14018     median: 14280 (35%)     max: 15136 Points
3DMark - 3DMark Ice Storm Physics
min: 51726     avg: 54789     median: 54788.5 (45%)     max: 57851 Points
3DMark - 3DMark Ice Storm Extreme Physics
min: 51601     avg: 54760     median: 54760 (44%)     max: 57919 Points
3DMark - 3DMark Ice Storm Unlimited Physics
min: 58776     avg: 63558     median: 63558 (53%)     max: 68340 Points
3DMark - 3DMark Cloud Gate Physics
min: 12402     avg: 13741     median: 13574 (34%)     max: 15247 Points
3DMark - 3DMark Fire Strike Standard Physics
min: 15312     avg: 18647     median: 18882 (34%)     max: 21992 Points
3DMark - 3DMark Time Spy CPU
min: 6355     avg: 7107     median: 7103.5 (30%)     max: 7731 Points
2028 Points (51%)
8771 Points (34%)
min: 1192     avg: 1607     median: 1715 (54%)     max: 1915 Points
min: 6931     avg: 7435     median: 7066 (29%)     max: 8308 Points
min: 926     avg: 1431     median: 1514 (59%)     max: 1555 Points
min: 6854     avg: 7729     median: 7678 (14%)     max: 8935 Points
Geekbench 5.0 - Geekbench 5.0 64 Bit Single-Core
min: 1306     avg: 1433     median: 1462.5 (6%)     max: 1500 Points
Geekbench 5.0 - Geekbench 5.0 64 Bit Multi-Core
min: 7024     avg: 7646     median: 7767 (24%)     max: 8026 Points
Geekbench 4.4 - Geekbench 4.1 - 4.4 64 Bit Single-Core
min: 7691     avg: 7987     median: 8130 (81%)     max: 8231 Points
min: 5657     avg: 6065     median: 6261 (63%)     max: 6278 Points
Geekbench 4.4 - Geekbench 4.1 - 4.4 64 Bit Multi-Core
min: 19069     avg: 20636     median: 21122 (21%)     max: 21505 Points
min: 27734     avg: 30075     median: 30925 (31%)     max: 31566 Points
Geekbench 3 - Geekbench 3 64 Bit Multi-Core
min: 18584     avg: 18885     median: 18884.5 (30%)     max: 19185 Points
Geekbench 3 - Geekbench 3 64 Bit Single-Core
min: 6449     avg: 6564     median: 6563.5 (98%)     max: 6678 Points
Mozilla Kraken 1.1 - Kraken 1.1 Total Score *
min: 602     avg: 1023     median: 874.3 (1%)     max: 1837.3 ms
min: 594     avg: 690     median: 634.5 (1%)     max: 1016 ms
Octane V2 - Octane V2 Total Score
min: 19870     avg: 45827     median: 47385 (36%)     max: 65418 Points
min: 43921     avg: 62717     median: 69752 (53%)     max: 74479 Points
WebXPRT 4 - WebXPRT 4 Score
min: 28     avg: 130.6     median: 139 (38%)     max: 183 Points
min: 133.2     avg: 198.2     median: 213 (59%)     max: 221 Points
WebXPRT 3 - WebXPRT 3 Score
min: 115     avg: 197.5     median: 201 (36%)     max: 238 Points
min: 181.3     avg: 254.9     median: 270 (48%)     max: 295 Points
Antutu v9 - AnTuTu v9 Total Score
min: 1111520     avg: 1259050     median: 1273780 (62%)     max: 1322450 Points
Antutu v10 - AnTuTu v10 Total Score
min: 1398470     avg: 1539080     median: 1549310 (51%)     max: 1607560 Points
Antutu v10 - AnTuTu v10 CPU
min: 315077     avg: 371887     median: 374128 (11%)     max: 403668 Points
PCMark for Android - PCM f. Android Storage 2.0 random write internal
min: 27.9     avg: 72.9     median: 75.8 (52%)     max: 121.1 MB/s
PCMark for Android - PCM f. Android Storage 2.0 seq write internal
min: 1463.74     avg: 2261     median: 2244.5 (63%)     max: 3009 MB/s
PCMark for Android - PCM f. Android Storage 2.0 random read internal
min: 23.2     avg: 45.5     median: 45.7 (22%)     max: 61.7 MB/s
PCMark for Android - PCM f. Android Storage 2.0 seq read internal
min: 1663.89     avg: 2610     median: 2661.1 (74%)     max: 2938 MB/s
min: 1009     avg: 1436     median: 1481 (55%)     max: 1575 Points
Power Consumption - Prime95 Power Consumption - external Monitor *
min: 37.8     avg: 47.2     median: 48 (8%)     max: 55.6 Watt
Power Consumption - Cinebench R15 Multi Power Consumption - external Monitor *
min: 43.3     avg: 50     median: 47 (9%)     max: 58 Watt
Power Consumption - Idle Power Consumption - external Monitor *
min: 4.62     avg: 6.8     median: 7.2 (5%)     max: 8.73 Watt
min: 8.59     avg: 8.9     median: 8.8 (10%)     max: 9.41 Watt
Power Consumption - Power Efficiency - Cinebench R15 Multi external Monitor
min: 34.1     avg: 36.2     median: 34.2 (25%)     max: 40.2 Points per Watt

Average Benchmarks Qualcomm Snapdragon 8 Gen 2 → 100% n=13

Average Benchmarks AMD Ryzen 7 6800U → 128% n=13

- Range of benchmark values for this graphics card
red legend - Average benchmark values for this graphics card
* Smaller numbers mean a higher performance
1 This benchmark is not used for the average calculation

Add one or more devices and compare

In the following list you can select (and also search for) devices that should be added to the comparison. You can select more than one device.

restrict list:
v1.33
log 31. 00:44:05

#0 ran 0s before starting gpusingle class +0s ... 0s

#1 checking url part for id 14645 +0s ... 0s

#2 checking url part for id 14088 +0s ... 0s

#3 redirected to Ajax server, took 1753915445s time from redirect:0 +0s ... 0s

#4 did not recreate cache, as it is less than 5 days old! Created at Mon, 28 Jul 2025 05:17:35 +0200 +0s ... 0s

#5 composed specs +0.006s ... 0.006s

#6 did output specs +0s ... 0.006s

#7 getting avg benchmarks for device 14645 +0.001s ... 0.007s

#8 got single benchmarks 14645 +0.024s ... 0.031s

#9 getting avg benchmarks for device 14088 +0.006s ... 0.037s

#10 got single benchmarks 14088 +0.01s ... 0.047s

#11 got avg benchmarks for devices +0s ... 0.047s

#12 min, max, avg, median took s +0.041s ... 0.088s

#13 return log +0s ... 0.088s

Please share our article, every link counts!
Mail Logo
> Expert Reviews and News on Laptops, Smartphones and Tech Innovations > Benchmarks / Tech > Processor Comparison - Head 2 Head
Redaktion, 2017-09- 8 (Update: 2023-07- 1)