Notebookcheck Logo

Qualcomm Snapdragon 632 vs Samsung Exynos 7870 Octa

Qualcomm Snapdragon 632

► remove from comparison Qualcomm SD 632

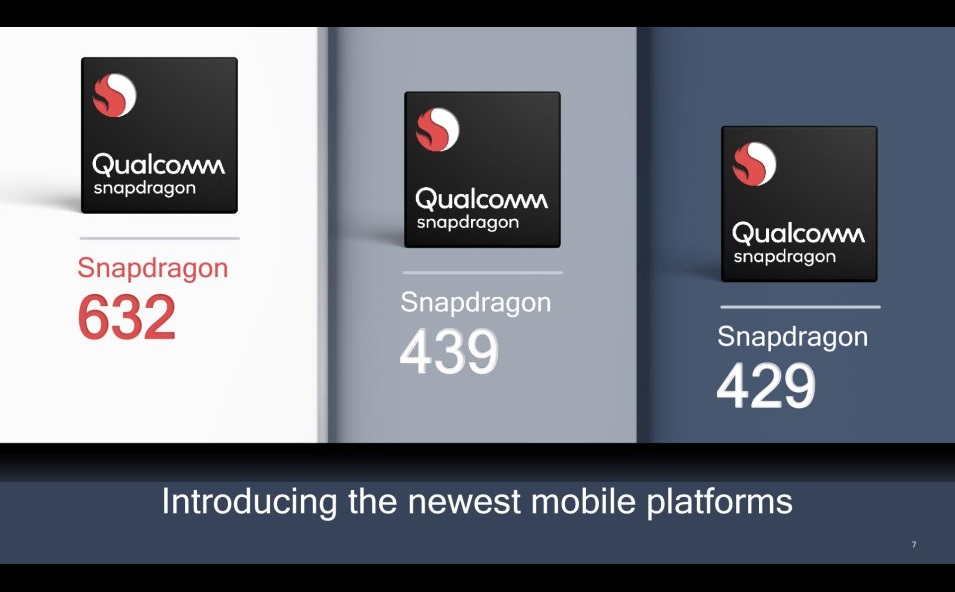
The Qualcomm Snapdragon 632 (SD632) is a mid-range octa-core SoC with eight Kryo 250 cores (Cortex-A53 based) at up to 1.8 GHz, an Adreno 506 GPU, a LPDDR3 memory controller (dual channel) and a X9 LTE (Cat 12, 300 Mbps down, 150 Mbps up) modem. Furthermore, the chip supports 802.11abgn WiFi and Bluetooth 5.0. It is manufactured in 14nm FinFet. Qualcomm states a 40% faster performance compared to the old Snapdragon 626.

Samsung Exynos 7870 Octa

► remove from comparison Samsung 7870 Octa

The Samsung Exynos 7 Octa is a 64-bit SoC for mainstream smartphones and tablets (usually Android based). It was announced in February 2016 and integrates eight Cortex-A53 cores, which are manufactured in a modern 14-nm process. Compared to the previous 28-nm-SoCs, the performance was increased and the power consumption is 30 % lower according to Samsung. The integrated LZE Cat.6 modem reaches transfer rates of up to 300 Mbps (downstream) and 50 Mbps (upstream). The dual-channel memory controller supports LPDDR3-1866 RAM.

The integrated graphics adapter is an ARM Mali-T830 MP1 (core clock of 700 MHz according to Wikipedia). Besides OpenGL ES 3.2, it also supports OpenCL 1.2 as well as DirectX 11 (FL 9_3). The performance is sufficient for common Android games from 2016 at medium details.

ModelQualcomm Snapdragon 632Samsung Exynos 7870 Octa
CodenameKryo 250A53
SeriesQualcomm SnapdragonSamsung Exynos
Clock1800 MHz1600 MHz
Cores / Threads8 / 88 / 8
Technology14 nm14 nm
FeaturesAdreno 506 GPU, X9 LTE Modem, Hexagon 546 DSP, 2x ISP 14-BitARM Mali-T830 GPU, 8x Cortex-A53 1.6 GHz, LTE Cat.6, 14 nm, dual-channel memory controller LPDDR3-1866
iGPUQualcomm Adreno 506ARM Mali-T830 MP1 (700 MHz)
ArchitectureARMARM
Announced
Manufacturerwww.qualcomm.comwww.samsung.com
Series: Exynos A53
Samsung Exynos 7880 compare1.9 GHz8 / 8 cores A53
Samsung Exynos 7870 Octa « 1.6 GHz8 / 8 cores A53

Benchmarks

Performance Rating - Geekbench 5.5, PCM Work, Sling Shot Physics, Antutu v8 CPU - SD 632
0.4 pt (34%)
Restrict / Search: Model: Max. age: years
3DMark - 3DMark Ice Storm Physics
11467 Points (9%)
3DMark - 3DMark Ice Storm Extreme Physics
11005 Points (9%)
3DMark - 3DMark Ice Storm Unlimited Physics
min: 15123     avg: 15916     median: 15948.5 (13%)     max: 16647 Points
3DMark - 3DMark Sling Shot Extreme (ES 3.1) Unlimited Physics
min: 2132     avg: 2202     median: 2206 (21%)     max: 2281 Points
3DMark - 3DMark Sling Shot (ES 3.0) Unlimited Physics
min: 2130     avg: 2200     median: 2174 (25%)     max: 2323 Points
Geekbench 5.5 - Geekbench 5.1 - 5.5 64 Bit Single-Core
100%
1 SD 632 +
271 Points (11%)
Geekbench 5.5 - Geekbench 5.1 - 5.5 64 Bit Multi-Core
100%
1 SD 632 +
1233 Points (2%)
Geekbench 4.4 - Geekbench 4.1 - 4.4 64 Bit Single-Core
min: 1194     avg: 1236     median: 1247 (12%)     max: 1256 Points
Geekbench 4.4 - Geekbench 4.1 - 4.4 64 Bit Multi-Core
min: 4179     avg: 4497     median: 4515 (5%)     max: 4765 Points
Geekbench 4.0 - Geekbench 4.0 64 Bit Single-Core
1256 Points (14%)
min: 680     avg: 696     median: 682 (8%)     max: 726 Points
Geekbench 4.0 - Geekbench 4.0 64 Bit Multi-Core
4515 Points (6%)
min: 3277     avg: 3285     median: 3284.5 (4%)     max: 3292 Points
Geekbench 3 - Geekbench 3 64 Bit Multi-Core
4169 Points (7%)
Geekbench 3 - Geekbench 3 64 Bit Single-Core
753 Points (11%)
Mozilla Kraken 1.1 - Kraken 1.1 Total Score *
min: 4806     avg: 4899     median: 4895 (6%)     max: 5037 ms
min: 6784     avg: 9156     median: 9670 (11%)     max: 11916 ms
Octane V2 - Octane V2 Total Score
min: 8185     avg: 8287     median: 8268.5 (6%)     max: 8420 Points
min: 3721     avg: 4164     median: 3880 (3%)     max: 4968 Points
WebXPRT 3 - WebXPRT 3 Score
min: 50     avg: 55.3     median: 58 (10%)     max: 58 Points
min: 31     avg: 31.5     median: 31.5 (6%)     max: 32 Points
AnTuTu v6 - AnTuTu v6 Total Score
min: 76724     avg: 83178     median: 84051.5 (29%)     max: 87883 Points
AnTuTu v7 - AnTuTu v7 MEM
min: 6466     avg: 8367     median: 8156 (25%)     max: 10510 Points
min: 4775     avg: 5190     median: 5140.5 (16%)     max: 5703 Points
AnTuTu v7 - AnTuTu v7 UX
min: 25769     avg: 29160     median: 29882 (37%)     max: 30294 Points
min: 15443     avg: 16057     median: 16019 (20%)     max: 16745 Points
AnTuTu v7 - AnTuTu v7 GPU
min: 13554     avg: 13851     median: 13921 (4%)     max: 13942 Points
min: 8143     avg: 8405     median: 8393.5 (3%)     max: 8688 Points
AnTuTu v7 - AnTuTu v7 CPU
min: 49427     avg: 52229     median: 52684 (32%)     max: 53683 Points
min: 31778     avg: 32396     median: 32448 (20%)     max: 32911 Points
AnTuTu v7 - AnTuTu v7 Total Score
min: 97294     avg: 103607     median: 103114 (18%)     max: 108408 Points
min: 61794     avg: 62047     median: 61818 (11%)     max: 62758 Points
AnTuTu v8 - AnTuTu v8 UX
100%
1 SD 632 +
49912 Points (42%)
AnTuTu v8 - AnTuTu v8 MEM
100%
1 SD 632 +
25162 Points (20%)
AnTuTu v8 - AnTuTu v8 GPU
100%
1 SD 632 +
15277 Points (3%)
AnTuTu v8 - AnTuTu v8 CPU
100%
1 SD 632 +
59443 Points (22%)
AnTuTu v8 - AnTuTu v8 Total Score
100%
1 SD 632 +
149794 Points (14%)
PCMark for Android - PCM f. Android Work 2.0 Battery Life
1353 min (26%)
min: 669     avg: 719     median: 718.5 (14%)     max: 768 min
PCMark for Android - PCM f. Android Computer Vision
min: 3078     avg: 3242     median: 3242 (17%)     max: 3406 Points
min: 2016     avg: 2023     median: 2024 (11%)     max: 2030 Points
PCMark for Android - PCM f. Android Storage
min: 4200     avg: 7719     median: 7719 (16%)     max: 11238 Points
min: 3440     avg: 3508     median: 3536 (8%)     max: 3549 Points
PCMark for Android - PCM f. Android Work Score 2.0
min: 5785     avg: 5942     median: 5921.5 (39%)     max: 6076 Points
PCMark for Android - PCM f. Android Work Score
min: 6566     avg: 7099     median: 7152 (36%)     max: 7498 Points

Average Benchmarks Qualcomm Snapdragon 632 → 100% n=21

Average Benchmarks Samsung Exynos 7870 Octa → 62% n=21

- Range of benchmark values for this graphics card
red legend - Average benchmark values for this graphics card
* Smaller numbers mean a higher performance
1 This benchmark is not used for the average calculation

Add one or more devices and compare

In the following list you can select (and also search for) devices that should be added to the comparison. You can select more than one device.

restrict list:
v1.33
log 09. 12:37:48

#0 ran 0s before starting gpusingle class +0s ... 0s

#1 checking url part for id 11121 +0s ... 0s

#2 checking url part for id 8118 +0s ... 0s

#3 redirected to Ajax server, took 1754735868s time from redirect:0 +0s ... 0s

#4 did not recreate cache, as it is less than 5 days old! Created at Fri, 08 Aug 2025 14:21:35 +0200 +0s ... 0s

#5 composed specs +0.004s ... 0.004s

#6 did output specs +0s ... 0.004s

#7 getting avg benchmarks for device 11121 +0.004s ... 0.008s

#8 got single benchmarks 11121 +0.006s ... 0.014s

#9 getting avg benchmarks for device 8118 +0.001s ... 0.015s

#10 got single benchmarks 8118 +0.008s ... 0.023s

#11 got avg benchmarks for devices +0s ... 0.023s

#12 min, max, avg, median took s +0.02s ... 0.043s

#13 return log +0s ... 0.043s

Please share our article, every link counts!
Mail Logo
> Expert Reviews and News on Laptops, Smartphones and Tech Innovations > Benchmarks / Tech > Processor Comparison - Head 2 Head
Redaktion, 2017-09- 8 (Update: 2023-07- 1)