Review AMD Trinity and FX Desktop Processors

For the original German article, see here.
Although we usually focus on mobile devices like smartphones, tablets, and notebooks, we will have a look at the current CPU series from AMD in this test. At the center of our interest are especially the three Trinity-APUs A4-5300, A8-5600K, and A10-5800K, which we will compare to the competition from Intel and the current CPU flagship from AMD, the FX-8350.
Apart from the performance of the processors, we will also evaluate the performance of their integrated graphics solutions. The one from the Trinity family is said to be especially powerful. How do the "smaller APUs" with significantly less units perform? Can they run current games smoothly with decent graphics quality?
Test system
Some of the components of our test systems come directly from the manufacturers and some come from retail shops:
- AMD processors: FX-8350, A10-5800K, A8-5600K, A4-5300 (made available by: AMD)
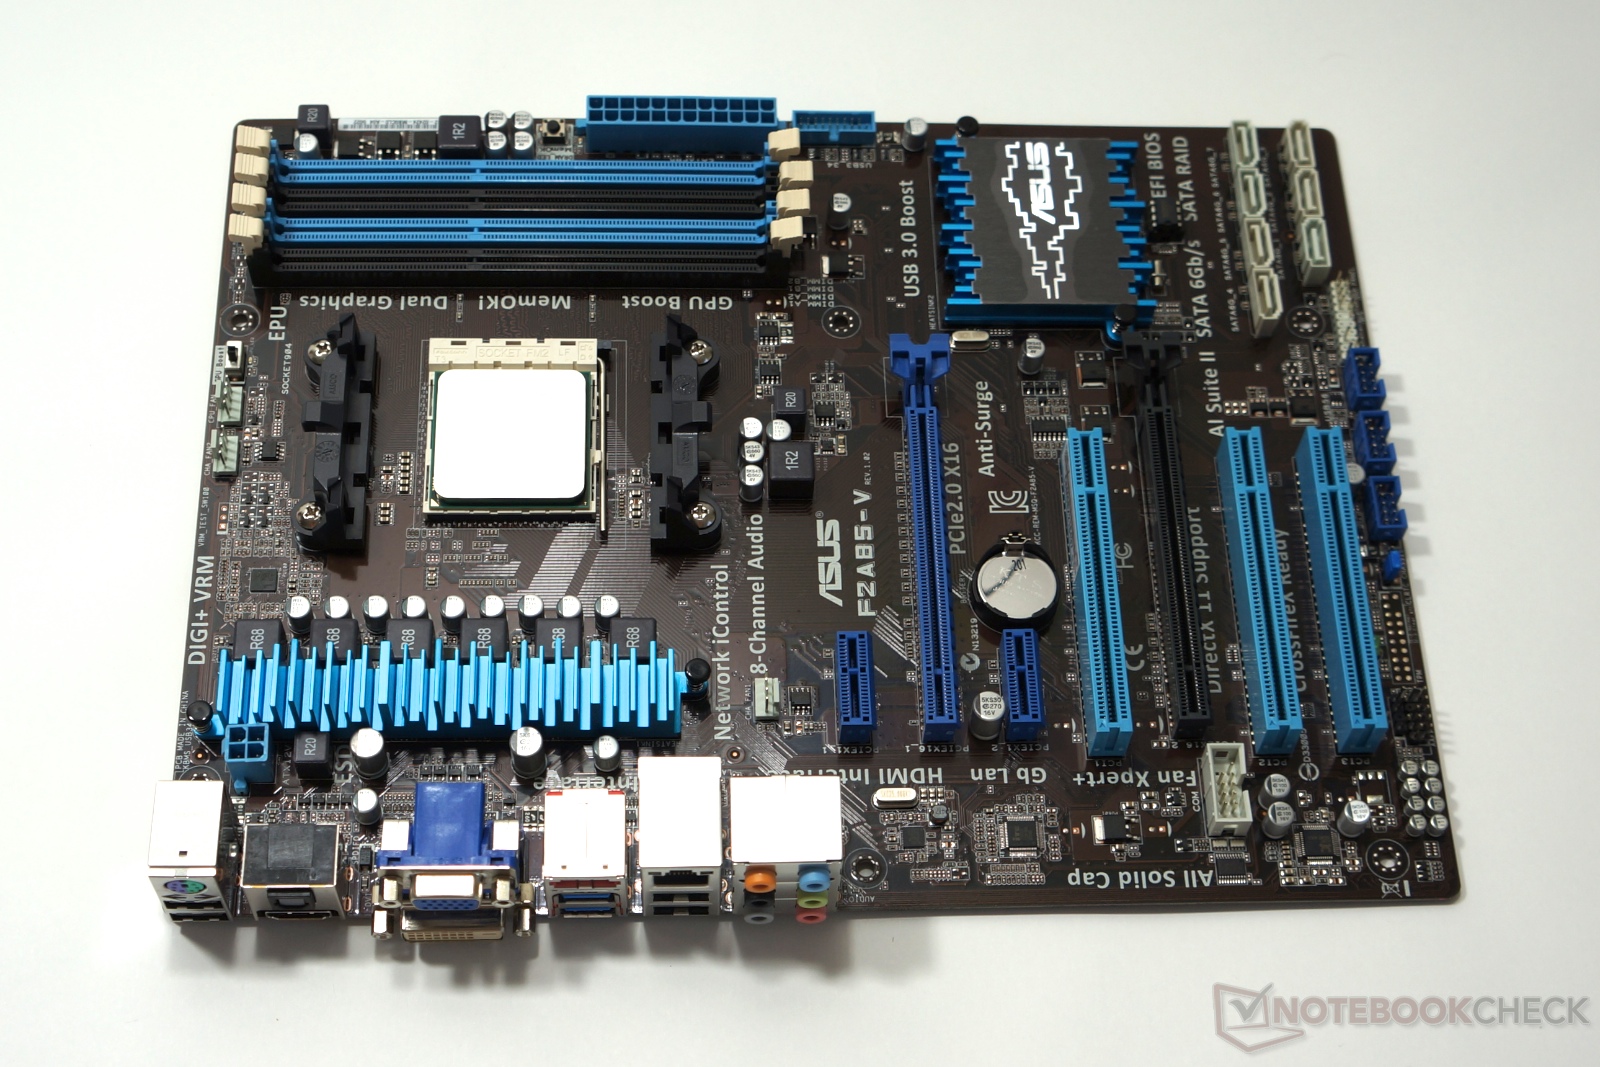
- AMD motherboards: Asus F2A85-V (FM2), M5A97 Evo (AM3+, BIOS 1006) (made available by: Asus)
- Intel processors: Core i7-3770K, Core i5-3550, Core i5-3470 (made available by: Intel); Core i3-3220, Pentium G860 (made available by: pco.co.at)
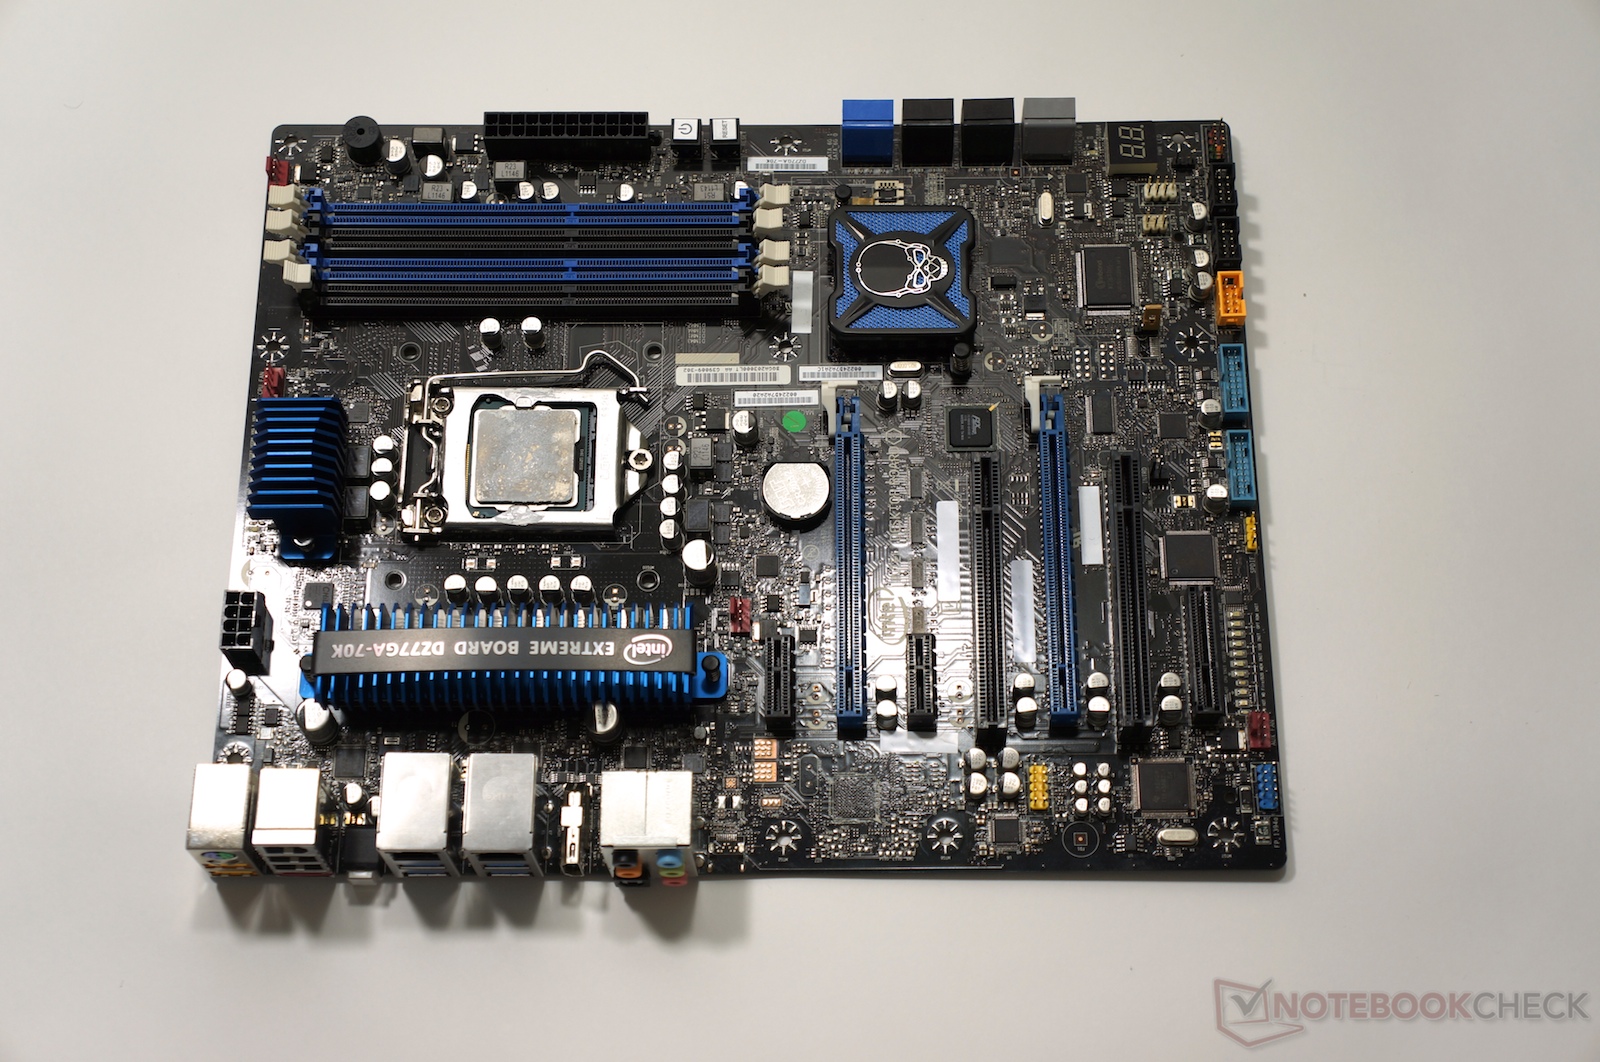
- Intel motherboard: DZ77GA-70K pre-sample (made available by: Intel)
- RAM: 2x 4 GB ADATA XPG X Series DDR3-2133 (made available by: Adata)
- System drives: Intel SSD 520 and Samsung SSD 840 Pro
- Graphics drivers: 9.17.10.2932 (Intel), Catalyst 13.2 (AMD)
Contenders
An overview of the most important technical details of the AMD processors is available below. The linked special articles of our CPU database provide detailed information. The following Intel CPUs are also not described closer here: Pentium G860, Core i3-3220, Core i5-3470, Core i5-3550, and Core i7-3770K. In addition, we want to refer to our special articles for the Trinity architecture and the Ivy-Bridge series.
- AMD A10-5800K: 2 modules (4 integer cores, 2 FPUs), 3.8 - 4.2 GHz, Radeon HD 7660D (384 shader units, 800 MHz), 100 Watt TDP;
Special feature: free multiplier
- AMD A8-5600K: 2 modules (4 integer cores, 2 FPUs), 3.6 - 3.9 GHz, Radeon HD 7560D (256 shader units, 760 MHz), 100 Watt TDP;
Special feature: free multiplier
- AMD A4-5300: 1 module (2 integer cores, 1 FPU), 3.4 - 3.6 GHz, Radeon HD 7480D (128 shader units, 724 MHz), 65 Watt TDP
- AMD FX-8350: 4 modules (8 integer cores, 4 FPUs), 4.0 - 4.2 GHz, 125 Watt TDP; Special features: free multiplier, no graphics unit
Processor Performance
| Cinebench R10 | |
| Rendering Single CPUs 64Bit (sort by value) | |
| A10-5800K DDR3-1600 | |
| A10-5800K DDR3-1866 | |
| A8-5600K | |
| A4-5300 | |
| FX-8350 | |
| i7-3770K | |
| Pentium G860 | |
| Core i3-3220 | |
| Core i5-3550 | |
| Core i5-3470 | |
| Rendering Multiple CPUs 64Bit (sort by value) | |
| A10-5800K DDR3-1600 | |
| A10-5800K DDR3-1866 | |
| A8-5600K | |
| A4-5300 | |
| FX-8350 | |
| i7-3770K | |
| Pentium G860 | |
| Core i3-3220 | |
| Core i5-3550 | |
| Core i5-3470 | |
| Rendering Single 32Bit (sort by value) | |
| A10-5800K DDR3-1600 | |
| A10-5800K DDR3-1866 | |
| A8-5600K | |
| A4-5300 | |
| FX-8350 | |
| i7-3770K | |
| Pentium G860 | |
| Core i3-3220 | |
| Core i5-3550 | |
| Core i5-3470 | |
| Rendering Multiple CPUs 32Bit (sort by value) | |
| A10-5800K DDR3-1600 | |
| A10-5800K DDR3-1866 | |
| A8-5600K | |
| A4-5300 | |
| FX-8350 | |
| i7-3770K | |
| Pentium G860 | |
| Core i3-3220 | |
| Core i5-3550 | |
| Core i5-3470 | |
| Cinebench R11.5 | |
| CPU Single 64Bit (sort by value) | |
| A10-5800K DDR3-1600 | |
| A10-5800K DDR3-1866 | |
| A8-5600K | |
| A4-5300 | |
| FX-8350 | |
| i7-3770K | |
| Pentium G860 | |
| Core i3-3220 | |
| Core i5-3550 | |
| Core i5-3470 | |
| CPU Multi 64Bit (sort by value) | |
| A10-5800K DDR3-1600 | |
| A10-5800K DDR3-1866 | |
| A8-5600K | |
| A4-5300 | |
| FX-8350 | |
| i7-3770K | |
| Pentium G860 | |
| Core i3-3220 | |
| Core i5-3550 | |
| Core i5-3470 | |
| Geekbench 2 - 32 Bit - Total Score (sort by value) | |
| A10-5800K DDR3-1600 | |
| A10-5800K DDR3-1866 | |
| A8-5600K | |
| A4-5300 | |
| FX-8350 | |
| i7-3770K | |
| Pentium G860 | |
| Core i3-3220 | |
| Core i5-3550 | |
| Core i5-3470 | |
| wPrime 2.10 - 32m (sort by value) | |
| A10-5800K DDR3-1600 | |
| A10-5800K DDR3-1866 | |
| A8-5600K | |
| A4-5300 | |
| FX-8350 | |
| i7-3770K | |
| Pentium G860 | |
| Core i3-3220 | |
| Core i5-3550 | |
| TrueCrypt | |
| AES Mean 100MB (sort by value) | |
| A10-5800K DDR3-1600 | |
| A10-5800K DDR3-1866 | |
| A8-5600K | |
| A4-5300 | |
| FX-8350 | |
| i7-3770K | |
| Pentium G860 | |
| Core i3-3220 | |
| Core i5-3550 | |
| Twofish Mean 100MB (sort by value) | |
| A10-5800K DDR3-1600 | |
| A10-5800K DDR3-1866 | |
| A8-5600K | |
| A4-5300 | |
| FX-8350 | |
| i7-3770K | |
| Pentium G860 | |
| Core i3-3220 | |
| Core i5-3550 | |
| Serpent Mean 100MB (sort by value) | |
| A10-5800K DDR3-1600 | |
| A10-5800K DDR3-1866 | |
| A8-5600K | |
| A4-5300 | |
| FX-8350 | |
| i7-3770K | |
| Pentium G860 | |
| Core i3-3220 | |
| Core i5-3550 | |
| X264 HD Benchmark 4.0 | |
| Pass 1 (sort by value) | |
| A10-5800K DDR3-1600 | |
| A10-5800K DDR3-1866 | |
| A8-5600K | |
| A4-5300 | |
| FX-8350 | |
| i7-3770K | |
| Pentium G860 | |
| Core i3-3220 | |
| Core i5-3550 | |
| Pass 2 (sort by value) | |
| A10-5800K DDR3-1600 | |
| A10-5800K DDR3-1866 | |
| A8-5600K | |
| A4-5300 | |
| FX-8350 | |
| i7-3770K | |
| Pentium G860 | |
| Core i3-3220 | |
| Core i5-3550 | |
| WinRAR - Result (sort by value) | |
| A10-5800K DDR3-1600 | |
| A10-5800K DDR3-1866 | |
| A8-5600K | |
| A4-5300 | |
| FX-8350 | |
| i7-3770K | |
| Pentium G860 | |
| Core i3-3220 | |
| Core i5-3550 | |
| 3DMark 06 - CPU - CPU Score (sort by value) | |
| A10-5800K DDR3-1600 | |
| A10-5800K DDR3-1866 | |
| A8-5600K | |
| A4-5300 | |
| FX-8350 GTX 470 | |
| i7-3770K | |
| Pentium G860 | |
| Core i3-3220 | |
| Core i5-3550 | |
| Core i5-3470 | |
* ... smaller is better
Gaming Performance
We will try to explain the vast quantity of numbers: On average, the fastest APU of the Trinity series, the A10-5800K, is about on par with the Intel Core i3-3220 of the Ivy Bridge generation. However, the results heavily depend on the benchmark: While the Core i3 especially profits from its high performance per MHz, the A10 takes advantage from its 4 integer cores. Therefore, the AMD processor performs better in well-parallelized applications and the i3 in single-threaded tasks. This gets especially obvious in the single and multi thread tests of Cinebench. Furthermore, there is another important difference: While only the more expensive Intel Core i5 and Core i7 CPUs implement the instruction set extension AES-NI which accelerates encryption, AMD does not restrict this feature to special CPU series. So, the AMD CPUs perform better in TrueCrypt and similar tasks.
While the A8-5600K is only slightly slower than the A10-5800K because of its lower clock rate, the A4-5300 and A6-5400K (not tested here) are significantly slower. Only half of the two modules or four CPU cores of the Trinity chip are active in these two models and so, the performance is cut in half. As a result, the A4-5300's performance does not even come close to the dual core Pentium G860: AMD's CMT technology, the base of the innovative module design, cannot reach the performance of "real" CPU cores.
The FX-8350, the Core i5-3470/3550, and the Core i7-3770K are at the top of the price and the performance ranking. Compared to the similarly expensive Core i5 models, the FX performs well and is even marginally better than the Intel on average. However, the AMD CPU profits from our application selection, as most of the applications are well-parallelized. The i7-3770K is still the undisputed winner. But, its unrivaled combination of performance, energy efficiency and OC potential is quite pricey.
| 3DMark 06 - 1280x1024 Standard Score AA:0x AF:0x (sort by value) | |
| A10-5800K DDR3-1600 | |
| A10-5800K DDR3-1866 | |
| A8-5600K | |
| A4-5300 | |
| FX-8350 GTX 470 | |
| i7-3770K | |
| Pentium G860 | |
| Core i3-3220 | |
| Core i5-3550 | |
| Core i5-3470 | |
| 3DMark 11 - 1280x720 Performance GPU (sort by value) | |
| A10-5800K DDR3-1600 | |
| A10-5800K DDR3-1866 | |
| A8-5600K | |
| A4-5300 | |
| FX-8350 GTX 470 | |
| i7-3770K | |
| Core i3-3220 | |
| Core i5-3550 | |
| Core i5-3470 | |
| 3DMark Vantage - 1280x1024 P GPU no PhysX (sort by value) | |
| A10-5800K DDR3-1600 | |
| A10-5800K DDR3-1866 | |
| A8-5600K | |
| A4-5300 | |
| FX-8350 GTX 470 | |
| i7-3770K | |
| Pentium G860 | |
| Core i3-3220 | |
| Core i5-3550 | |
| Core i5-3470 | |
| 3DMark | |
| 1920x1080 Fire Strike Graphics (sort by value) | |
| A10-5800K DDR3-1600 | |
| A10-5800K DDR3-1866 | |
| A8-5600K | |
| A4-5300 | |
| FX-8350 GTX 470 | |
| i7-3770K | |
| Core i3-3220 | |
| Core i5-3550 | |
| Core i5-3470 | |
| 1280x720 Cloud Gate Standard Graphics (sort by value) | |
| A10-5800K DDR3-1600 | |
| A10-5800K DDR3-1866 | |
| A8-5600K | |
| A4-5300 | |
| FX-8350 GTX 470 | |
| i7-3770K | |
| Pentium G860 | |
| Core i3-3220 | |
| Core i5-3550 | |
| Core i5-3470 | |
| 1280x720 Ice Storm Standard Graphics (sort by value) | |
| A10-5800K DDR3-1600 | |
| A10-5800K DDR3-1866 | |
| A8-5600K | |
| A4-5300 | |
| FX-8350 GTX 470 | |
| i7-3770K | |
| Pentium G860 | |
| Core i3-3220 | |
| Core i5-3550 | |
| Core i5-3470 | |
Let's turn to the integrated graphics solutions. As expected, Intel can hardly keep up with AMD in this aspect. This could change with the Haswell architecture expected shortly. So far, the Trinity APUs dominate the competition - that is apart from the smallest A4-5300. However, the performance also differs much within the APU series: The Radeon HD 7660D is more than twice as fast as the severely cut down Radeon HD 7480D. The mid range Radeon HD 7560D positions itself in-between the two and is just slightly faster than the HD Graphics 4000. Also, the fastest model is still a multiple slower than a dedicated mid-range graphics card for about 80 Euros (~$104). The fast DDR3-1866 RAM also does not improve this. It only brings a performance gain of about 4%.
Meanwhile, you can find the HD Graphics (Sandy Bridge) and the HD Graphics 2500 at the tail end of the field. These are versions of the HD Graphics 3000 (Sandy Bridge) or HD Graphics 4000 (Ivy Bridge) with deactivated parts. As a result their performance is even lower. Also, GPUs of the Sandy Bridge generation do not support DirectX 11. Therefore, they cannot run several benchmarks, e.g. 3DMark 11.
| Hitman: Absolution | |
| 1920x1080 Ultra Preset AA:4xMS AF:16x (sort by value) | |
| A10-5800K DDR3-1600 | |
| A10-5800K DDR3-1866 | |
| A8-5600K | |
| A4-5300 | |
| Core i5-3470 | |
| 1366x768 High Preset AA:2xMS AF:8x (sort by value) | |
| A10-5800K DDR3-1600 | |
| A10-5800K DDR3-1866 | |
| A8-5600K | |
| A4-5300 | |
| Core i5-3470 | |
| 1366x768 Medium Preset AF:2x (sort by value) | |
| A10-5800K DDR3-1600 | |
| A10-5800K DDR3-1866 | |
| A8-5600K | |
| A4-5300 | |
| Core i3-3220 | |
| Core i5-3470 | |
| 1024x768 Lowest Preset (sort by value) | |
| A10-5800K DDR3-1600 | |
| A10-5800K DDR3-1866 | |
| A8-5600K | |
| A4-5300 | |
| Core i3-3220 | |
| Core i5-3470 | |
| BioShock Infinite | |
| 1920x1080 Ultra Preset, DX11 (DDOF) (sort by value) | |
| A10-5800K DDR3-1600 | |
| A10-5800K DDR3-1866 | |
| A8-5600K | |
| A4-5300 | |
| FX-8350 GTX 470 | |
| 1366x768 High Preset (sort by value) | |
| A10-5800K DDR3-1600 | |
| A10-5800K DDR3-1866 | |
| A8-5600K | |
| A4-5300 | |
| FX-8350 GTX 470 | |
| 1366x768 Medium Preset (sort by value) | |
| A10-5800K DDR3-1600 | |
| A10-5800K DDR3-1600 | |
| A10-5800K DDR3-1866 | |
| A8-5600K | |
| A4-5300 | |
| FX-8350 GTX 470 | |
| 1280x720 Very Low Preset (sort by value) | |
| A10-5800K DDR3-1600 | |
| A10-5800K DDR3-1866 | |
| A8-5600K | |
| A4-5300 | |
| FX-8350 GTX 470 | |
| SimCity | |
| 1920x1080 Ultra / High AA:on (sort by value) | |
| A10-5800K DDR3-1600 | |
| A10-5800K DDR3-1866 | |
| A8-5600K | |
| A4-5300 | |
| FX-8350 GTX 470 | |
| 1366x768 High AA:on (sort by value) | |
| A10-5800K DDR3-1600 | |
| A10-5800K DDR3-1866 | |
| A8-5600K | |
| A4-5300 | |
| 1366x768 Medium (sort by value) | |
| A10-5800K DDR3-1600 | |
| A10-5800K DDR3-1866 | |
| A8-5600K | |
| A4-5300 | |
| Core i5-3550 | |
| 1024x768 Low (sort by value) | |
| A10-5800K DDR3-1600 | |
| A10-5800K DDR3-1866 | |
| A8-5600K | |
| A4-5300 | |
| FX-8350 GTX 470 | |
| Core i5-3550 | |
| Tomb Raider | |
| 1920x1080 Ultra Preset AA:FX AF:16x (sort by value) | |
| A10-5800K DDR3-1600 | |
| A10-5800K DDR3-1866 | |
| A8-5600K | |
| A4-5300 | |
| FX-8350 GTX 470 | |
| 1366x768 High Preset AA:FX AF:8x (sort by value) | |
| A10-5800K DDR3-1600 | |
| A10-5800K DDR3-1866 | |
| A8-5600K | |
| A4-5300 | |
| FX-8350 GTX 470 | |
| 1366x768 Normal Preset AA:FX AF:4x (sort by value) | |
| A10-5800K DDR3-1600 | |
| A10-5800K DDR3-1866 | |
| A8-5600K | |
| A4-5300 | |
| FX-8350 GTX 470 | |
| 1024x768 Low Preset (sort by value) | |
| A10-5800K DDR3-1600 | |
| A10-5800K DDR3-1866 | |
| A8-5600K | |
| A4-5300 | |
| FX-8350 GTX 470 | |
| F1 2012 | |
| 1920x1080 Ultra Preset AA:4xMS (sort by value) | |
| A10-5800K DDR3-1600 | |
| A10-5800K DDR3-1866 | |
| A8-5600K | |
| A4-5300 | |
| Core i3-3220 | |
| Core i5-3470 | |
| 1366x768 High Preset AA:2xMS (sort by value) | |
| A10-5800K DDR3-1600 | |
| A10-5800K DDR3-1866 | |
| A8-5600K | |
| A4-5300 | |
| Core i3-3220 | |
| Core i5-3470 | |
| 1366x768 Medium Preset (sort by value) | |
| A10-5800K DDR3-1600 | |
| A10-5800K DDR3-1866 | |
| A8-5600K | |
| A4-5300 | |
| Core i3-3220 | |
| Core i5-3470 | |
| 1024x768 Ultra Low Preset (sort by value) | |
| A10-5800K DDR3-1600 | |
| A10-5800K DDR3-1866 | |
| A8-5600K | |
| A4-5300 | |
| Core i3-3220 | |
| Core i5-3470 | |
One of the most interesting questions of this review is whether the APUs, especially the smaller ones, are capable of current 3D games. Let's start with the A10-5800K / Radeon HD 7660D: Depending on its graphical demands, a game can be run with about medium settings and a resolution of 1366x768 pixels. So, most occasional gamers should be satisfied. Apart from Tomb Raider, which gets about 20% faster, faster RAM hardly has an impact.
The A8-5600K / Radeon HD 7560D follows close behind the A10-5800K. Although it only features a third of the shader units, it is only 10% slower. Meanwhile, the A4-5300 / Radeon HD 7480D is only half as fast as the top model. This might not only be caused by the slower GPU, but also by the severely cut down CPU. So, the user has to live with 1024x768 pixels and minimum details and this will still not guarantee smooth frame rates in all situations and games.
Further game tests are available in our always up-to-date graphics articles about the Radeon HD 7660D, Radeon HD 7560D, and Radeon HD 7480D.
As this review does not focus on Intel GPUs, we refer to the special articles of the HD Graphics, HD 2500, and the HD 4000 for further details. The ranking in our synthetic benchmarks and real games only marginally differs.
Compute Performance
| ComputeMark v2.1 | |
| 1024x600 Normal, QJuliaRayTrace (sort by value) | |
| A10-5800K DDR3-1600 | |
| A10-5800K DDR3-1866 | |
| A8-5600K | |
| A4-5300 | |
| i7-3770K | |
| Core i3-3220 | |
| Core i5-3550 | |
| Core i5-3470 | |
| 1024x600 Normal, Mandel Scalar (sort by value) | |
| A10-5800K DDR3-1600 | |
| A10-5800K DDR3-1866 | |
| A8-5600K | |
| A4-5300 | |
| i7-3770K | |
| Core i3-3220 | |
| Core i5-3550 | |
| Core i5-3470 | |
| 1024x600 Normal, Mandel Vector (sort by value) | |
| A10-5800K DDR3-1600 | |
| A10-5800K DDR3-1866 | |
| A8-5600K | |
| A4-5300 | |
| i7-3770K | |
| Core i3-3220 | |
| Core i5-3550 | |
| Core i5-3470 | |
| 1024x600 Normal, Fluid 2DTexArr (sort by value) | |
| A10-5800K DDR3-1600 | |
| A10-5800K DDR3-1866 | |
| A8-5600K | |
| A4-5300 | |
| i7-3770K | |
| Core i3-3220 | |
| Core i5-3550 | |
| Core i5-3470 | |
| 1024x600 Normal, Fluid 3DTex (sort by value) | |
| A10-5800K DDR3-1600 | |
| A10-5800K DDR3-1866 | |
| A8-5600K | |
| A4-5300 | |
| i7-3770K | |
| Core i3-3220 | |
| Core i5-3550 | |
| Core i5-3470 | |
| 1024x600 Normal, Score (sort by value) | |
| A10-5800K DDR3-1600 | |
| A10-5800K DDR3-1866 | |
| A8-5600K | |
| A4-5300 | |
| i7-3770K | |
| Core i3-3220 | |
| Core i5-3550 | |
| Core i5-3470 | |
| LuxMark v2.0 64Bit | |
| Room GPUs-only (sort by value) | |
| A10-5800K DDR3-1600 | |
| A10-5800K DDR3-1866 | |
| A8-5600K | |
| A4-5300 | |
| i7-3770K | |
| Core i3-3220 | |
| Core i5-3550 | |
| Core i5-3470 | |
| Sala GPUs-only (sort by value) | |
| A10-5800K DDR3-1600 | |
| A10-5800K DDR3-1866 | |
| A8-5600K | |
| A4-5300 | |
| i7-3770K | |
| Core i3-3220 | |
| Core i5-3550 | |
| Core i5-3470 | |
Thanks to standardized interfaces like OpenCL or DirectCompute the shader units of the integrated GPUs can also perform general calculations. That is except for the Sandy Bridge graphics. Once again the AMD APUs perform better here. This said, Intel's HD 4000 can at least keep up with the A4-5300.
Please note: The recently introduced 15.31 driver significantly improved the OpenCL performance of Ivy Bridge GPUs. In Luxmark, the scores increased to 251 (Sala) and 163 points (Room) and exceed the Radeon HD 7660D's.
At present, there are still only few applications which profit from the compute features in practice. But, this should change in the medium term. So, a fast GPU should no longer only pay off in games. This is a further reason why AMD and Intel consider the graphics unit more and more important. AMD is still slightly better here, but Intel quickly recovers lost ground.

Verdict
The APUs of the A series are inexpensive alternatives to the FX family without GPU and deliver sufficient performance reserves for many everyday tasks. Even the cheapest model, the A4-5300 for only about 40 Euros (~$52), more than suffices for multimedia tasks, web surfing, and simple office tasks.
If you use more demanding software for image editing or video conversion (without GPU support) you should consider the A8-5600K (about 80 Euros, ~$104) or the A10-5800K (about 100 Euros, ~$130). As they feature double the modules and cores, they are more appropriate for excessive multitasking and shine with fast GPUs, which can run many of today's games without stuttering. If desired, the "K"-APUs can simply be overclocked by increasing the multiplier. If the cooling system works sufficiently, 4.5 GHz is possible without problems in many scenarios. On the contrary, the Intel CPU counterparts of the Celeron, Pentium and i3 series unfortunately do not support overclocking, but have other advantages like significantly lower energy consumption (under load and partial load).
The energy consumption is also one of the biggest disadvantages of the FX-8350. If you do not need an integrated graphics solution, you'll get vast processing performance for comparably little money (about 170 Euros, ~$222). In well-parallelized applications the FX even achieves a performance close to the Core i7-3770K, which costs about 100 Euros (~$130) more. But, on average, it "only" delivers a performance about on par with Core i5 CPUs.
Finally, many thanks to Adata, Asus, the pco.co.at shop AMD, and Intel for making the respective components available to us!
| A10-5800K DDR3-1600 Radeon HD 7660D, AMD A10-5800K | A10-5800K DDR3-1866 Radeon HD 7660D, AMD A10-5800K | A8-5600K Radeon HD 7560D, AMD A8-5600K | A4-5300 Radeon HD 7480D, AMD A4-5300, Intel SSD 520 Series SSDSC2CW240A | FX-8350 Radeon HD 6450 GDDR5, FX-8350, Intel SSD 520 Series SSDSC2CW240A | FX-8350 GTX 470 GeForce GTX 470, FX-8350, Intel SSD 520 Series SSDSC2CW240A | i7-3770K HD Graphics 4000, 3770K, Intel SSD 520 Series SSDSC2CW240A | Pentium G860 HD Graphics (Sandy Bridge), G860, Intel SSD 520 Series SSDSC2CW240A | Core i3-3220 HD Graphics 2500, 3220, Intel SSD 520 Series SSDSC2CW240A | Core i5-3550 HD Graphics 2500, 3550, Intel SSD 520 Series SSDSC2CW240A | Core i5-3470 HD Graphics 2500, 3470, Intel SSD 520 Series SSDSC2CW240A | |
|---|---|---|---|---|---|---|---|---|---|---|---|
| Cinebench R10 | -1% | -5% | -34% | 42% | 98% | -1% | 24% | 72% | 65% | ||
| Rendering Single CPUs 64Bit (Points) | 4221 | 4139 -2% | 3983 -6% | 3645 -14% | 4346 3% | 6972 65% | 4953 17% | 5847 39% | 6568 56% | 6328 50% | |
| Rendering Multiple CPUs 64Bit (Points) | 12987 | 12959 0% | 12505 -4% | 5867 -55% | 23538 81% | 27536 112% | 9063 -30% | 12546 -3% | 22729 75% | 21594 66% | |
| Rendering Single 32Bit (Points) | 3131 | 3056 -2% | 2941 -6% | 2734 -13% | 3201 2% | 5536 77% | 3964 27% | 4626 48% | 5191 66% | 5006 60% | |
| Rendering Multiple CPUs 32Bit (Points) | 9285 | 9266 0% | 8838 -5% | 4345 -53% | 16904 82% | 22190 139% | 7695 -17% | 10193 10% | 17762 91% | 17192 85% | |
| Cinebench R11.5 | -1% | -5% | -34% | 58% | 99% | -7% | 17% | 63% | 57% | ||
| CPU Single 64Bit (Points) | 1.04 | 1.02 -2% | 0.98 -6% | 0.91 -12% | 1.1 6% | 1.65 59% | 1.2 15% | 1.38 33% | 1.56 50% | 1.51 45% | |
| CPU Multi 64Bit (Points) | 3.3 | 3.33 1% | 3.2 -3% | 1.45 -56% | 6.89 109% | 7.88 139% | 2.34 -29% | 3.31 0% | 5.81 76% | 5.57 69% | |
| Geekbench 2 - 32 Bit | |||||||||||
| Total Score (Points) | 6969 | 6945 0% | 6520 -6% | 4268 -39% | 11198 61% | 12435 78% | 5393 -23% | 7008 1% | 8990 29% | 9721 39% | |
| wPrime 2.10 | |||||||||||
| 32m * (s) | 15.9 | 15.9 -0% | 16.7 -5% | 35.5 -123% | 7.96 50% | 6.39 60% | 23.6 -48% | 14.66 8% | 9.98 37% | ||
| TrueCrypt | 0% | -5% | -57% | 96% | 90% | -64% | -43% | 31% | |||
| AES Mean 100MB (GB/s) | 1.9 | 1.9 0% | 1.8 -5% | 0.823 -57% | 3.6 89% | 3.9 105% | 0.229 -88% | 0.318 -83% | 2.7 42% | ||
| Twofish Mean 100MB (GB/s) | 0.38 | 0.379 0% | 0.36 -5% | 0.165 -57% | 0.749 97% | 0.678 78% | 0.179 -53% | 0.288 -24% | 0.448 18% | ||
| Serpent Mean 100MB (GB/s) | 0.209 | 0.208 0% | 0.198 -5% | 0.093 -56% | 0.423 102% | 0.392 88% | 0.102 -51% | 0.166 -21% | 0.28 34% | ||
| X264 HD Benchmark 4.0 | -1% | -5% | -55% | 64% | 79% | -39% | -11% | 51% | |||
| Pass 1 (fps) | 107.6 | 105.6 -2% | 102.4 -5% | 50 -54% | 139 29% | 172.3 60% | 70.3 -35% | 98.6 -8% | 163.8 52% | ||
| Pass 2 (fps) | 21.9 | 21.8 0% | 20.93 -4% | 9.62 -56% | 43.5 99% | 43.4 98% | 12.69 -42% | 18.82 -14% | 32.7 49% | ||
| WinRAR | |||||||||||
| Result (KB/s) | 2530 | 2472 -2% | 2449 -3% | 1347 -47% | 4562 80% | 3698 46% | 1655 -35% | 2695 7% | 3375 33% | ||
| 3DMark 06 - CPU | |||||||||||
| CPU Score (Points) | 4311 | 4464 4% | 4295 0% | 2284 -47% | 6648 54% | 7606 76% | 3065 -29% | 4019 -7% | 6405 49% | 6179 43% | |
| Total Average (Program / Settings) | -0% /
-0% | -4% /
-5% | -55% /
-49% | 64% /
64% | 54% /
54% | 78% /
85% | -31% /
-28% | -1% /
-1% | 46% /
50% | 51% /
57% |
* ... smaller is better
