

NVIDIA Quadro FX 570M vs NVIDIA Quadro FX 1700M vs NVIDIA Quadro FX 360M
NVIDIA Quadro FX 570M
► remove from comparisonPerformance workstation grafic chip with DirectX 10 support and OpenGL 2.1 support. Probaby, it bases upon the NVIDIA GeForce 8600M GT.
It is intended for digital content creators, engineers, geologic scientists and other professional 3D applications.
The drivers of the Quadro FX series are certified for CAD applications (e.g. AutoCad, Inventor, Solidstation, Solid Edge, ...) and DCC applications (e.g. Maya, 3DS Max, Lightwave 3D, ...) and offer a 12-bit precision for subpixel, full image-antialiasing, hardware accelerated antialiasing for dots and lines and additional drivers are for CAD and DCC optimized settings.
NVIDIA Quadro FX 1700M
► remove from comparison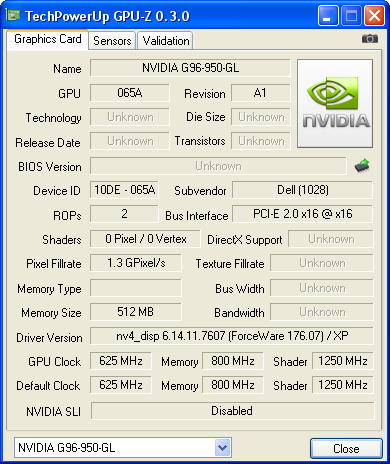
The Nvidia Quadro FX 1700M is a professional graphics adapter for CAD and 3D applications. It is based on the G96 core (GeForce 9650M e.g.) but with different drivers, that are optimized for OpenGL and professional applications. The drivers are zertified to work flawlessly with different applications.
Compared to the Quadro FX 1600M, the FX 1700M GPU supports Powermizer 8.0.
NVIDIA Quadro FX 360M
► remove from comparisonFor CAD and professional applications certified GPU based on the 8400M GS. The higher power consumption of 17 Watt versus 11 Watt of the 8400M GS indicates a higher performance.
| NVIDIA Quadro FX 570M | NVIDIA Quadro FX 1700M | NVIDIA Quadro FX 360M | |||||||||||||||||||||||||||||||||||||||||||||||||||||||||||||||||||||||||||||||||||||||||||||||||||||||||||||||||||||||||||||||||||||||||||||||||||||||||||||||||||
| Quadro FX Series |
|
|
| ||||||||||||||||||||||||||||||||||||||||||||||||||||||||||||||||||||||||||||||||||||||||||||||||||||||||||||||||||||||||||||||||||||||||||||||||||||||||||||||||||
| Codename | G64GLM | NB9P-GLM | NB8M-GLM | ||||||||||||||||||||||||||||||||||||||||||||||||||||||||||||||||||||||||||||||||||||||||||||||||||||||||||||||||||||||||||||||||||||||||||||||||||||||||||||||||||
| Architecture | G8x | G9x | |||||||||||||||||||||||||||||||||||||||||||||||||||||||||||||||||||||||||||||||||||||||||||||||||||||||||||||||||||||||||||||||||||||||||||||||||||||||||||||||||||
| Pipelines | 32 - unified | 32 - unified | 16 - unified | ||||||||||||||||||||||||||||||||||||||||||||||||||||||||||||||||||||||||||||||||||||||||||||||||||||||||||||||||||||||||||||||||||||||||||||||||||||||||||||||||||
| Core Speed | 475 MHz | 625 MHz | 400 MHz | ||||||||||||||||||||||||||||||||||||||||||||||||||||||||||||||||||||||||||||||||||||||||||||||||||||||||||||||||||||||||||||||||||||||||||||||||||||||||||||||||||
| Shader Speed | 950 MHz | 1250 MHz | 800 MHz | ||||||||||||||||||||||||||||||||||||||||||||||||||||||||||||||||||||||||||||||||||||||||||||||||||||||||||||||||||||||||||||||||||||||||||||||||||||||||||||||||||
| Memory Speed | 700 MHz | 800 MHz | 600 MHz | ||||||||||||||||||||||||||||||||||||||||||||||||||||||||||||||||||||||||||||||||||||||||||||||||||||||||||||||||||||||||||||||||||||||||||||||||||||||||||||||||||
| Memory Bus Width | 128 Bit | 128 Bit | 64 Bit | ||||||||||||||||||||||||||||||||||||||||||||||||||||||||||||||||||||||||||||||||||||||||||||||||||||||||||||||||||||||||||||||||||||||||||||||||||||||||||||||||||
| Memory Type | GDDR3 | GDDR3 | GDDR3 | ||||||||||||||||||||||||||||||||||||||||||||||||||||||||||||||||||||||||||||||||||||||||||||||||||||||||||||||||||||||||||||||||||||||||||||||||||||||||||||||||||
| Max. Amount of Memory | 256 MB | 256 MB | 256 MB | ||||||||||||||||||||||||||||||||||||||||||||||||||||||||||||||||||||||||||||||||||||||||||||||||||||||||||||||||||||||||||||||||||||||||||||||||||||||||||||||||||
| Shared Memory | no | no | no | ||||||||||||||||||||||||||||||||||||||||||||||||||||||||||||||||||||||||||||||||||||||||||||||||||||||||||||||||||||||||||||||||||||||||||||||||||||||||||||||||||
| API | DirectX 10, Shader 4.0 | DirectX 10, Shader 4.0 | DirectX 10, Shader 4.0 | ||||||||||||||||||||||||||||||||||||||||||||||||||||||||||||||||||||||||||||||||||||||||||||||||||||||||||||||||||||||||||||||||||||||||||||||||||||||||||||||||||
| Power Consumption | 35 Watt | 50 Watt | 17 Watt | ||||||||||||||||||||||||||||||||||||||||||||||||||||||||||||||||||||||||||||||||||||||||||||||||||||||||||||||||||||||||||||||||||||||||||||||||||||||||||||||||||
| Transistors | 289 Million | 289 Million | 210 Million | ||||||||||||||||||||||||||||||||||||||||||||||||||||||||||||||||||||||||||||||||||||||||||||||||||||||||||||||||||||||||||||||||||||||||||||||||||||||||||||||||||
| technology | 80 nm | 65 nm | 80 nm | ||||||||||||||||||||||||||||||||||||||||||||||||||||||||||||||||||||||||||||||||||||||||||||||||||||||||||||||||||||||||||||||||||||||||||||||||||||||||||||||||||
| Notebook Size | medium sized | large | |||||||||||||||||||||||||||||||||||||||||||||||||||||||||||||||||||||||||||||||||||||||||||||||||||||||||||||||||||||||||||||||||||||||||||||||||||||||||||||||||||
| Date of Announcement | 01.06.2007 | 01.10.2008 | 09.05.2007 | ||||||||||||||||||||||||||||||||||||||||||||||||||||||||||||||||||||||||||||||||||||||||||||||||||||||||||||||||||||||||||||||||||||||||||||||||||||||||||||||||||
| Information | Powermizer 7.0, CG Shading language, 32 bit floating point precision, 12 bit subpixel precision, 128 bit graphic pipeline, vertex and pixelshader programmability, PureVideo HD, PCI-E interface, FSAA with turned grid, nView multidisplay support, high-precision dynamic-range (HPDR) technology, hardware 3D clipping, full image antialiasing | CG shading language, 32 Bit floating point precision, 12 Bit subpixel precision, 128 Bit precision of the graphics pipeline, FSAA with rotated raster, nView Mutlidisplay Support, High-Precision-Dynamic-Range (HPDR), Hardware 3D Clipping on window recognision, full screen AA | |||||||||||||||||||||||||||||||||||||||||||||||||||||||||||||||||||||||||||||||||||||||||||||||||||||||||||||||||||||||||||||||||||||||||||||||||||||||||||||||||||
| Link to Manufacturer Page | www.nvidia.de | www.nvidia.com | www.nvidia.de | ||||||||||||||||||||||||||||||||||||||||||||||||||||||||||||||||||||||||||||||||||||||||||||||||||||||||||||||||||||||||||||||||||||||||||||||||||||||||||||||||||
| Features | OpenGL 2.1, PureVideo HD, Powermizer 8.0, possible interfaces: LVDS, DVI, VGA, HDTV, HDCP, HDMI | PowerMizer 7.0, HDR, designed for Vista, 128 Bit HDR, OpenGl 2.1 |
Benchmarks

Average Benchmarks NVIDIA Quadro FX 570M → 100% n=5
Average Benchmarks NVIDIA Quadro FX 1700M → 146% n=5
Average Benchmarks NVIDIA Quadro FX 360M → 51% n=5
* Smaller numbers mean a higher performance
1 This benchmark is not used for the average calculation
Game Benchmarks
The following benchmarks stem from our benchmarks of review laptops. The performance depends on the used graphics memory, clock rate, processor, system settings, drivers, and operating systems. So the results don't have to be representative for all laptops with this GPU. For detailed information on the benchmark results, click on the fps number.

Crysis - GPU Benchmark
2007
Crysis - CPU Benchmark
2007
F.E.A.R.
2005
Doom 3
2004
Quake 3 Arena - Timedemo
1999Average Gaming NVIDIA Quadro FX 570M → 100%
Average Gaming 30-70 fps → 100%
Average Gaming NVIDIA Quadro FX 1700M → 125%
Average Gaming 30-70 fps → 174%
Average Gaming NVIDIA Quadro FX 360M → 56%
Average Gaming 30-70 fps → 48%
| NVIDIA Quadro FX 570M | NVIDIA Quadro FX 1700M | NVIDIA Quadro FX 360M | |||||||||||||||||||
|---|---|---|---|---|---|---|---|---|---|---|---|---|---|---|---|---|---|---|---|---|---|
| low | med. | high | ultra | QHD | 4K | low | med. | high | ultra | QHD | 4K | low | med. | high | ultra | QHD | 4K | ||||
| Crysis - GPU Benchmark | 33.31 | 19.06 | 10.07 | ||||||||||||||||||
| Crysis - CPU Benchmark | 29.3 | 17.07 | 7.39 | ||||||||||||||||||
| F.E.A.R. | 436 | 128 | 34 | 378 | 152 | 59 | 328 | 62 | 17 | ||||||||||||
| Quake 3 Arena - Timedemo | 501 | 610 | 242.7 | ||||||||||||||||||
| NVIDIA Quadro FX 570M | NVIDIA Quadro FX 1700M | NVIDIA Quadro FX 360M | |||||||||||||||||||
| low | med. | high | ultra | QHD | 4K | low | med. | high | ultra | QHD | 4K | low | med. | high | ultra | QHD | 4K | < 30 fps < 60 fps < 120 fps ≥ 120 fps | 1 | 1 | 1 1 | | | | < 30 fps < 60 fps < 120 fps ≥ 120 fps | 1 | 1 1 1 | 2 1 1 | | | | < 30 fps < 60 fps < 120 fps ≥ 120 fps | 1 | 2 1 | 1 1 | | | |
For more games that might be playable and a list of all games and graphics cards visit our Gaming List