Notebookcheck Logo

PowerVR GE8300 vs ARM Mali-400 MP

PowerVR GE8300

► remove from comparison

The PowerVR GE8300 by Imagination Technologies is an integrated graphics card for mid-range ARM SoCs. It belongs to the Series8XE series of GPUs (GE8xx0) and supports OpenGL ES 3.2, OpenCL 1.2, Android NN HAL API and Vulkan 1.0.

ARM Mali-400 MP

► remove from comparison ARM Mali-400 MP

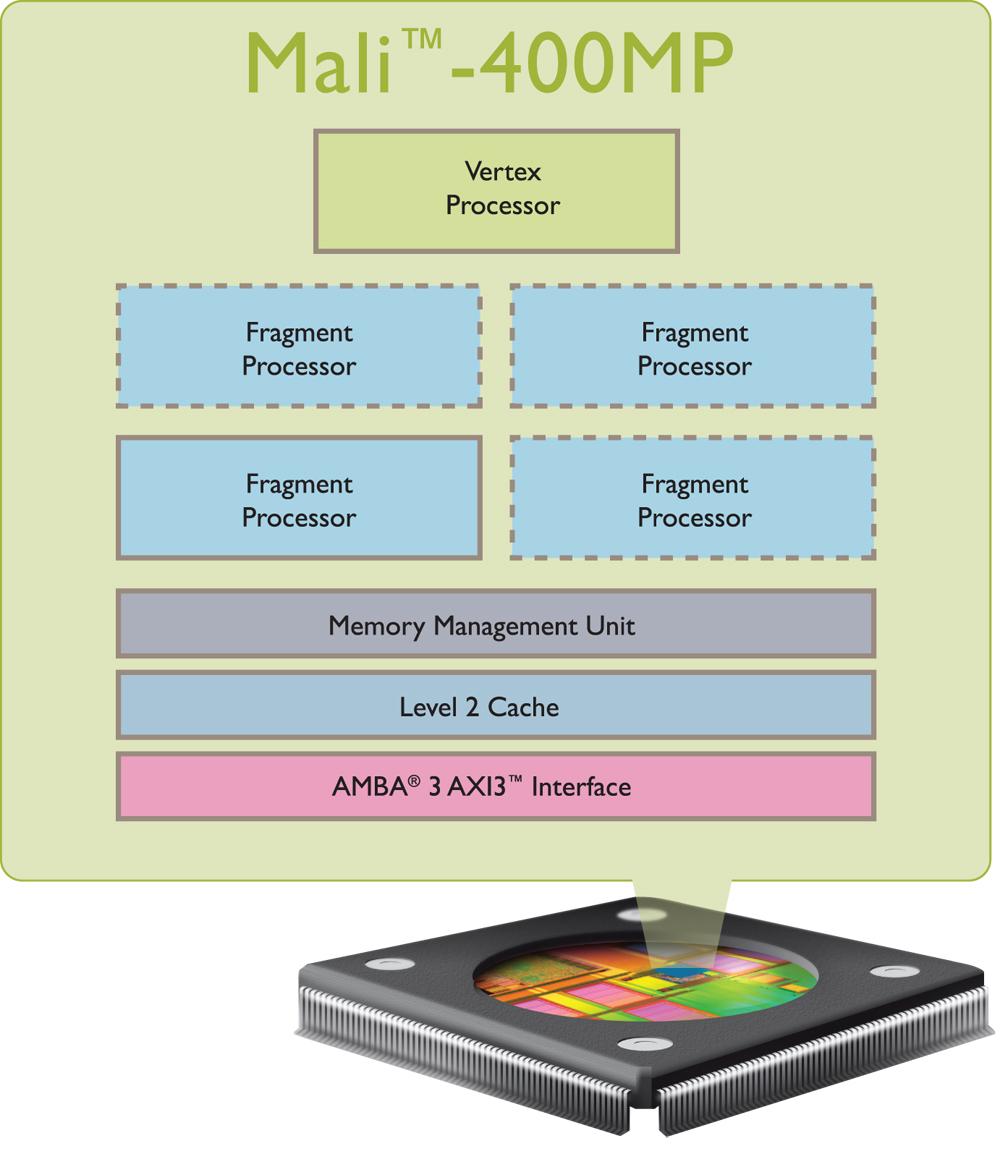
The ARM Mali-400 MP is an OpenGL ES 2.0 capable graphics card for ARM based SoCs (System on a Chip). Therefore, the chip is intended to be used in tablets and smartphones. The graphics card can be scaled from one to four cores (so called fragment processors). Furthermore, it got one vertex processor and should perform slightly below a PowerVR SGX 543MP2 (most likely the top version).

PowerVR GE8300ARM Mali-400 MP
Mali-400 MP Series
PowerVR GE8320 compare @ 0.4 - 0.65 GHz
PowerVR GE8300 @ 0.66 GHz
PowerVR GE8100 compare @ 0.57 GHz
Mali-400 MP4 compare 4/1 cores
Mali-400 MP2 compare 2/1 cores
Mali-400 MP 1-4/1 cores
ArchitecturePowerVR Series8XEUtgard
Core Speed660 MHz
Shared Memorynono
APIDirectX 10, OpenGL 3.x, 4.x, OpenGL ES 3.0OpenGL ES 2.0
technology20 nm
FeaturesOpenGL ES 3.2, Vulkan 1.1, OpenCL 1.2, Android NN HAL API Support
Date of Announcement09.09.2014 02.06.2008
Link to Manufacturer Pagewww.imgtec.comwww.arm.com
Pipelines1-4 / 1 Pixel- / Vertexshader
CPU in PowerVR GE8300GPU Base SpeedGPU Boost / Turbo
UNISOC Tiger T3104 x 1800 MHz? MHz800 MHz
Mediatek Helio A22 MT67614 x 2000 MHz? MHz? MHz
Mediatek MT8766B4 x 2000 MHz? MHz? MHz
min. - max.? MHz? - 800 MHz
CPU in Mali-400 MPGPU Base SpeedGPU Boost / Turbo
MediaTek MT83122 x 1300 MHz416 MHz? MHz
MediaTek MT65722 x 1200 MHz? MHz? MHz
WonderMedia PRIZM WM89501 x 1000 MHz? MHz? MHz
min. - max.? - 416 MHz? MHz

Benchmarks

3DMark - 3DMark Ice Storm Extreme Graphics
4908 Points (1%)
min: 667     avg: 1321     median: 1500.5 (0%)     max: 1753 Points
GFXBench - GFXBench 5.0 4K Aztec Ruins High Tier Offscreen
min: 0.38     avg: 0.4     median: 0.4 (0%)     max: 0.48 fps
GFXBench (DX / GLBenchmark) 2.7
GFXBench T-Rex HD Offscreen C24Z16 + PowerVR GE8300
GFXBench T-Rex HD Offscreen C24Z16 + ARM Mali-400 MP
AnTuTu 3DRating - 3DRating V4.0 for OpenGL ES 2.0
1981 Points (15%)
AnTuTu 3DRating - Antutu 3DRating Off-screen
min: 1030     avg: 1216     median: 1240 (43%)     max: 1355 Points
AnTuTu 3DRating - Antutu 3DRating Score
min: 1838     avg: 2394     median: 2310 (20%)     max: 3600 Points
AnTuTu v3 - AnTuTu v3 GPU
min: 1638     avg: 2894     median: 2495 (26%)     max: 4814 Points
Antutu v9 - AnTuTu v9 GPU
min: 9927     avg: 11148     median: 11148 (1%)     max: 12369 Points
Basemark ES 2.0 - Basemark ES 2.0
min: 8.45     avg: 25.9     median: 22 (36%)     max: 56.3 fps
Basemark X 1.1 - Basemark X 1.1 High Quality
min: 1697     avg: 1728     median: 1719 (4%)     max: 1769 Points
Basemark X 1.1 - Basemark X 1.1 Medium Quality
min: 4813     avg: 4961     median: 4956 (11%)     max: 5142 Points
Basemark GPU 1.2 - Basemark GPU 1.2 Vulkan Official Medium Offscreen 1080
7.5 fps (0%)
NenaMark2 - NenaMark2 Score
min: 21.6     avg: 44.3     median: 47.2 (70%)     max: 67.3 fps
PassMark PerformanceTest Mobile V1 - PerformanceTest Mobile V1 2D Graphics Tests
min: 2563     avg: 7985     median: 3272 (1%)     max: 27482 Points
min: 1704     avg: 2221     median: 2188 (1%)     max: 2587 Points
PassMark PerformanceTest Mobile V1 - PerformanceTest Mobile V1 3D Graphics Tests
min: 536     avg: 910     median: 678 (1%)     max: 1991 Points
min: 518     avg: 668     median: 704.5 (1%)     max: 733 Points
Power Consumption - GFXBench Aztec Ruins Normal Tier Offscreen Power Consumption 150cd *
min: 3.14     avg: 3.2     median: 3.2 (1%)     max: 3.33 Watt

Average Benchmarks PowerVR GE8300 → 100% n=5

Average Benchmarks ARM Mali-400 MP → 53% n=5

- Range of benchmark values for this graphics card
red legend - Average benchmark values for this graphics card
* Smaller numbers mean a higher performance
1 This benchmark is not used for the average calculation

Game Benchmarks

The following benchmarks stem from our benchmarks of review laptops. The performance depends on the used graphics memory, clock rate, processor, system settings, drivers, and operating systems. So the results don't have to be representative for all laptops with this GPU. For detailed information on the benchmark results, click on the fps number.

League of Legends: Wild Rift

League of Legends: Wild Rift

2020
low
100%
PowerVR GE8300:
44  fps
Call of Duty Mobile

Call of Duty Mobile

2020
low
100%
PowerVR GE8300:
39  fps
Armajet

Armajet

2020
high
100%
PowerVR GE8300:
30  fps
PUBG Mobile

PUBG Mobile

2018
low
100%
PowerVR GE8300:
21 25 26 ~ 24 fps
med.
100%
PowerVR GE8300:
16 25 26 ~ 22 fps
high
100%
PowerVR GE8300:
0 (!) 24 ~ 12 fps
Arena of Valor

Arena of Valor

2018
low
100%
PowerVR GE8300:
32 53 59 ~ 48 fps
ultra
100%
PowerVR GE8300:
31 50 52 ~ 44 fps
Shadow Fight 3

Shadow Fight 3

2018
low
100%
PowerVR GE8300:
38  fps
Dead Trigger 2

Dead Trigger 2

2013
high
100%
PowerVR GE8300:
30  fps
Asphalt 8: Airborne

Asphalt 8: Airborne

2013
low
100%
PowerVR GE8300:
17 29 ~ 23 fps
high
100%
PowerVR GE8300:
23  fps
Asphalt 9: Legends

Asphalt 9: Legends

2013
low
100%
PowerVR GE8300:
7 8.5 9 9.5 28 ~ 12 fps
high
100%
PowerVR GE8300:
8 9 14 ~ 10 fps

Average Gaming PowerVR GE8300 → 100%

Average Gaming 30-70 fps → 100%

PowerVR GE8300ARM Mali-400 MP
lowmed.highultraQHD4Klowmed.highultraQHD4K
League of Legends: Wild Rift44
Call of Duty Mobile39
Armajet30
PUBG Mobile242212
Arena of Valor4844
Shadow Fight 338
Dead Trigger 230
Asphalt 8: Airborne2323
Asphalt 9: Legends1210
PowerVR GE8300ARM Mali-400 MP
lowmed.highultraQHD4Klowmed.highultraQHD4K
< 30 fps
< 60 fps
< 120 fps
≥ 120 fps
3
4

1


3
2


1


< 30 fps
< 60 fps
< 120 fps
≥ 120 fps


For more games that might be playable and a list of all games and graphics cards visit our Gaming List

Add one or more devices and compare

In the following list you can select (and also search for) devices that should be added to the comparison. You can select more than one device.

restrict list:
v1.33
log 29. 05:09:51

#0 ran 0s before starting gpusingle class +0s ... 0s

#1 checking url part for id 9838 +0s ... 0s

#2 checking url part for id 2821 +0s ... 0s

#3 redirected to Ajax server, took 1753758591s time from redirect:0 +0s ... 0s

#4 did not recreate cache, as it is less than 5 days old! Created at Mon, 28 Jul 2025 05:18:01 +0200 +0s ... 0s

#5 composed specs +0.034s ... 0.034s

#6 did output specs +0s ... 0.034s

#7 start showIntegratedCPUs +0s ... 0.034s

#8 getting avg benchmarks for device 9838 +0.016s ... 0.05s

#9 got single benchmarks 9838 +0.021s ... 0.071s

#10 getting avg benchmarks for device 2821 +0s ... 0.071s

#11 got single benchmarks 2821 +0.015s ... 0.086s

#12 got avg benchmarks for devices +0s ... 0.086s

#13 min, max, avg, median took s +0.016s ... 0.102s

#14 before gaming benchmark output +0s ... 0.102s

#15 Got 30 rows for game benchmarks. +0.006s ... 0.108s

#16 composed SQL query for gamebenchmarks +0s ... 0.108s

#17 got data and put it in $dataArray +0.001s ... 0.109s

#18 benchmarks composed for output. +0.003s ... 0.112s

#19 calculated avg scores. +0s ... 0.112s

#20 return log +0.001s ... 0.113s

Please share our article, every link counts!
Mail Logo
> Expert Reviews and News on Laptops, Smartphones and Tech Innovations > Benchmarks / Tech > Graphics Card Comparison - Head 2 Head
Redaktion, 2017-09- 8 (Update: 2023-07- 1)