Notebookcheck Logo

Apple M1 vs Qualcomm Snapdragon 8 Gen 2

Apple M1

► remove from comparison Apple M1

The Apple M1 is a System on a Chip (SoC) from Apple that is found in the late 2020 MacBook Air, MacBook Pro 13, and Mac Mini. It offers 8 cores divided in four performance cores and four power-efficiency cores. The big cores offer 192 KB instruction cache, 128 KB data cache, and 12 MB shared L2 cache. According to Apple the performance of these cores should be better than anything on the market (in late 2020). The four efficiency cores are a lot smaller and offer only 128 KB instruction cache, 64 KB data cache, and 4 MB shared cache. The efficiency cores (E cluster) clock with 600 - 2064 MHz, the performance cores (P cluster) with 600 - 3204 MHz.

The M1 is available in two TDP variants, a passive cooled 10 Watt variant for the MacBook Air and an active cooled faster variant for the MacBook Pro 13 and Mac Mini. Those should offer a better-sustained performance according to Apple.

The integrated graphics card in the M1 offers 8 cores (7 cores in the entry MacBook Air) and a peak performance of 2.6 teraflops. Apple claims that it is faster than any other iGPU at the time of announcement.

Furthermore, the SoC integrates a fast 16 core neural engine with a peak performance of 11 TOPS (for AI hardware acceleration), a secure enclave (e.g., for encryption), a unified memory architecture, Thunderbolt / USB 4 controller, an ISP, and media de- and encoders.

The Apple M1 includes 16 billion transistors (up from the 10 billion of the A12Z Bionic and therefore double the amount of a Tiger Lake-U chip like the i7-1185G7) and is manufactured in 5nm at TSMC.

Qualcomm Snapdragon 8 Gen 2

► remove from comparison Qualcomm SD 8 Gen 2

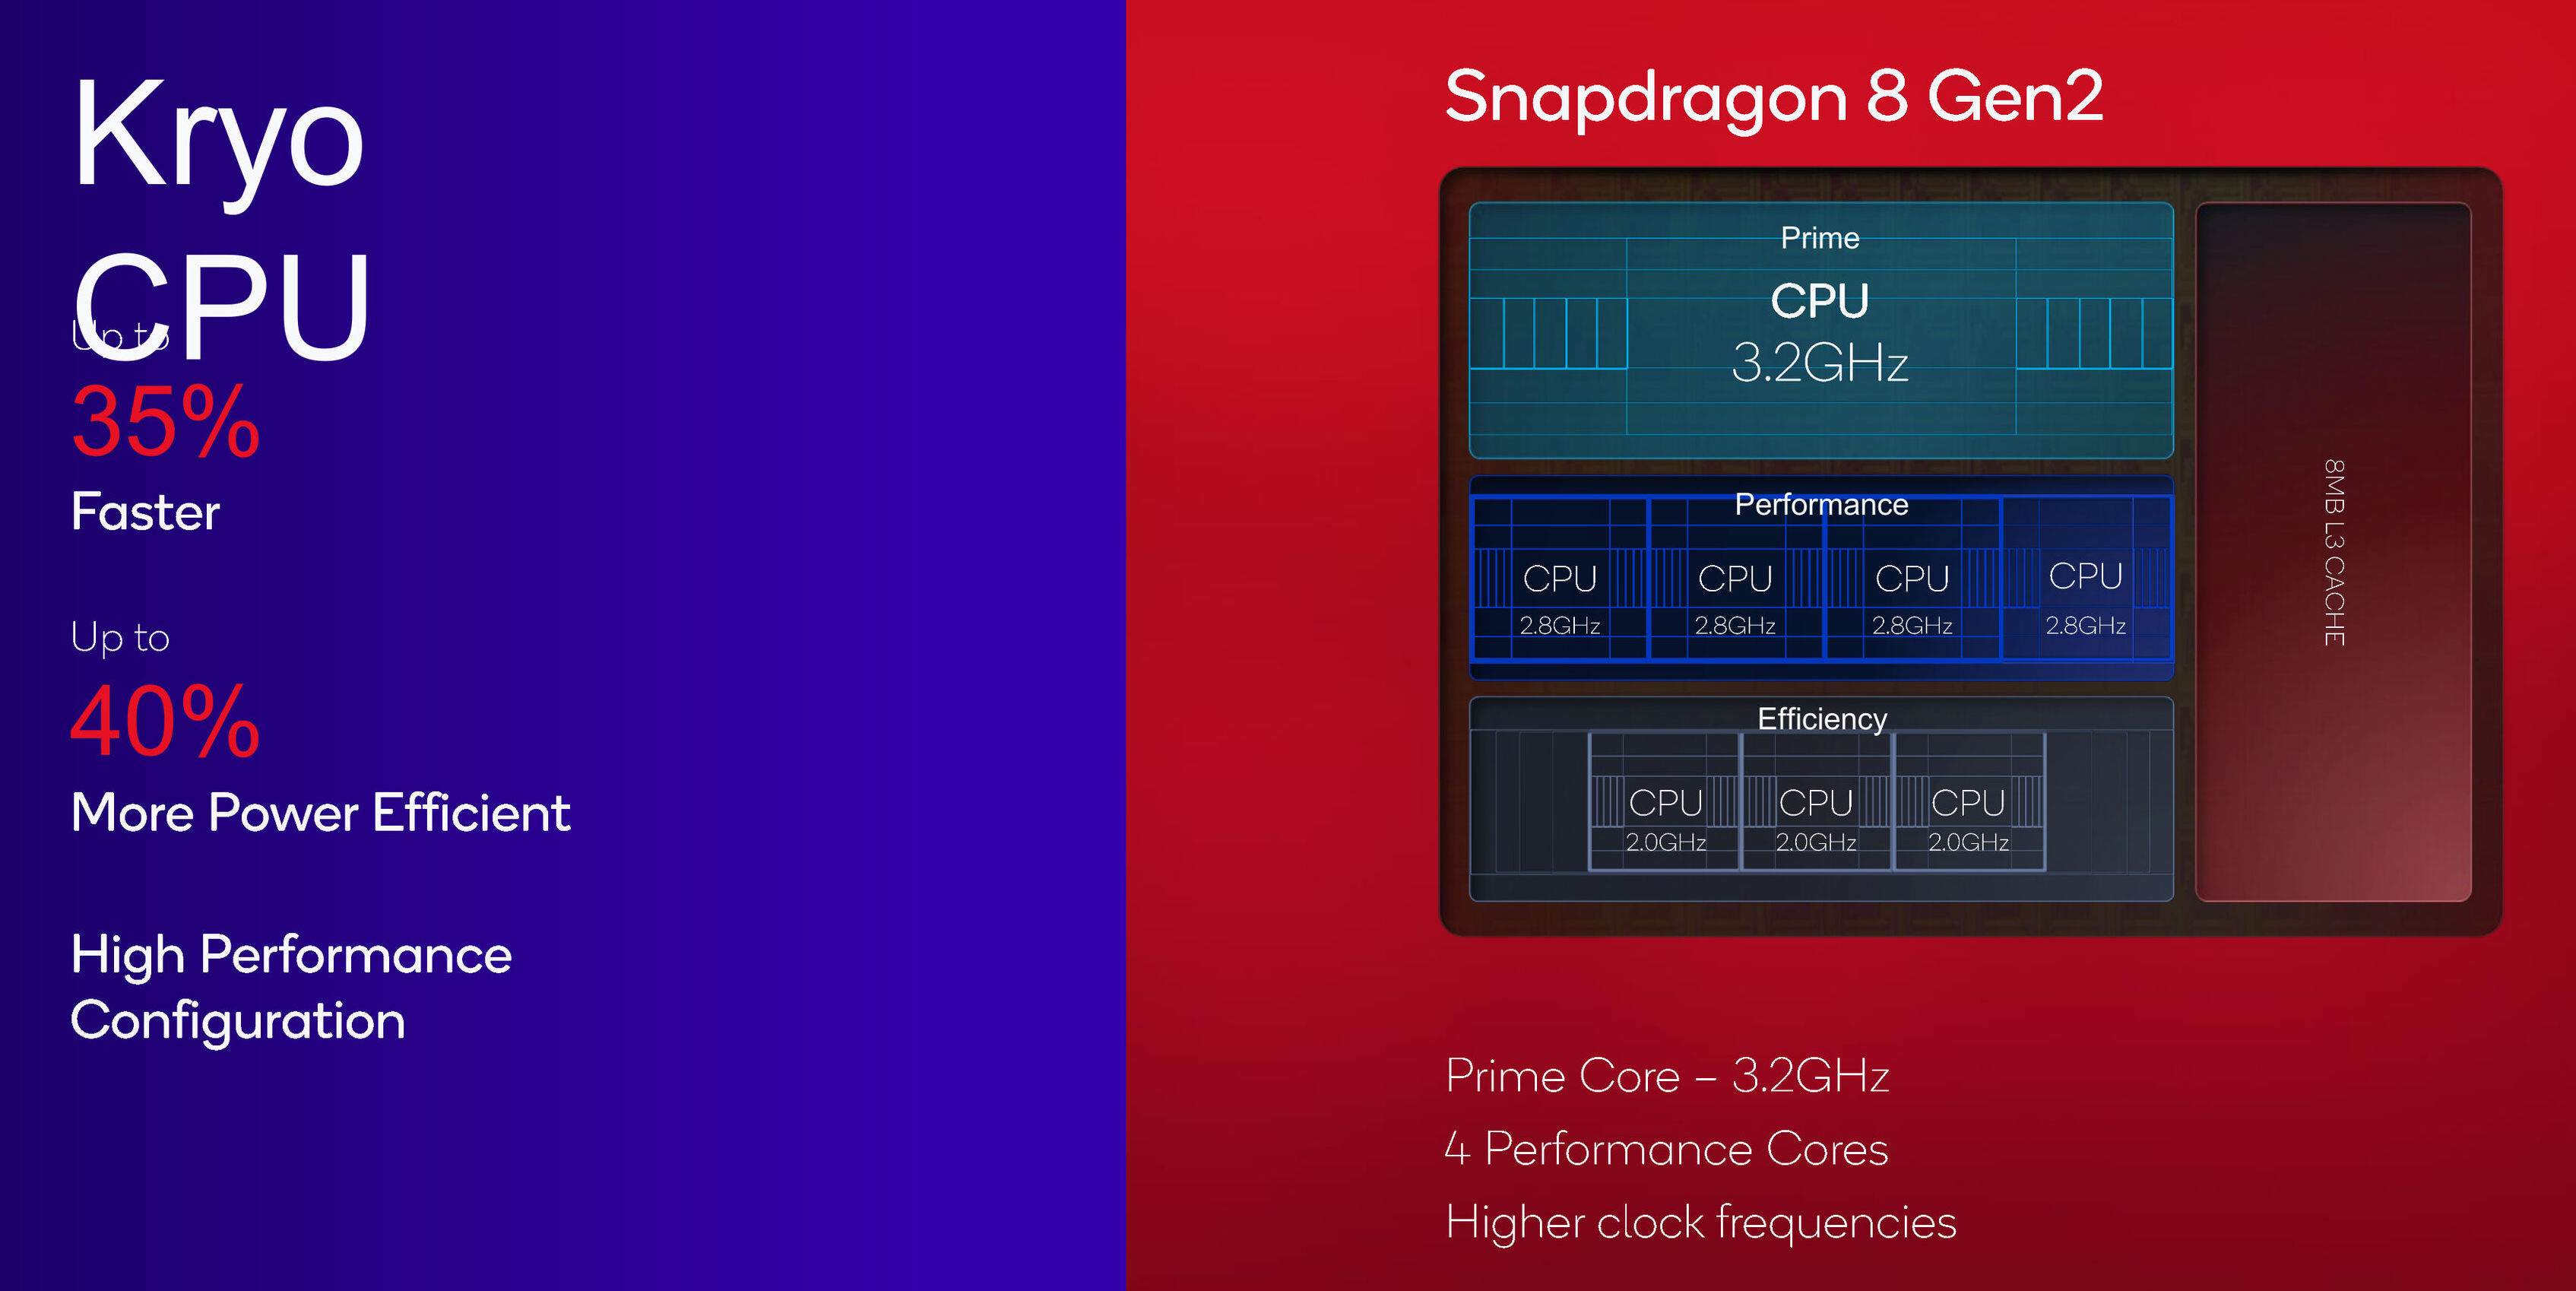
The Qualcomm Snapdragon 8 Gen 2 Mobile Platform is a high-end SoC for smartphones that was introduced in late 2022 and manufactured in 4 nm at TSMC (N4P). It integrates four different CPU clusters. A fast and big prime core based on the ARM Cortex-X3 architecture and clocked at up to 3.2 GHz for 64 bit applications. Two more ARM Cortex-A715 based performance cores clocked at up to 2.8 GHz (also only for 64 bit apps). Two more Cortex-A710 performance cores at up to 2.8 GHz that can also be used for older apps and three efficiency cores (ARM Cortex-A510 with up to 2 GHz). All cores can use the shared 8 MB level 3 cache.

Thanks to the new architecture and high clock rates, the SD 8 Gen 2 is the fastest mobile CPU for Android based devices and is only topped by current Apple SoCs like the Apple A16 (see benchmarks below).

The chip also integrates a Hexagon accelerator for AI workloads (tensor, scalar and vector). Qualcomm states that its one of the first chips with INT4 support and up to 4.35x performance compared to the previous generation. 

The 18-Bit-Spectra ISP is able to process photos with up to 200 MP and work with videos up to 8k30 (including 10-bit, HDR10+, HLG and Dolby Vision).

A big improvement of the Snapdragon 8 G2 is the integrated Adreno 740 GPU, that now supports Hardware Raytracing and tops even the iGPU in the Apple A16.

The integrated AI Engine can offer up to 4x faster AI performance thanks to the bigger Tensor engine. The 18-Bit-Spectra-ISP also saw some big improvements and is now called Snapdragon Sight.

The integrated Adreno 730 offers a 30% graphics boost compared to the previous Adreno 660.

The integrated Snapdragon X70 5G modem is also new as is the FastConnect 7800 modem with Wi-Fi 7 and Bluetooth 5.3 support.

ModelApple M1Qualcomm Snapdragon 8 Gen 2
SeriesApple Apple M-SeriesQualcomm Snapdragon
Series: Snapdragon Cortex-X3 / A715 / A710 / A510 (Kryo)
Apple M1 Max compare2.06 - 3.22 GHz10 / 10 cores48 MB L3
Apple M1 Pro compare2.06 - 3.22 GHz10 / 10 cores24 MB L3
Apple M1 Pro 8-Core compare2.06 - 3.22 GHz8 / 8 cores16 MB L3
Apple M1 « 2.06 - 3.22 GHz8 / 8 cores8 MB L3
Qualcomm Snapdragon 8 Gen 2 for Galaxy compare2 - 3.36 GHz8 / 8 cores8 MB L3
Qualcomm Snapdragon 8 Gen 2 « 2 - 3.2 GHz8 / 8 cores8 MB L3
Clock2064 - 3220 MHz2000 - 3200 MHz
L1 Cache2 MB
L2 Cache16 MB
L3 Cache8 MB8 MB
Cores / Threads8 / 88 / 8
1 x 3.2 GHz ARM Cortex-X3
2 x 2.8 GHz ARM Cortex-A715
2 x 2.8 GHz ARM Cortex-A710
3 x 2.0 GHz ARM Cortex-A510
Transistors16000 Million
Technology5 nm4 nm
FeaturesARMv8 Instruction SetAdreno GPU, Spectra ISP, Hexagon, X70 5G Modem, FastConnect 7800 Wi-Fi 7, LPDDR5x 4200 MHz Memory Controller
iGPUApple M1 8-Core GPUQualcomm Adreno 740
ArchitectureARMARM v9
Announced
CodenameCortex-X3 / A715 / A710 / A510 (Kryo)
Manufacturerwww.qualcomm.com

Benchmarks

Cinebench 2024 - CB24 CPU Single Core
100%
1 M1 +
110 Points (76%)
Cinebench 2024 - CB24 CPU Multi Core
100%
1 M1 +
444 Points (8%)
Cinebench R23 - Cinebench R23 Multi Core
100%
1 M1 +
min: 7409     avg: 7728     median: 7800.5 (7%)     max: 7830 Points
Cinebench R23 - Cinebench R23 Single Core
100%
1 M1 +
min: 1496     avg: 1512     median: 1514.5 (64%)     max: 1520 Points
Cinebench R20 - Cinebench R20 CPU (Single Core)
100%
1 M1 +
min: 401     avg: 403     median: 402.5 (45%)     max: 406 Points
Cinebench R20 - Cinebench R20 CPU (Multi Core)
100%
1 M1 +
min: 1863     avg: 2040     median: 2093.5 (5%)     max: 2109 Points
Cinebench R15 - Cinebench R15 CPU Multi 64 Bit
100%
1 M1 +
min: 1020     avg: 1063     median: 1072 (7%)     max: 1087 Points
Cinebench R15 - Cinebench R15 CPU Single 64 Bit
100%
1 M1 +
min: 206     avg: 207.3     median: 208 (63%)     max: 208 Points
7-Zip 18.03 - 7-Zip 18.03 Multli Thread 4 runs
100%
1 M1 +
34614 MIPS (20%)
7-Zip 18.03 - 7-Zip 18.03 Single Thread 4 runs
100%
1 M1 +
5441 MIPS (65%)
Blender - Blender 3.3 Classroom CPU *
100%
1 M1 +
964 Seconds (12%)
Blender - Blender 2.79 BMW27 CPU *
100%
1 M1 +
min: 412     avg: 561     median: 561 (4%)     max: 710 Seconds
R Benchmark 2.5 - R Benchmark 2.5 *
100%
1 M1 +
0.7 sec (16%)
3DMark - 3DMark Sling Shot Extreme (ES 3.1) Unlimited Physics
100%
M1 +
2711 Points (11%)
3DMark - 3DMark Sling Shot (ES 3.0) Unlimited Physics
100%
M1 +
min: 1956     avg: 3137     median: 3136.5 (36%)     max: 4317 Points
Geekbench 6.2 - Geekbench 6.2 Single-Core
100%
M1 +
2363 Points (72%)
min: 1534     avg: 1953     median: 2010 (61%)     max: 2104 Points
Geekbench 6.2 - Geekbench 6.2 Multi-Core
100%
M1 +
8622 Points (34%)
min: 4255     avg: 5220     median: 5311.5 (21%)     max: 5765 Points
Geekbench 5.5 - Geekbench 5.1 - 5.4 64 Bit Single-Core
100%
M1 +
min: 1710     avg: 1729     median: 1730 (73%)     max: 1745 Points
Geekbench 5.5 - Geekbench 5.1 - 5.4 64 Bit Multi-Core
100%
M1 +
min: 7034     avg: 7501     median: 7578 (14%)     max: 7710 Points
Geekbench 4.4 - Geekbench 4.1 - 4.4 64 Bit Single-Core
min: 7691     avg: 7987     median: 8130 (81%)     max: 8231 Points
Geekbench 4.4 - Geekbench 4.1 - 4.4 64 Bit Multi-Core
min: 19069     avg: 20636     median: 21122 (23%)     max: 21505 Points
Geekbench 3 - Geekbench 3 64 Bit Multi-Core
min: 18584     avg: 18885     median: 18884.5 (30%)     max: 19185 Points
Geekbench 3 - Geekbench 3 64 Bit Single-Core
min: 6449     avg: 6564     median: 6563.5 (98%)     max: 6678 Points
Mozilla Kraken 1.1 - Kraken 1.1 Total Score *
100%
M1 +
min: 418     avg: 473.8     median: 483 (1%)     max: 516 ms
min: 653.8     avg: 1035     median: 898.3 (1%)     max: 1837.3 ms
Sunspider - Sunspider 1.0 Total Score *
100%
1 M1 +
min: 65.2     avg: 75.9     median: 76.4 (1%)     max: 86.1 ms
Octane V2 - Octane V2 Total Score
100%
M1 +
min: 62055     avg: 63340     median: 62589.5 (56%)     max: 66974 Points
min: 19870     avg: 45018     median: 44542 (40%)     max: 65418 Points
WebXPRT 4 - WebXPRT 4 Score
100%
M1 +
189 Points (54%)
min: 28     avg: 127.3     median: 137.5 (40%)     max: 183 Points
WebXPRT 3 - WebXPRT 3 Score
100%
M1 +
min: 216     avg: 266.3     median: 280.5 (58%)     max: 304 Points
min: 115     avg: 199.8     median: 211 (44%)     max: 238 Points
AnTuTu v8 - AnTuTu v8 UX
100%
1 M1 +
min: 104389     avg: 105297     median: 105297 (88%)     max: 106205 Points
AnTuTu v8 - AnTuTu v8 MEM
100%
1 M1 +
min: 110874     avg: 111266     median: 111266 (90%)     max: 111658 Points
AnTuTu v8 - AnTuTu v8 GPU
100%
1 M1 +
min: 533978     avg: 539206     median: 539206 (99%)     max: 544434 Points
AnTuTu v8 - AnTuTu v8 CPU
100%
1 M1 +
min: 267169     avg: 271808     median: 271808 (98%)     max: 276446 Points
AnTuTu v8 - AnTuTu v8 Total Score
100%
1 M1 +
min: 1017190     avg: 1027580     median: 1027580 (99%)     max: 1037960 Points
Antutu v9 - AnTuTu v9 Total Score
100%
M1 +
min: 1040910     avg: 1113810     median: 1113810 (67%)     max: 1186710 Points
min: 1111520     avg: 1263750     median: 1276070 (77%)     max: 1322450 Points
Antutu v9 - AnTuTu v9 CPU
100%
M1 +
min: 244643     avg: 254253     median: 254252 (70%)     max: 263862 Points
PCMark for Android - PCM f. Android Storage 2.0 random write internal
min: 27.9     avg: 67.6     median: 66.7 (49%)     max: 119.5 MB/s
PCMark for Android - PCM f. Android Storage 2.0 seq write internal
min: 1636     avg: 2301     median: 2284 (71%)     max: 3009 MB/s
PCMark for Android - PCM f. Android Storage 2.0 random read internal
min: 23.2     avg: 44.6     median: 45.5 (56%)     max: 61.7 MB/s
PCMark for Android - PCM f. Android Storage 2.0 seq read internal
min: 2425     avg: 2693     median: 2675 (74%)     max: 2926.49 MB/s
PCMark for Android - PCM f. Android Storage 2.0 score
min: 30673     avg: 45258     median: 47516.5 (75%)     max: 54839 Points
CrossMark - CrossMark Overall
100%
M1 +
min: 1266     avg: 1301     median: 1283 (49%)     max: 1355 Points
Power Consumption - Cinebench R15 Multi Power Consumption - external Monitor *
100%
1 M1 +
27.2 Watt (5%)
Power Consumption - Geekbench 5.5 Power Consumption 150cd *
100%
1 M1 +
min: 8.23     avg: 8.7     median: 8.5 (4%)     max: 9.49 Watt
Power Consumption - Idle Power Consumption - external Monitor *
100%
1 M1 +
3 Watt (2%)
Power Consumption - Idle Power Consumption 150cd 1min *
100%
1 M1 +
min: 2.29     avg: 2.9     median: 3.1 (3%)     max: 3.22 Watt
Power Consumption - Cinebench R15 Multi Power Efficiency - external Monitor
100%
1 M1 +
37.5 Points per Watt (28%)

Average Benchmarks Apple M1 → 100% n=13

Average Benchmarks Qualcomm Snapdragon 8 Gen 2 → 106% n=13

- Range of benchmark values for this graphics card
- Average benchmark values for this graphics card
* Smaller numbers mean a higher performance
1 This benchmark is not used for the average calculation

Add one or more devices and compare

In the following list you can select (and also search for) devices that should be added to the comparison. You can select more than one device.

restrict list:

show all (including archived), 2024, 2023
v1.26
log 14. 09:35:20

#0 checking url part for id 12937 +0s ... 0s

#1 checking url part for id 14645 +0s ... 0s

#2 not redirecting to Ajax server +0s ... 0s

#3 did not recreate cache, as it is less than 5 days old! Created at Mon, 13 May 2024 05:39:12 +0200 +0.001s ... 0.001s

#4 composed specs +0.028s ... 0.029s

#5 did output specs +0s ... 0.029s

#6 getting avg benchmarks for device 12937 +0.003s ... 0.032s

#7 got single benchmarks 12937 +0.025s ... 0.056s

#8 getting avg benchmarks for device 14645 +0.003s ... 0.059s

#9 got single benchmarks 14645 +0.078s ... 0.137s

#10 got avg benchmarks for devices +0s ... 0.137s

#11 min, max, avg, median took s +0.168s ... 0.306s

#12 return log +0.027s ... 0.333s

Please share our article, every link counts!
> Expert Reviews and News on Laptops, Smartphones and Tech Innovations > Benchmarks / Tech > Processor Comparison - Head 2 Head
Redaktion, 2017-09- 8 (Update: 2023-07- 1)