Notebookcheck Logo

Samsung Exynos 8890 Octa vs Apple A9 vs Apple A9X

Samsung Exynos 8890 Octa

► remove from comparison

The Samsung Exynos 8890 Octa is a System on a Chip (SoC) for smartphones and tablets. It was announced late 2015 and first appeared in some Galaxy S7 devices in the beginning of 2016. It integrates four Samsung M1 cores where two are clocked at 2.6 GHz and all four cores under load at 2.3 GHz. Furthermore, four power saving ARM Cortex-A53 cores clocked at 1.6 GHz are present adding to a total of 8 cores. As a graphics card, Samsung integrated a ARM Mali-T880 MP12 (12 cluster version). The memory controller supports 2 x 32 Bit LPDDR4 with up to 1800 MHz.

The processor performance is on par with the Qualcomm Snapdragon 820 that can also be found in some variants of the Galaxy S7. The 820 is faster in single threaded tasks, the 8890 pulls ahead if it can use all 8 cores. Therfore, the 8890 is one of the fastest smartphones SoCs in 2016.

Apple A9

► remove from comparison Apple A9

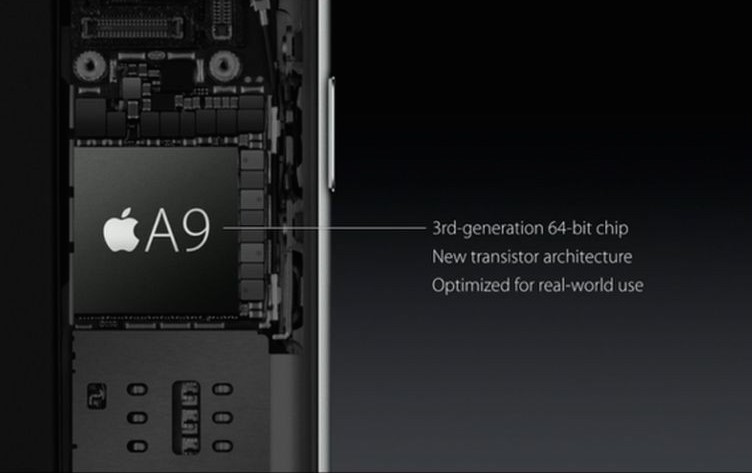
The Apple A9 is a high-end dual-core ARM SoC for smartphones. It was announced in Sept. 2015 in the new iPhone 6s and 6s Plus. Technical details were not published, but the CPU part should be about 70% and the GPU 90% faster than the previous Apple A8. Therefore, the performance should be on par with high-end Android SoCs in 2015.

It is based on the third generation of Apples 64 Bit architectures (Cyclone 3?) and uses a "new transistor technology". It is manufactured at Samsung in 14nm (slightly smaller die) and TSMC at 16nm (both FINFET 3D transistors). A performance difference of both versions are not noticable.

Furthermore, the chip now integrates the M9 motion coprocessor and a 4K video de- and encoder (as the iPhones 6s supports 4K video recording). The integrated graphics card should be still based on PowerVR technology.

The power consumption could be lower than the A8 due to the new process technology and the fact that the iPhones now got a smaller battery (due to the haptic engine part).

Apple A9X

► remove from comparison Apple A9X

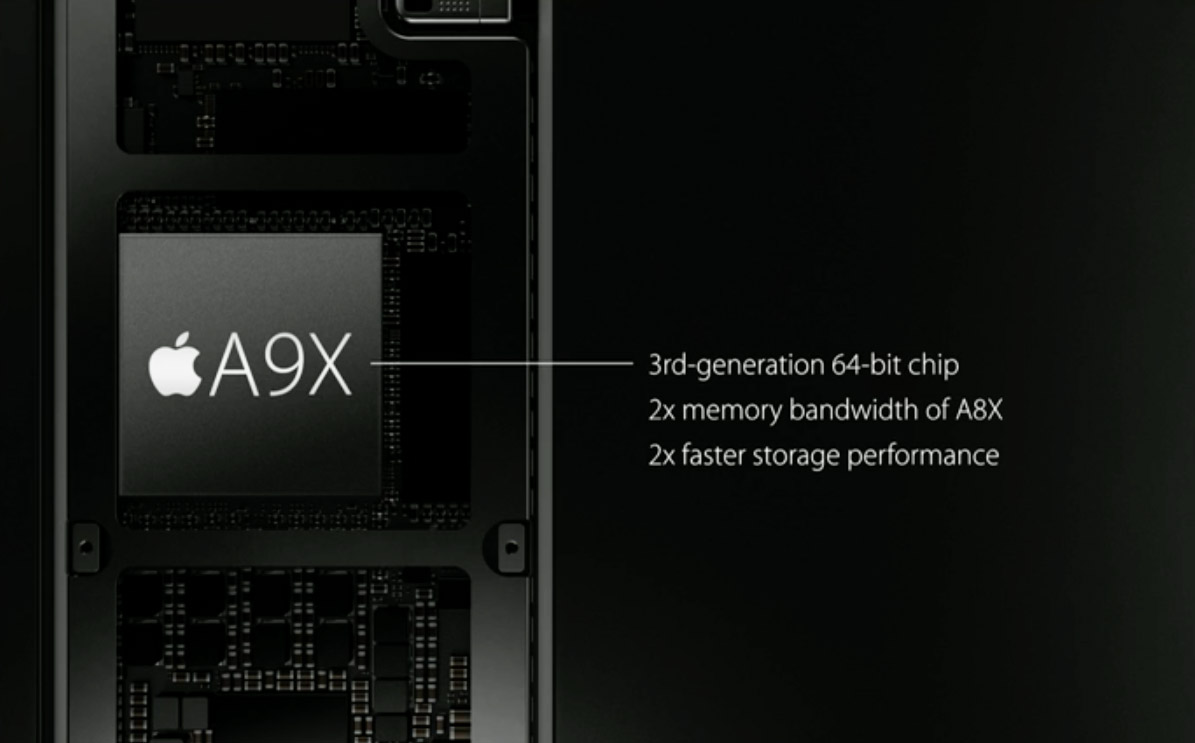
The Apple A9X is a high-end ARM SoC (System on a Chip) that was announced in September 2015 in the iPad Pro. Technical details are scarce, what we know is that it is based on the third generation of Apples 64 Bit architecture (Cyclone 3) and manufactured with a "new transistor technology" (14 or 16nm FINFet probably).

The performance of the A9X did improve a lot according to Apple. The CPU part should be 1.8x faster and the GPU part even 2x faster than the already speedy Apple A8X. Apple even stated in the keynote of the iPad Pro that the performance should be "faster than 80% of portable PCs shipped in the last 12 month". Furthermore the iPad Pro now features a 2x higher memory bandwidth (DDR4?) and 2x faster storage performance. The integrated graphics card will most likely be a PowerVR design again (Power VR Series7?).

ModelSamsung Exynos 8890 OctaApple A9Apple A9X
SeriesSamsung ExynosApple Apple
CodenameMongoose / Cortex-A53Cyclone 3Cyclone 3
Series: Cyclone 3
Samsung Exynos 8895 Octa2.3 GHz8 / 8 cores Mongoose / Cortex-A53
Samsung Exynos 8890 Octa « 2.6 GHz8 / 8 cores Mongoose / Cortex-A53
Apple A9X2.26 GHz2 / 2 cores Cyclone 3
Apple A9 « 1.8 GHz2 / 2 cores Cyclone 3
Apple A9X « 2.26 GHz2 / 2 cores Cyclone 3
Apple A91.8 GHz2 / 2 cores Cyclone 3
Clock2600 MHz1800 MHz2260 MHz
Cores / Threads8 / 82 / 22 / 2
Technology14 nm14/16 nm14/16 nm
FeaturesARM Mali-T880MP12 GPU (650 MHz), 4x Mongoose (2.3 / 2.6 GHz), 4x Cortex-A53 (1.6 GHz) big.LITTLE, 2x 32 Bit LPDDR4 1800 MHz Memory ControllerARMv8 Instruction SetARMv8 Instruction Set
iGPUARM Mali-T880 MP12 (650 - 650 MHz)Apple A9 / PowerVR GT7600Apple A9X / PowerVR Series 7XT
ArchitectureARMARMARM
Announced
Die Size147 mm2

Benchmarks

3DMark - 3DMark Ice Storm Unlimited Physics
min: 19610     avg: 19796     median: 19834 (17%)     max: 19944 Points
67%
A9 +
min: 12854     avg: 13248     median: 13210.5 (11%)     max: 13717 Points
79%
A9X +
min: 15473     avg: 15748     median: 15748 (13%)     max: 16023 Points
3DMark - 3DMark Sling Shot Extreme (ES 3.1) Unlimited Physics
min: 1578     avg: 1695     median: 1694.5 (20%)     max: 1811 Points
65%
A9 +
1094 Points (13%)
101%
A9X +
1713 Points (20%)
3DMark - 3DMark Sling Shot (ES 3.0) Unlimited Physics
min: 1773     avg: 1786     median: 1786 (20%)     max: 1799 Points
61%
A9 +
1093 Points (12%)
92%
A9X +
1649 Points (19%)
Geekbench 5.5 - Geekbench 5.1 - 5.4 64 Bit Single-Core
100%
1 A9 +
531 Points (22%)
Geekbench 5.5 - Geekbench 5.1 - 5.4 64 Bit Multi-Core
100%
1 A9 +
970 Points (2%)
Geekbench 4.4 - Geekbench 4.1 - 4.4 64 Bit Single-Core
1810 Points (18%)
141%
A9 +
2556 Points (26%)
171%
A9X +
3097 Points (31%)
Geekbench 4.4 - Geekbench 4.1 - 4.4 64 Bit Multi-Core
5354 Points (6%)
83%
A9 +
4459 Points (5%)
99%
A9X +
5284 Points (6%)
Geekbench 4.0 - Geekbench 4.0 64 Bit Single-Core
min: 1840     avg: 1853     median: 1852.5 (25%)     max: 1865 Points
136%
1 A9 +
min: 2503     avg: 2527     median: 2526.5 (34%)     max: 2550 Points
Geekbench 4.0 - Geekbench 4.0 64 Bit Multi-Core
min: 5213     avg: 5358     median: 5358 (13%)     max: 5503 Points
81%
1 A9 +
min: 4286     avg: 4359     median: 4359 (11%)     max: 4432 Points
Geekbench 3 - Geekbench 3 64 Bit Multi-Core
min: 5260     avg: 6135     median: 6400.5 (10%)     max: 6480 Points
69%
A9 +
min: 4386     avg: 4412     median: 4422 (7%)     max: 4429 Points
83%
A9X +
min: 5268     avg: 5344     median: 5343.5 (8%)     max: 5419 Points
Geekbench 3 - Geekbench 3 64 Bit Single-Core
min: 1645     avg: 2044     median: 2165 (32%)     max: 2199 Points
117%
A9 +
min: 2533     avg: 2537     median: 2538 (38%)     max: 2539 Points
145%
A9X +
min: 3079     avg: 3140     median: 3139.5 (47%)     max: 3200 Points
Linpack Android / IOS - Linpack Multi Thread
100%
1 A9 +
min: 1225     avg: 1260     median: 1260 (43%)     max: 1295 MFLOPS
124%
1 A9X +
min: 1550     avg: 1560     median: 1559.5 (53%)     max: 1569 MFLOPS
Linpack Android / IOS - Linpack Single Thread
100%
1 A9 +
min: 669     avg: 677     median: 677 (66%)     max: 685 MFLOPS
126%
1 A9X +
855 MFLOPS (84%)
Mozilla Kraken 1.1 - Kraken 1.1 Total Score *
min: 2562     avg: 2565     median: 2564 (3%)     max: 2569 ms
101%
A9 +
min: 1458     avg: 1656     median: 1712 (2%)     max: 1743 ms
101%
A9X +
min: 1499     avg: 1523     median: 1522.5 (2%)     max: 1546 ms
Sunspider - Sunspider 1.0 Total Score *
321 ms (4%)
101%
A9 +
223 ms (2%)
102%
A9X +
181 ms (2%)
Octane V2 - Octane V2 Total Score
min: 12579     avg: 12900     median: 12915.5 (12%)     max: 13191 Points
127%
A9 +
min: 15967     avg: 16716     median: 16375 (15%)     max: 18148 Points
153%
A9X +
min: 19621     avg: 19737     median: 19736.5 (18%)     max: 19852 Points
WebXPRT 3 - WebXPRT 3 Score
100%
1 A9X +
101 Points (21%)
Vellamo 3.x - Vellamo 3.x Metal
min: 3371     avg: 3397     median: 3396.5 (91%)     max: 3422 Points
Vellamo 3.x - Vellamo 3.x Multicore Beta
min: 3408     avg: 3430     median: 3430 (76%)     max: 3452 Points
Vellamo 3.x - Vellamo 3.x Browser
min: 7198     avg: 7384     median: 7384 (98%)     max: 7570 Points
AnTuTu v5 - AnTuTu v5 Total Score
80582 Points (81%)
73%
1 A9 +
min: 58869     avg: 58977     median: 58976.5 (59%)     max: 59084 Points
AnTuTu v6 - AnTuTu v6 Total Score
min: 127902     avg: 130165     median: 128749 (44%)     max: 133845 Points
100%
A9 +
min: 126969     avg: 129767     median: 128706 (44%)     max: 133626 Points
137%
A9X +
min: 168840     avg: 176593     median: 176593 (60%)     max: 184346 Points
AnTuTu v7 - AnTuTu v7 MEM
100%
1 A9X +
7954 Points (24%)
AnTuTu v7 - AnTuTu v7 UX
100%
1 A9X +
38538 Points (47%)
AnTuTu v7 - AnTuTu v7 GPU
100%
1 A9X +
89250 Points (28%)
AnTuTu v7 - AnTuTu v7 CPU
100%
1 A9X +
81273 Points (50%)
AnTuTu v7 - AnTuTu v7 Total Score
100%
1 A9X +
217015 Points (38%)
PassMark PerformanceTest Mobile V1 - PerformanceTest Mobile V1 CPU Tests
min: 205706     avg: 212850     median: 207417 (27%)     max: 225427 Points
24%
A9 +
min: 46285     avg: 48479     median: 48849 (6%)     max: 49934 Points
29%
A9X +
min: 58793     avg: 59226     median: 59226 (8%)     max: 59659 Points
PCMark for Android - PCM f. Android Work 2.0 Battery Life
371 min (7%)
PCMark for Android - PCM f. Android Work Score 2.0
3550 Points (23%)
PCMark for Android - PCM f. Android Work Score
min: 4660     avg: 4867     median: 4826 (24%)     max: 5115 Points

Average Benchmarks Samsung Exynos 8890 Octa → 100% n=12

Average Benchmarks Apple A9 → 88% n=12

Average Benchmarks Apple A9X → 108% n=12

- Range of benchmark values for this graphics card
- Average benchmark values for this graphics card
* Smaller numbers mean a higher performance
1 This benchmark is not used for the average calculation

v1.27
log 07. 05:02:50

#0 checking url part for id 8020 +0s ... 0s

#1 checking url part for id 7085 +0s ... 0s

#2 checking url part for id 7087 +0s ... 0s

#3 not redirecting to Ajax server +0s ... 0s

#4 did not recreate cache, as it is less than 5 days old! Created at Tue, 04 Jun 2024 05:34:21 +0200 +0.001s ... 0.001s

#5 composed specs +0.109s ... 0.111s

#6 did output specs +0s ... 0.111s

#7 getting avg benchmarks for device 8020 +0.004s ... 0.115s

#8 got single benchmarks 8020 +0.014s ... 0.129s

#9 getting avg benchmarks for device 7085 +0.004s ... 0.132s

#10 got single benchmarks 7085 +0.013s ... 0.145s

#11 getting avg benchmarks for device 7087 +0.004s ... 0.149s

#12 got single benchmarks 7087 +0.013s ... 0.162s

#13 got avg benchmarks for devices +0s ... 0.162s

#14 min, max, avg, median took s +0.239s ... 0.401s

#15 return log +0s ... 0.401s

Please share our article, every link counts!
> Expert Reviews and News on Laptops, Smartphones and Tech Innovations > Benchmarks / Tech > Processor Comparison - Head 2 Head
Redaktion, 2017-09- 8 (Update: 2023-07- 1)