Notebookcheck Logo

Qualcomm Adreno 530 vs PowerVR GX6450

Qualcomm Adreno 530

► remove from comparison Qualcomm Adreno 530

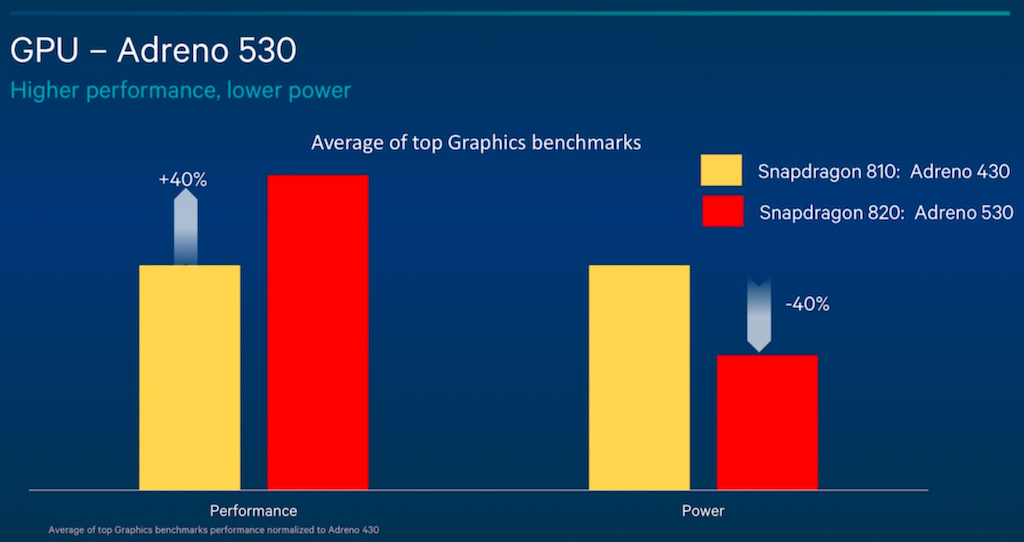
The Qualcomm Adreno 530 is an integrated graphics card for (mostly Android based) smartphones and tablets. It was introduced in the last quarter of 2015 and is integrated in the Qualcomm Snapdragon 820 SoC. It supports OpenGL ES 3.1 and DirectX 11.1.

The GPU uses a still unknown amount of unified shaders clocked at up to 624 MHz. In 2015 it belongs to the fastest GPU for smartphones. Compared to the predecessor Adreno 430, the 530 is especially faster in demanding benchmarks.

PowerVR GX6450

► remove from comparison Imagination PowerVR GX6450

The Imagination Technologies PowerVR GX6450 is a fast mobile graphics solution for smartphones and tablets, which can be found in ARM SoCs such as the Apple A8 (iPhone 6 and iPhone 6 Plus). The chip is available since Q3/2014 and of one of the fastest solutions in its class at the time of introduction.

Architecture and Performance

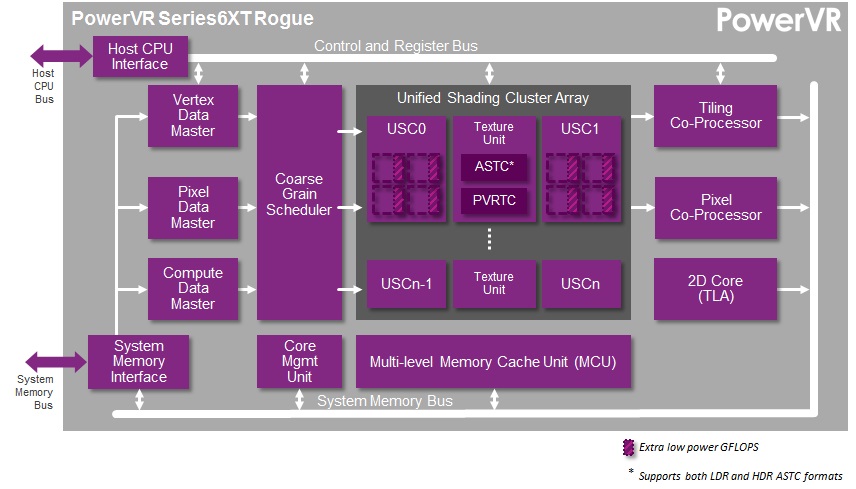
The GPU is based on the PowerVR Series 6XT (Rogue) Unified Shader architecture and integrates four clusters with two TMUs and 32 FP32-ALUs each. Therefore, the theoretical FP32 (full precision) compute performance per clock is identical to the previous G6430 (also 4 clusters) found in the Apple A7. Thanks to additional dedicated FP16-ALUs, however, the also important FP16 (half precision) performance has been greatly improved.

In the iPhone 6, the GPU should be clocked at around 450 MHz, delivering about 115 GLOPS (FP32). Compared to other mobile graphics solutions, the GX6450 outperforms the Qualcomm Adreno 330 (Snapdragon 800/801) and matches the more recent Adreno 420 (Snapdragon 805). Except for Nvidia's power hungry tablet chip Tegra K1 and its bigger cousin GX6650, the GX6450 is one of the fastest mobile GPUs in late 2014. Even the most advanced games and high resolution displays are handled without any problems. Among others, the GPU supports OpenGL 3.x/4.x, OpenGL ES 3.0 as well as DirectX 10.

Power Consumption

Thanks to the advanced 20-nanometer process and the relatively low clock rate, the GX6450 implementation in Apple's A8 offers a very high energy efficiency. On the other hand, the GPU has a comparatively "wide" architecture requirering a lot of transistors and die size (19 mm² in 20 nm).

Qualcomm Adreno 530PowerVR GX6450
PowerVR Series 6XT (Rogue) Series
Adreno 540 compare @ 0.71 GHz
Adreno 530 @ 0.62 GHz
Adreno 512 compare
Adreno 510 compare
Adreno 509 compare
Adreno 508 compare @ 0.65 GHz
Adreno 506 compare @ 0.65 GHz
Adreno 505 compare @ 0.45 GHz
Adreno 504 compare @ 0.45 GHz
PowerVR GXA6850 compare 256 @ 0.45 GHz128 Bit
PowerVR GX6450 128 @ 0.45 GHz64 Bit
PowerVR GX6250 compare 64 @ 0.7 GHz64 Bit
Core Speed624 MHz450 (?) MHz
Shared Memoryyesno
APIDirectX 11.1, OpenGL ES 3.1 AEPDirectX 10, OpenGL 3.x, 4.x, OpenGL ES 3.0
technology14 nm20 nm
FeaturesOpenGL ES 3.1 AEP, OpenCL 2.0, Direct3D 11.1 (FL 11_1)OpenGL 3.x, 4.x, OpenGL ES 3.0
Date of Announcement15.12.2015 09.09.2014
CodenameRogue
ArchitecturePowerVR Rogue
Pipelines128 - unified
Memory Bus Width64 Bit
Link to Manufacturer Pagewww.imgtec.com
CPU in Adreno 530GPU Base SpeedGPU Boost / Turbo
Qualcomm Snapdragon 821 MSM8996 Pro4 x 2400 MHz? MHz653 MHz
Qualcomm Snapdragon 820 MSM89964 x 2200 MHz? MHz624 MHz
min. - max.? MHz624 - 653 MHz
CPU in PowerVR GX6450GPU Base SpeedGPU Boost / Turbo
Apple A82 x 1400 MHz? MHz? MHz

Benchmarks

3DMark - 3DMark Ice Storm Unlimited Graphics
min: 24310     avg: 32869     median: 32997 (4%)     max: 40761 Points
min: 22509     avg: 23756     median: 23937 (3%)     max: 25254 Points
3DMark - 3DMark Ice Storm Extreme Graphics
0 Points (0%)
3DMark - 3DMark Ice Storm Graphics
0 Points (0%)
3DMark - 3DMark Sling Shot (ES 3.0) Unlimited Graphics
min: 3401     avg: 4503     median: 4661.5 (10%)     max: 5006 Points
3DMark - 3DMark Sling Shot Extreme (ES 3.1) Unlimited Graphics
min: 2488     avg: 2996     median: 3108 (9%)     max: 3253 Points
GFXBench - GFXBench 5.0 Aztec Ruins High Tier Offscreen
min: 7.1     avg: 8.4     median: 7.2 (1%)     max: 11 fps
GFXBench - GFXBench 5.0 Aztec Ruins Normal Tier Offscreen
min: 15     avg: 17.7     median: 19 (1%)     max: 19 fps
6.6 fps (0%)
min: 17.8     avg: 19.1     median: 18.5 (1%)     max: 21.5 fps
GFXBench (DX / GLBenchmark) 2.7
GFXBench T-Rex HD Offscreen C24Z16 + Qualcomm Adreno 530
GFXBench T-Rex HD Offscreen C24Z16 + PowerVR GX6450
min: 42.6     avg: 44.6     median: 44.8 (0%)     max: 47.8 fps
Basemark X 1.1 - Basemark X 1.1 High Quality
min: 21420     avg: 30602     median: 33028 (75%)     max: 35449 Points
min: 15572     avg: 16055     median: 16055 (36%)     max: 16538 Points
Basemark X 1.1 - Basemark X 1.1 Medium Quality
min: 28538     avg: 37215     median: 38353 (85%)     max: 41500 Points
PassMark PerformanceTest Mobile V1 - PerformanceTest Mobile V1 2D Graphics Tests
min: 4781     avg: 5512     median: 5612.5 (6%)     max: 6042 Points
min: 2320     avg: 2579     median: 2609 (3%)     max: 2809 Points
PassMark PerformanceTest Mobile V1 - PerformanceTest Mobile V1 3D Graphics Tests
min: 1913     avg: 2183     median: 2178.5 (4%)     max: 2461 Points
min: 1060     avg: 1679     median: 1984 (3%)     max: 1992 Points
Smartbench 2012 - Smartbench 2012 Gaming Index
4410 Points (96%)

Average Benchmarks Qualcomm Adreno 530 → 100% n=7

Average Benchmarks PowerVR GX6450 → 55% n=7

- Range of benchmark values for this graphics card
- Average benchmark values for this graphics card
* Smaller numbers mean a higher performance
1 This benchmark is not used for the average calculation

Game Benchmarks

The following benchmarks stem from our benchmarks of review laptops. The performance depends on the used graphics memory, clock rate, processor, system settings, drivers, and operating systems. So the results don't have to be representative for all laptops with this GPU. For detailed information on the benchmark results, click on the fps number.

League of Legends: Wild Rift

League of Legends: Wild Rift

2020
low
PowerVR GX6450:
59  fps
Dead Trigger 2

Dead Trigger 2

2013
high
100%
Adreno 530:
0 (!) 30 30 30 30 56 58 59 59 60 60 ~ 43 fps
Asphalt 8: Airborne

Asphalt 8: Airborne

2013
low
100%
Adreno 530:
29 29 30 30 30 30 30 30 30 30 30 ~ 30 fps
high
100%
Adreno 530:
0 (!) 29 29 29 30 30 30 30 30 30 30 30 30 48 ~ 29 fps
Real Racing 3

Real Racing 3

2013
low
100%
Adreno 530:
60  fps
high
100%
Adreno 530:
35 51 ~ 43 fps

Average Gaming Qualcomm Adreno 530 → 100%

Average Gaming 30-70 fps → 100%

PowerVR GX6450lowmed.highultraQHD4K
League of Legends: Wild Rift59
< 30 fps
< 60 fps
< 120 fps
≥ 120 fps

1


Qualcomm Adreno 530lowmed.highultraQHD4K
Dead Trigger 243
Asphalt 8: Airborne3029
Real Racing 36043
< 30 fps
< 60 fps
< 120 fps
≥ 120 fps

1
1


1
2


For more games that might be playable and a list of all games and graphics cards visit our Gaming List

Add one or more devices and compare

In the following list you can select (and also search for) devices that should be added to the comparison. You can select more than one device.

restrict list:

show all (including archived), 2024, 2023
v1.27
log 17. 08:04:36

#0 checking url part for id 7062 +0s ... 0s

#1 checking url part for id 5960 +0s ... 0s

#2 not redirecting to Ajax server +0s ... 0s

#3 did not recreate cache, as it is less than 5 days old! Created at Sun, 16 Jun 2024 05:38:48 +0200 +0.001s ... 0.001s

#4 composed specs +0.149s ... 0.15s

#5 did output specs +0s ... 0.15s

#6 start showIntegratedCPUs +0s ... 0.15s

#7 getting avg benchmarks for device 7062 +0.025s ... 0.176s

#8 got single benchmarks 7062 +0.052s ... 0.228s

#9 getting avg benchmarks for device 5960 +0.002s ... 0.23s

#10 got single benchmarks 5960 +0.009s ... 0.238s

#11 got avg benchmarks for devices +0s ... 0.238s

#12 No cached benchmark found, getting uncached values +0.021s ... 0.26s

#13 No cached benchmark found, getting uncached values +0.005s ... 0.265s

#14 min, max, avg, median took s +0.058s ... 0.322s

#15 before gaming benchmark output +0s ... 0.322s

#16 Got 42 rows for game benchmarks. +0.015s ... 0.337s

#17 composed SQL query for gamebenchmarks +0s ... 0.337s

#18 got data and put it in $dataArray +0.002s ... 0.339s

#19 benchmarks composed for output. +0.01s ... 0.349s

#20 calculated avg scores. +0s ... 0.349s

#21 return log +0.046s ... 0.395s

Please share our article, every link counts!
> Expert Reviews and News on Laptops, Smartphones and Tech Innovations > Benchmarks / Tech > Graphics Card Comparison - Head 2 Head
Redaktion, 2017-09- 8 (Update: 2023-07- 1)