Notebookcheck Logo

Qualcomm Snapdragon 710 vs HiSilicon Kirin 710

Qualcomm Snapdragon 710

► remove from comparison Qualcomm SD 710

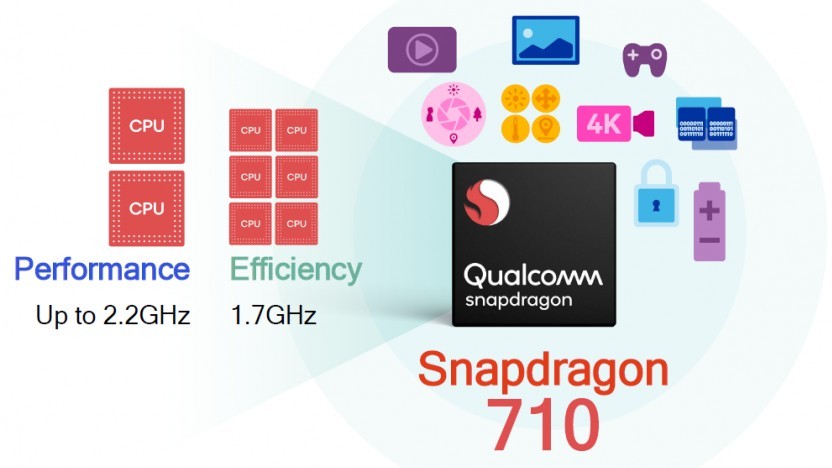
The Qualcomm Snapdragon 710 (SD710) is a fast mid-range ARM-based SoC largely found on Android tablets and smartphones. Announced in early 2018, the SD710 is the first of the 700 series and positions itself between the 600 series (e.g. Snapdragon 660) and 800 series (e.g. Snapdragon 845). It integrates 8 Kryo 360 cores devided in two big cores (most likely based on Cortex-A75 at up to 2.2 GHz) and six small cores (most likely based on Coretx-A55 at up to 1.7 GHz). The memory controller supports LPDDR4X and the integrated graphics card is called Adreno 616. The X15 LTE modem supports 4x4 MIMO with up to 800 MBbit/s download and 150 MBit/s upload.

Compared to the older Snapdragon 660, Qualcomm advertises the CPU clusters to be up to 20% faster and the GPU up to 35 %.

The Snapdragon 710 is manufactured in the modern 10 nm process at Samsung (10LPP).

HiSilicon Kirin 710

► remove from comparison HiSilicon Kirin 710

The HiSilicon Kirin 710 is a ARM-based mid-range Octa-Core-SoC for Android based smartphones and tablets. It was announced mid 2018 and contains 8 processor cores (4x Cortex-A73 at up to 2.2 GHz, 4x Cortex-A53 at up to 1.7 GHz, BigLITTLE), an ARM Mali G51 MP4, a dual-channel LPDDR4 memory controller and a LTE radio (600 Mbps down, 150 Mbps up). Therefore, the CPU part is similar to the Kirin 960 and 970 (both higher clocked), but the graphics card is a lot slower. 

The Kirin 710 is manufactured at TSMC in 12 nm (compared to the 16nm Kirin 960 and 10nm Kirin 970).

The HiSilicon Kirin 710F is the same chip with a different package (FCCSP - Flip Chip Chip Scale Package) and offers the same specifications (see e.g. our review of the Huawei P Smart Z).

ModelQualcomm Snapdragon 710HiSilicon Kirin 710
SeriesQualcomm SnapdragonHiSilicon
CodenameKryo 360Cortex-A73/-A53
Series: Cortex-A73/-A53
Qualcomm Snapdragon 712 compare2.3 GHz8 / 8 cores Kryo 360
Qualcomm Snapdragon 710 « 2.2 GHz8 / 8 cores Kryo 360
HiSilicon Kirin 970 compare2.4 GHz8 / 8 cores Cortex-A73/-A53
HiSilicon Kirin 960 compare2.4 GHz8 / 8 cores Cortex-A73/-A53
HiSilicon Kirin 960s compare2.1 GHz8 / 8 cores Cortex-A73/-A53
HiSilicon Kirin 710 « 2.2 GHz8 / 8 cores Cortex-A73/-A53
HiSilicon Kirin 710A compare2 GHz8 / 8 cores Cortex-A73/-A53
Clock2200 MHz2200 MHz
Cores / Threads8 / 88 / 8
Technology10 nm12 nm
FeaturesAdreno 612 GPU, X15 LTE Modem, Hexagon 685 DSP, Specra 250 ISP, GPS, GLONASS, SBAS, Beidou, GalileoARM Mali-G51 MP4 GPU, 4x Cortex-A73 (2.2 GHz) + 4x Cortex-A53 (1.7 GHz, big.LITTLE), LTE Cat-12 600 Mbps Downlink, Cat-13 150 Mbps Uplink, Bluetooth 4.2, WiFi a/b/g/n 2.4 GHz, AGPS, Glonass, Baidou
iGPUQualcomm Adreno 616ARM Mali-G51 MP4
ArchitectureARMARM
Announced
Manufacturerwww.qualcomm.com
Transistors5500 Million

Benchmarks

Performance Rating - Geekbench 5.5, PCM Work, Sling Shot Physics, Antutu v8 CPU - SD 710
0.5 pt (41%)
Performance Rating - Geekbench 5.5, PCM Work, Sling Shot Physics, Antutu v8 CPU - Kirin 710
0.5 pt (37%)
3DMark - 3DMark Ice Storm Unlimited Physics
min: 13595     avg: 14925     median: 14595.5 (12%)     max: 18181 Points
3DMark - 3DMark Sling Shot Extreme (ES 3.1) Unlimited Physics
min: 1840     avg: 2330     median: 2477 (29%)     max: 2720 Points
3DMark - 3DMark Sling Shot (ES 3.0) Unlimited Physics
min: 1862     avg: 2362     median: 2481.5 (28%)     max: 2634 Points
Geekbench 5.5 - Geekbench 5.1 - 5.4 64 Bit Single-Core
min: 392     avg: 393     median: 393 (17%)     max: 394 Points
min: 330     avg: 330.5     median: 330.5 (14%)     max: 331 Points
Geekbench 5.5 - Geekbench 5.1 - 5.4 64 Bit Multi-Core
min: 1448     avg: 1478     median: 1478 (3%)     max: 1508 Points
min: 1320     avg: 1338     median: 1338 (2%)     max: 1356 Points
Geekbench 5.0 - Geekbench 5.0 64 Bit Single-Core
394 Points (2%)
min: 319     avg: 327     median: 327 (1%)     max: 335 Points
Geekbench 5.0 - Geekbench 5.0 64 Bit Multi-Core
1515 Points (5%)
min: 1266     avg: 1339     median: 1339 (4%)     max: 1412 Points
Geekbench 4.4 - Geekbench 4.1 - 4.4 64 Bit Single-Core
min: 1799     avg: 1819     median: 1821 (18%)     max: 1833 Points
Geekbench 4.4 - Geekbench 4.1 - 4.4 64 Bit Multi-Core
min: 5754     avg: 5843     median: 5850.5 (7%)     max: 5917 Points
Geekbench 4.0 - Geekbench 4.0 64 Bit Single-Core
min: 1835     avg: 1858     median: 1858 (25%)     max: 1881 Points
min: 1612     avg: 1623     median: 1623 (22%)     max: 1634 Points
Geekbench 4.0 - Geekbench 4.0 64 Bit Multi-Core
min: 5683     avg: 5800     median: 5799.5 (14%)     max: 5916 Points
min: 5377     avg: 5447     median: 5447 (13%)     max: 5517 Points
Geekbench 3 - Geekbench 3 32 Bit Multi-Core
100%
1 SD 710 +
5589 Points (10%)
Geekbench 3 - Geekbench 3 32 Bit Single-Core
1863 Points (36%)
0 Points (0%)
Geekbench 3 - Geekbench 3 64 Bit Multi-Core
5600 Points (9%)
5456 Points (9%)
Geekbench 3 - Geekbench 3 64 Bit Single-Core
1769 Points (26%)
1517 Points (23%)
Geekbench 2 - 32 Bit - Geekbench Stream
min: 787     avg: 1443     median: 1443 (12%)     max: 2099 Points
min: 1356     avg: 1702     median: 1701.5 (14%)     max: 2047 Points
Geekbench 2 - 32 Bit - Geekbench Memory
min: 2565     avg: 2600     median: 2599.5 (24%)     max: 2634 Points
min: 2488     avg: 3017     median: 3017 (27%)     max: 3546 Points
Geekbench 2 - 32 Bit - Geekbench Floating Point
min: 11443     avg: 11547     median: 11546.5 (23%)     max: 11650 Points
min: 9096     avg: 9764     median: 9763.5 (19%)     max: 10431 Points
Geekbench 2 - 32 Bit - Geekbench Integer
min: 5224     avg: 5235     median: 5234.5 (11%)     max: 5245 Points
min: 4429     avg: 4767     median: 4766.5 (10%)     max: 5104 Points
Geekbench 2 - 32 Bit - Geekbench Total Score
min: 6446     avg: 6539     median: 6539 (17%)     max: 6632 Points
min: 5366     avg: 5857     median: 5856.5 (15%)     max: 6347 Points
Mozilla Kraken 1.1 - Kraken 1.1 Total Score *
min: 3035     avg: 3370     median: 3367.5 (4%)     max: 3800 ms
Octane V2 - Octane V2 Total Score
min: 9771     avg: 11817     median: 12364.5 (11%)     max: 12802 Points
min: 9041     avg: 9659     median: 9695 (9%)     max: 10544 Points
WebXPRT 3 - WebXPRT 3 Score
min: 57     avg: 66.2     median: 69.5 (14%)     max: 72 Points
AnTuTu v6 - AnTuTu v6 Total Score
min: 135848     avg: 136892     median: 137134 (47%)     max: 137693 Points
AnTuTu v7 - AnTuTu v7 MEM
min: 3343     avg: 6694     median: 7636 (23%)     max: 8159 Points
AnTuTu v7 - AnTuTu v7 UX
min: 43917     avg: 44744     median: 44198 (54%)     max: 46663 Points
AnTuTu v7 - AnTuTu v7 GPU
min: 37446     avg: 45655     median: 47945 (15%)     max: 49284 Points
AnTuTu v7 - AnTuTu v7 CPU
min: 63606     avg: 65473     median: 65728.5 (40%)     max: 66830 Points
AnTuTu v7 - AnTuTu v7 Total Score
min: 155113     avg: 162553     median: 162918 (29%)     max: 169262 Points
AnTuTu v8 - AnTuTu v8 UX
min: 7553     avg: 26433     median: 26433 (22%)     max: 45313 Points
min: 55985     avg: 58317     median: 58317 (49%)     max: 60649 Points
AnTuTu v8 - AnTuTu v8 MEM
min: 36796     avg: 41477     median: 41477 (33%)     max: 46158 Points
min: 35479     avg: 36250     median: 36250 (29%)     max: 37021 Points
AnTuTu v8 - AnTuTu v8 GPU
min: 49409     avg: 52655     median: 52655 (10%)     max: 55901 Points
min: 28697     avg: 28859     median: 28858.5 (5%)     max: 29020 Points
AnTuTu v8 - AnTuTu v8 CPU
min: 67712     avg: 68330     median: 68330 (25%)     max: 68948 Points
min: 60900     avg: 66675     median: 66674.5 (24%)     max: 72449 Points
AnTuTu v8 - AnTuTu v8 Total Score
min: 172068     avg: 188895     median: 188895 (18%)     max: 205722 Points
min: 185725     avg: 190100     median: 190100 (18%)     max: 194475 Points
PassMark PerformanceTest Mobile V1 - PerformanceTest Mobile V1 CPU Tests
min: 178496     avg: 180262     median: 180127 (24%)     max: 182163 Points
min: 181152     avg: 184162     median: 184162 (24%)     max: 187172 Points
PCMark for Android - PCM f. Android Work 2.0 Battery Life
100%
1 SD 710 +
min: 368     avg: 554     median: 553.5 (11%)     max: 739 min
PCMark for Android - PCM f. Android Computer Vision
min: 3402     avg: 3476     median: 3491 (18%)     max: 3518 Points
min: 3783     avg: 4945     median: 5171.5 (27%)     max: 5286 Points
PCMark for Android - PCM f. Android Storage
min: 4719     avg: 4933     median: 4820.5 (10%)     max: 5372 Points
min: 10592     avg: 11047     median: 11046.5 (24%)     max: 11501 Points
PCMark for Android - PCM f. Android Work Score 2.0
min: 6453     avg: 6824     median: 6762.5 (44%)     max: 7460 Points
PCMark for Android - PCM f. Android Work Score
min: 7041     avg: 8137     median: 8201 (41%)     max: 9345 Points

Average Benchmarks Qualcomm Snapdragon 710 → 100% n=38

Average Benchmarks HiSilicon Kirin 710 → 99% n=38

- Range of benchmark values for this graphics card
- Average benchmark values for this graphics card
* Smaller numbers mean a higher performance
1 This benchmark is not used for the average calculation

Add one or more devices and compare

In the following list you can select (and also search for) devices that should be added to the comparison. You can select more than one device.

restrict list:

show all (including archived), 2024, 2023
v1.26
log 25. 16:48:23

#0 checking url part for id 10981 +0s ... 0s

#1 checking url part for id 10172 +0s ... 0s

#2 not redirecting to Ajax server +0s ... 0s

#3 did not recreate cache, as it is less than 5 days old! Created at Thu, 25 Apr 2024 05:38:32 +0200 +0.001s ... 0.001s

#4 composed specs +0.055s ... 0.056s

#5 did output specs +0s ... 0.056s

#6 getting avg benchmarks for device 10981 +0.018s ... 0.074s

#7 got single benchmarks 10981 +0.032s ... 0.107s

#8 getting avg benchmarks for device 10172 +0.012s ... 0.118s

#9 got single benchmarks 10172 +0.043s ... 0.162s

#10 got avg benchmarks for devices +0s ... 0.162s

#11 No cached benchmark found, getting uncached values +0.102s ... 0.263s

#12 min, max, avg, median took s +0.116s ... 0.38s

#13 return log +0.033s ... 0.413s

Please share our article, every link counts!
> Expert Reviews and News on Laptops, Smartphones and Tech Innovations > Benchmarks / Tech > Processor Comparison - Head 2 Head
Redaktion, 2017-09- 8 (Update: 2023-07- 1)