Notebookcheck Logo

Intel Core i7-3960X vs Intel Core i5-9300HF

Intel Core i7-3960X

► remove from comparison Intel 3960X

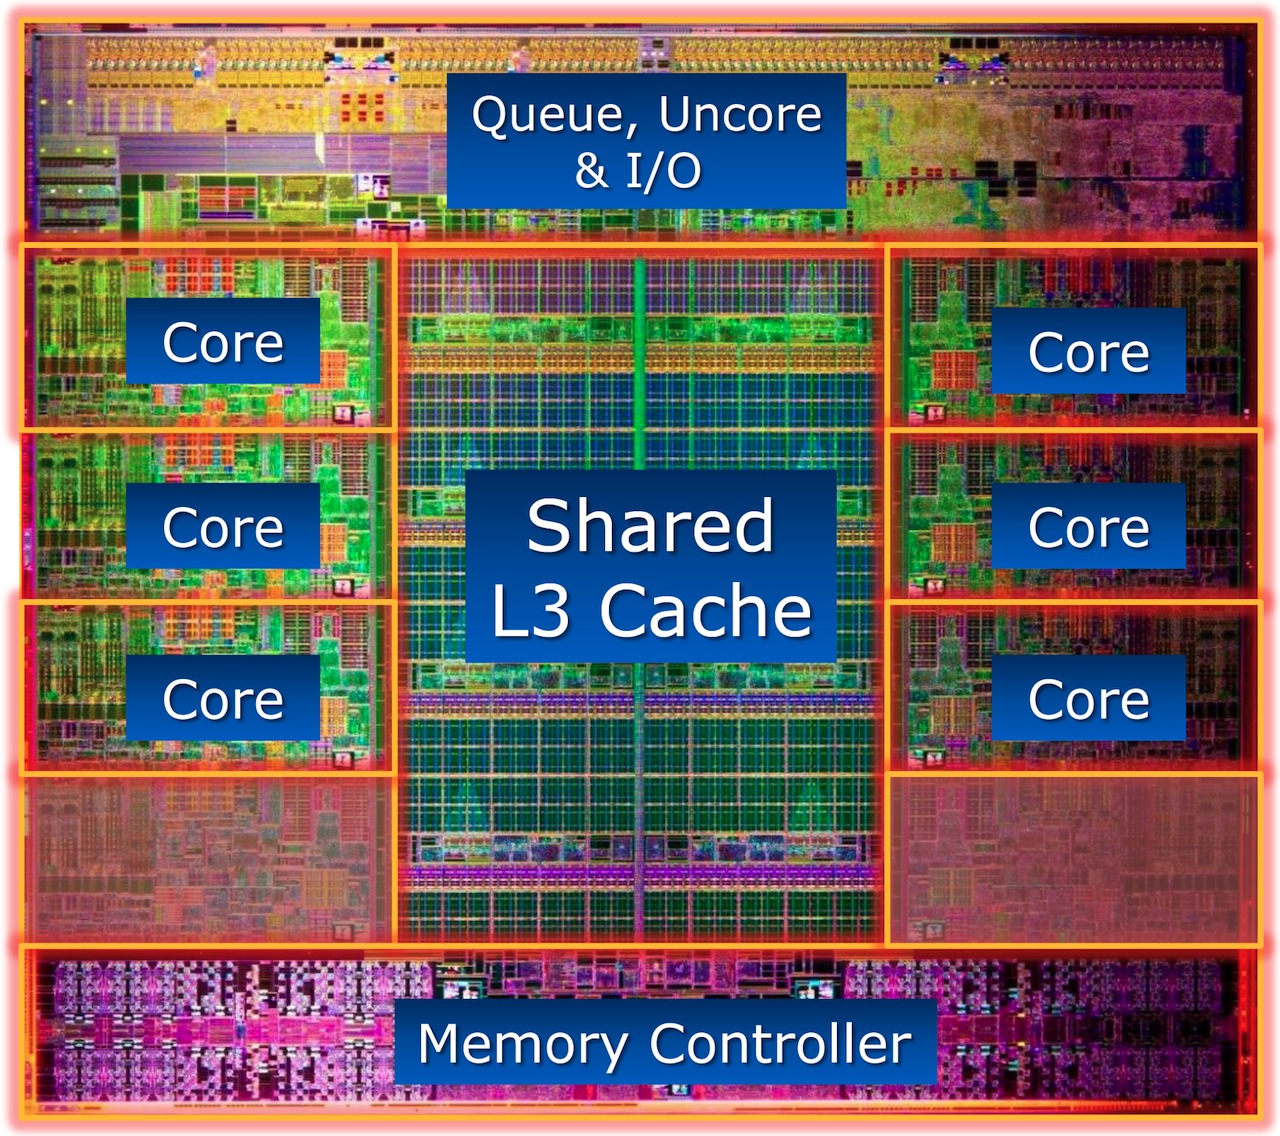
The Intel Core i7-3960X is a high-end desktop processor of the Sandy-Bridge-E series with 6 processor cores and 15 MB level 3 cache. It offers no integrated graphics card and the TDP of 130 Watt suites the CPU only for large desktops. The integrated quad-channel DDR3-1600 memory controller supports up to 64 GB RAM.

Thanks to the six cores, the performance in theoretical benchmarks is clearly above the fastest Ivy-Bridge and Haswell quad cores. However, in applications and games that wont use all six cores, these consumer CPUs are usually faster.

The first C1 stepping of the CPU had no support for VT-d virtualization, later edition do however.

Intel Core i5-9300HF

► remove from comparison Intel i5-9300HF

The Intel Core i5-9300H is a fast processor for laptops with four cores based on the Coffee Lake architecture (2019 Refresh, CFL-HR). The processor clocks at between 2.4 and 4.1 GHz (4 with 4 cores) and can execute up to eight threads simultaneously thanks to Hyper-Threading. According to Intel, the CPU is manufactured in an improved 14nm (14nm++) process. Compared to the predecessor, the Core i5-8300H from 2018, the 9300H is clocked slightly higher (+100 MHz CPU).

Compared to the Core i5-9300H, the integrated graphics card in the 9300HF is deactivated.

The Coffee Lake architecture is similar to Kaby Lake and differs only in the amount of cores (now six cores for the high end versions) and the improved 14nm process (14nm++ according to Intel).

Performance

The Intel Core i5-9300HF should perform similar as the older Core i7-7920HQ (3.1 - 4.1 GHz). The faster Coffee Lake CPUs, like the Core i7-8750H/9750H offers two additional cores and is therefore up to 50% faster in multithreaded benchmarks. Still, the performance of the i5-9300HF should be sufficient for even demanding applications and games. Compared to the Core i5-9300H (see for benchmarks), the performance should be identical.

Power Consumption

Intel specifies the TDP with 45 watts and therefore the i5 is only suited for big laptops with good cooling solutions. Using cTDP-down, the CPU can also be configured to 35 Watt resulting in a reduced performance.

ModelIntel Core i7-3960XIntel Core i5-9300HF
SeriesIntel Core i7 (Desktop)Intel Coffee Lake
CodenameSandy Bridge-ECoffee Lake-H
Clock3300 - 3900 MHz2400 - 4100 MHz
L1 Cache384 KB256 KB
L2 Cache1.5 MB1 MB
L3 Cache15 MB8 MB
Cores / Threads6 / 124 / 8
TDP130 Watt45 Watt
Transistors2270 Million
Technology32 nm, 0.6-1.3514 nm
Die Size435 mm2
SocketFCLGA2011FCBGA1440
FeaturesQuad-Channel DDR3 Memory Controller, Hyper-Threading, AES, Enhanced Speedstep, SSE1-4.2Dual-Channel DDR4 Memory Controller, HyperThreading, AVX, AVX2, Quick Sync, Virtualization, AES-NI
Architecturex86x86
$999 U.S.$250 U.S.
Announced
Manufacturerark.intel.comark.intel.com
Series: Coffee Lake Coffee Lake-H
Intel Core i9-9980HK compare2.4 - 5 GHz8 / 16 cores16 MB L3
Intel Core i9-9880H compare2.3 - 4.8 GHz8 / 16 cores16 MB L3
Intel Core i9-8950HK compare2.9 - 4.8 GHz6 / 12 cores12 MB L3
Intel Xeon E-2186M compare2.9 - 4.8 GHz6 / 12 cores12 MB L3
Intel Xeon E-2276M compare2.8 - 4.7 GHz6 / 12 cores12 MB L3
Intel Core i7-9850H compare2.6 - 4.6 GHz6 / 12 cores12 MB L3
Intel Core i7-9750H compare2.6 - 4.5 GHz6 / 12 cores12 MB L3
Intel Xeon E-2176M compare2.7 - 4.4 GHz6 / 12 cores12 MB L3
Intel Core i7-8850H compare2.6 - 4.3 GHz6 / 12 cores9 MB L3
Intel Core i7-8750H compare2.2 - 4.1 GHz6 / 12 cores9 MB L3
Intel Core i5-9400H compare2.5 - 4.3 GHz4 / 8 cores8 MB L3
Intel Core i5-9300HF « 2.4 - 4.1 GHz4 / 8 cores8 MB L3
Intel Core i5-9300H compare2.4 - 4.1 GHz4 / 8 cores8 MB L3
Intel Core i5-8400H compare2.5 - 4.2 GHz4 / 8 cores8 MB L3
Intel Core i5-8300H compare2.3 - 4 GHz4 / 8 cores8 MB L3
Intel Core i3-8100H compare3 GHz4 / 4 cores8 MB L3
max. Temp.100 °C

Benchmarks

Cinebench R15 - Cinebench R15 CPU Multi 64 Bit
100%
1 3960X +
1158 Points (7%)
Cinebench R15 - Cinebench R15 CPU Single 64 Bit
100%
1 3960X +
159 Points (48%)
Cinebench R11.5 - Cinebench R11.5 CPU Multi 64 Bit
100%
1 3960X +
min: 10.5     avg: 10.7     median: 10.5 (14%)     max: 11.35 Points
Cinebench R11.5 - Cinebench R11.5 CPU Single 64 Bit
100%
1 3960X +
min: 1.46     avg: 1.5     median: 1.5 (38%)     max: 1.57 Points
Cinebench R10 - Cinebench R10 Rend. Single (32bit)
100%
1 3960X +
min: 4995     avg: 5014     median: 5013.5 (30%)     max: 5032 Points
Cinebench R10 - Cinebench R10 Rend. Multi (32bit)
100%
1 3960X +
min: 27087     avg: 27190     median: 27189.5 (20%)     max: 27292 Points
Cinebench R10 - Cinebench R10 Rend. Multi (64bit)
100%
1 3960X +
min: 32120     avg: 32404     median: 32328 (22%)     max: 32763 Points
Cinebench R10 - Cinebench R10 Rend. Single (64bit)
100%
1 3960X +
min: 5868     avg: 6121     median: 6190 (8%)     max: 6305 Points
wPrime 2.10 - wPrime 2.0 1024m *
100%
1 3960X +
min: 146.5     avg: 152.8     median: 152.8 (2%)     max: 159.1 s
wPrime 2.10 - wPrime 2.0 32m *
100%
1 3960X +
min: 4.88     avg: 5.1     median: 5.1 (1%)     max: 5.351 s
wPrime 1.55 - wPrime 1.55 1024m *
100%
1 3960X +
143 s (1%)
wPrime 1.55 - wPrime 1.55 32m *
100%
1 3960X +
4.9 s (3%)
WinRAR - WinRAR 4.0
100%
1 3960X +
min: 4198     avg: 4205     median: 4204.5 (7%)     max: 4211 Points
X264 HD Benchmark 4.0 - x264 Pass 2
100%
1 3960X +
min: 54.1     avg: 54.6     median: 54.8 (19%)     max: 54.8 fps
X264 HD Benchmark 4.0 - x264 Pass 1
100%
1 3960X +
min: 171     avg: 172.6     median: 173 (40%)     max: 173.9 fps
TrueCrypt - TrueCrypt Serpent
100%
1 3960X +
min: 0.481     avg: 0.5     median: 0.5 (0%)     max: 0.488 GB/s
TrueCrypt - TrueCrypt Twofish
100%
1 3960X +
min: 0.819     avg: 0.9     median: 0.9 (15%)     max: 0.868 GB/s
TrueCrypt - TrueCrypt AES
100%
1 3960X +
5.2 GB/s (14%)
3DMark 06 - CPU - 3DMark 06 - CPU
100%
1 3960X +
min: 8294     avg: 8362     median: 8330 (18%)     max: 8463 Points
Super Pi mod 1.5 XS 1M - Super Pi mod 1.5 XS 1M *
100%
1 3960X +
min: 9.69     avg: 9.8     median: 9.7 (2%)     max: 10 s
Super Pi mod 1.5 XS 2M - Super Pi mod 1.5 XS 2M *
100%
1 3960X +
min: 21.7     avg: 21.8     median: 21.8 (1%)     max: 22 s
Super Pi Mod 1.5 XS 32M - Super Pi mod 1.5 XS 32M *
100%
1 3960X +
min: 541     avg: 552     median: 542 (2%)     max: 574 s
SiSoft Sandra Dhrystone (MIPS) - SiSoft Sandra Dhrystone (MIPS)
100%
1 3960X +
min: 164000     avg: 193900     median: 207000 (98%)     max: 210700 MIPS
SiSoft Sandra Whetstone (MFLOPS) - SiSoft Sandra Whetstone (MFLOPS)
100%
1 3960X +
min: 128590     avg: 129540     median: 129690 (100%)     max: 130340 MFLOPS
Windows 7 Experience Index - Win7 CPU
100%
1 3960X +
7.8 Points (100%)
3DMark Vantage - 3DM Vant. Perf. CPU no Physx
100%
1 3960X +
min: 36298     avg: 36650     median: 36668 (32%)     max: 36985 Points
3DMark 11 - 3DM11 Performance Physics
100%
1 3960X +
min: 12028     avg: 12052     median: 12052 (33%)     max: 12076 Points
3DMark - 3DMark Ice Storm Physics
62187 Points (51%)
3DMark - 3DMark Ice Storm Extreme Physics
61764 Points (50%)
3DMark - 3DMark Ice Storm Unlimited Physics
63470 Points (53%)
3DMark - 3DMark Cloud Gate Physics
9839 Points (25%)
3DMark - 3DMark Fire Strike Standard Physics
14908 Points (27%)
Geekbench 5.5 - Geekbench 5.1 - 5.4 64 Bit Single-Core
1090 Points (46%)
Geekbench 5.5 - Geekbench 5.1 - 5.4 64 Bit Multi-Core
4370 Points (8%)
Geekbench 4.4 - Geekbench 4.1 - 4.4 64 Bit Single-Core
4447 Points (44%)
Geekbench 4.4 - Geekbench 4.1 - 4.4 64 Bit Multi-Core
14512 Points (16%)
Geekbench 3 - Geekbench 3 64 Bit Multi-Core
100%
1 3960X +
19300 Points (30%)
Geekbench 3 - Geekbench 3 64 Bit Single-Core
100%
1 3960X +
3314 Points (50%)

Average Benchmarks Intel Core i7-3960X → 0% n=

Average Benchmarks Intel Core i5-9300HF → 0% n=

- Range of benchmark values for this graphics card
- Average benchmark values for this graphics card
* Smaller numbers mean a higher performance
1 This benchmark is not used for the average calculation

Add one or more devices and compare

In the following list you can select (and also search for) devices that should be added to the comparison. You can select more than one device.

restrict list:

show all (including archived), 2024, 2023
v1.27
log 17. 20:07:46

#0 checking url part for id 3005 +0s ... 0s

#1 checking url part for id 12136 +0s ... 0s

#2 not redirecting to Ajax server +0s ... 0s

#3 did not recreate cache, as it is less than 5 days old! Created at Sun, 16 Jun 2024 05:37:17 +0200 +0.001s ... 0.001s

#4 composed specs +0.021s ... 0.022s

#5 did output specs +0s ... 0.022s

#6 getting avg benchmarks for device 3005 +0.004s ... 0.025s

#7 got single benchmarks 3005 +0.017s ... 0.043s

#8 getting avg benchmarks for device 12136 +0.003s ... 0.046s

#9 got single benchmarks 12136 +0.009s ... 0.055s

#10 got avg benchmarks for devices +0s ... 0.055s

#11 No cached benchmark found, getting uncached values +0.1s ... 0.155s

#12 No cached benchmark found, getting uncached values +0.005s ... 0.16s

#13 No cached benchmark found, getting uncached values +0.006s ... 0.166s

#14 No cached benchmark found, getting uncached values +0.006s ... 0.172s

#15 No cached benchmark found, getting uncached values +0.006s ... 0.178s

#16 min, max, avg, median took s +0.02s ... 0.198s

#17 return log +0.047s ... 0.244s

Please share our article, every link counts!
> Expert Reviews and News on Laptops, Smartphones and Tech Innovations > Benchmarks / Tech > Processor Comparison - Head 2 Head
Redaktion, 2017-09- 8 (Update: 2023-07- 1)