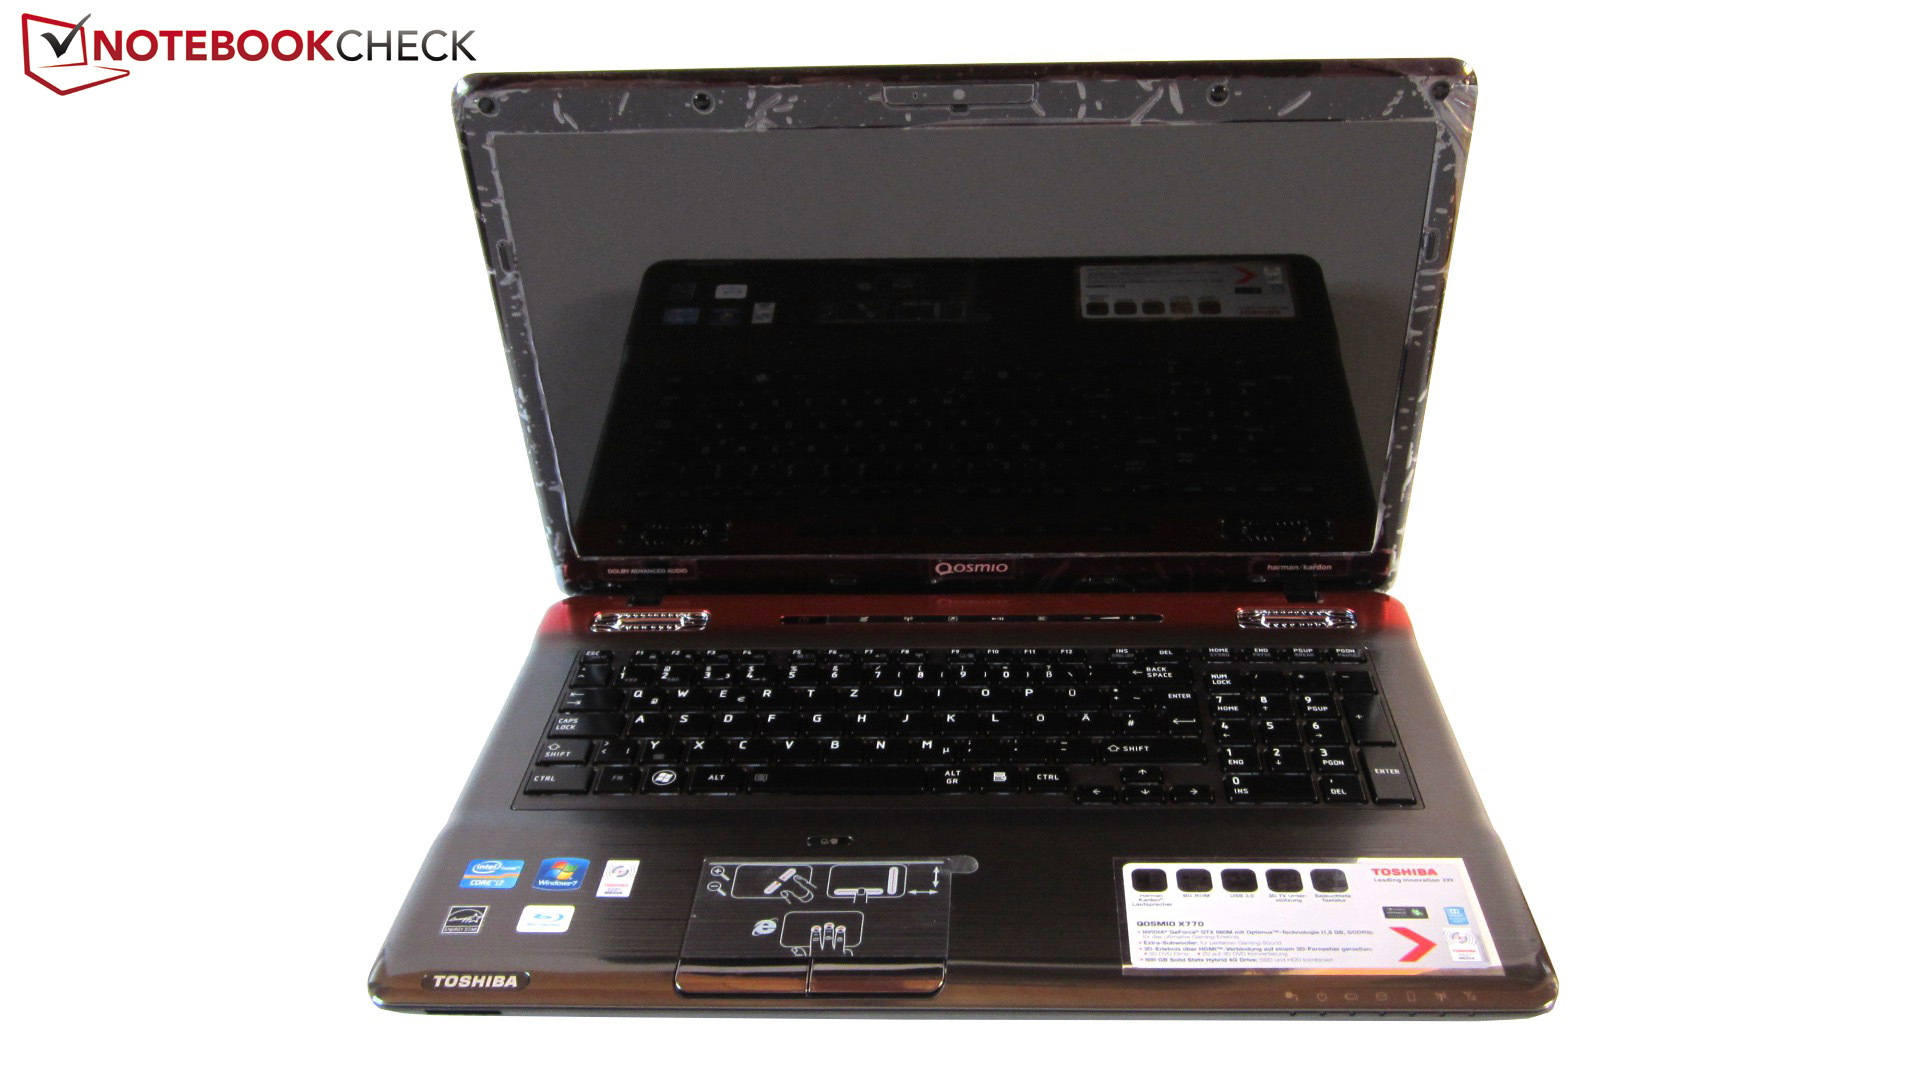
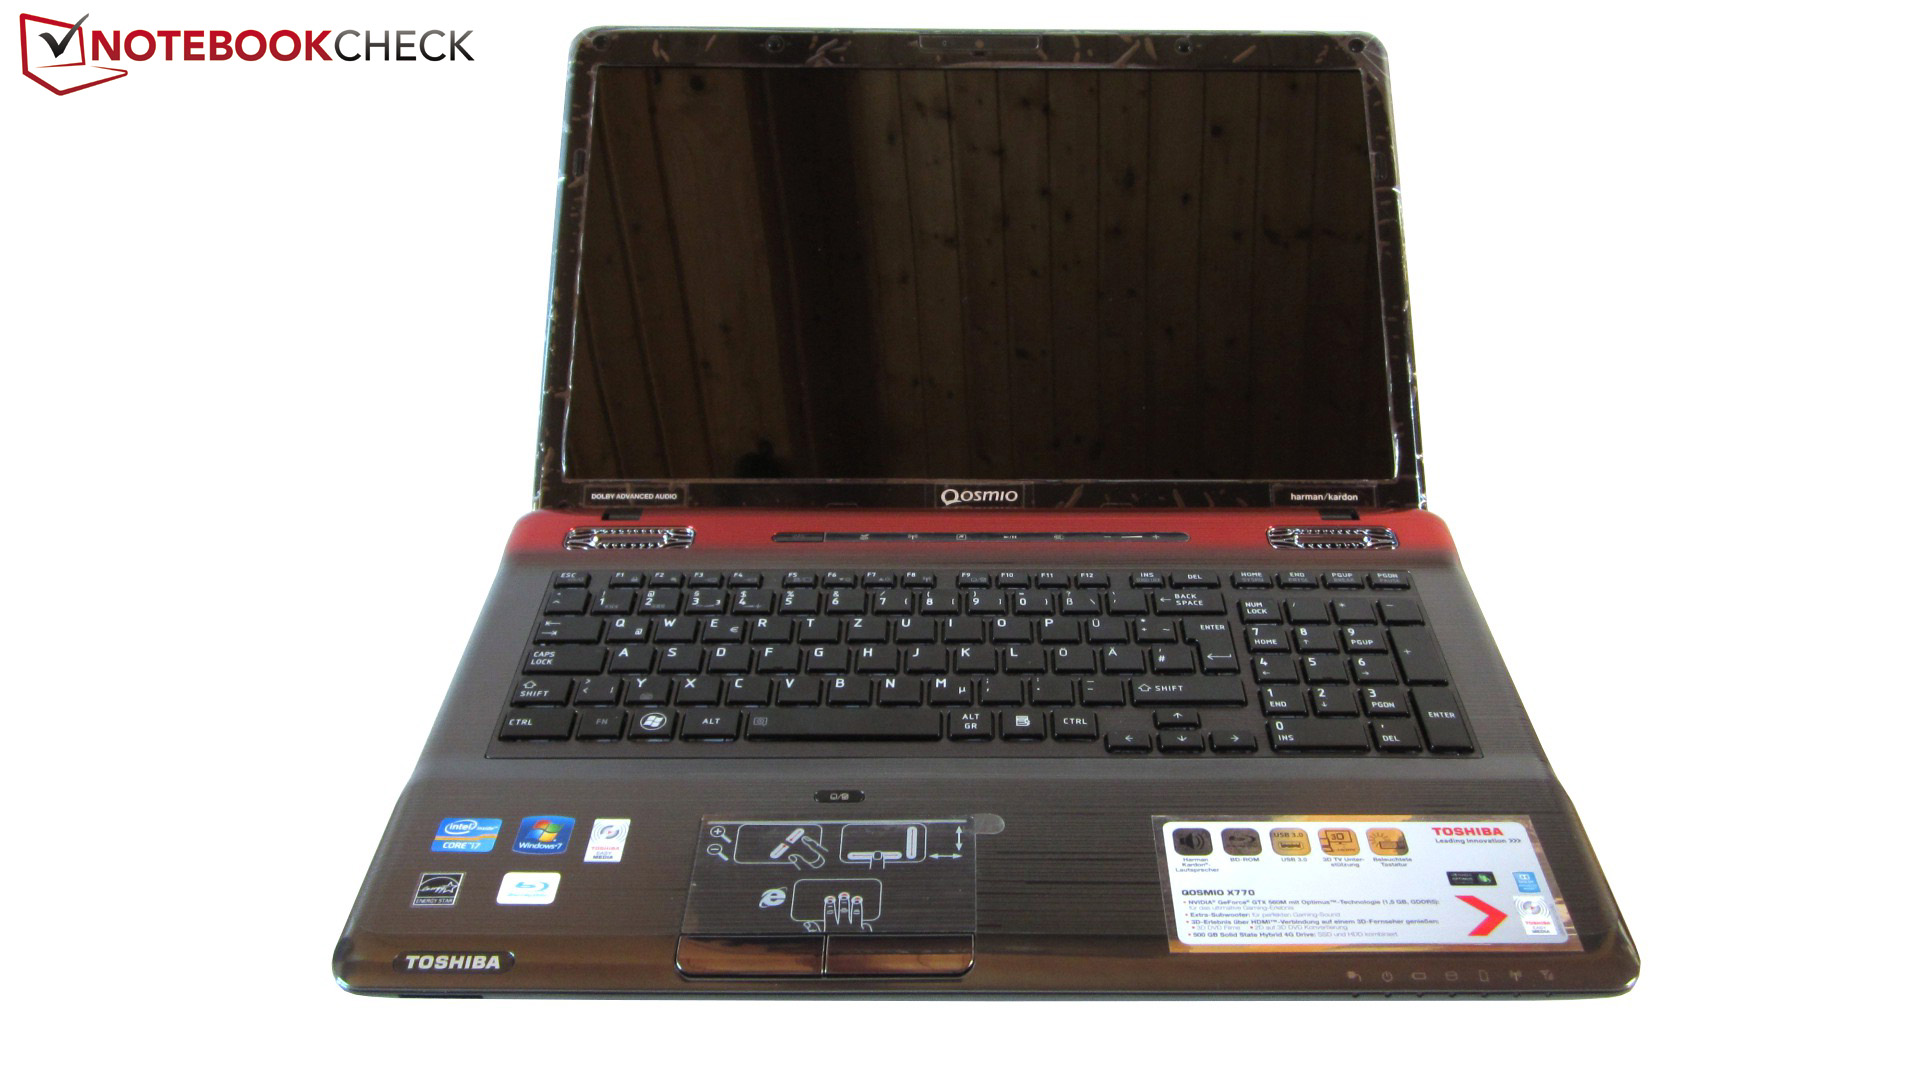
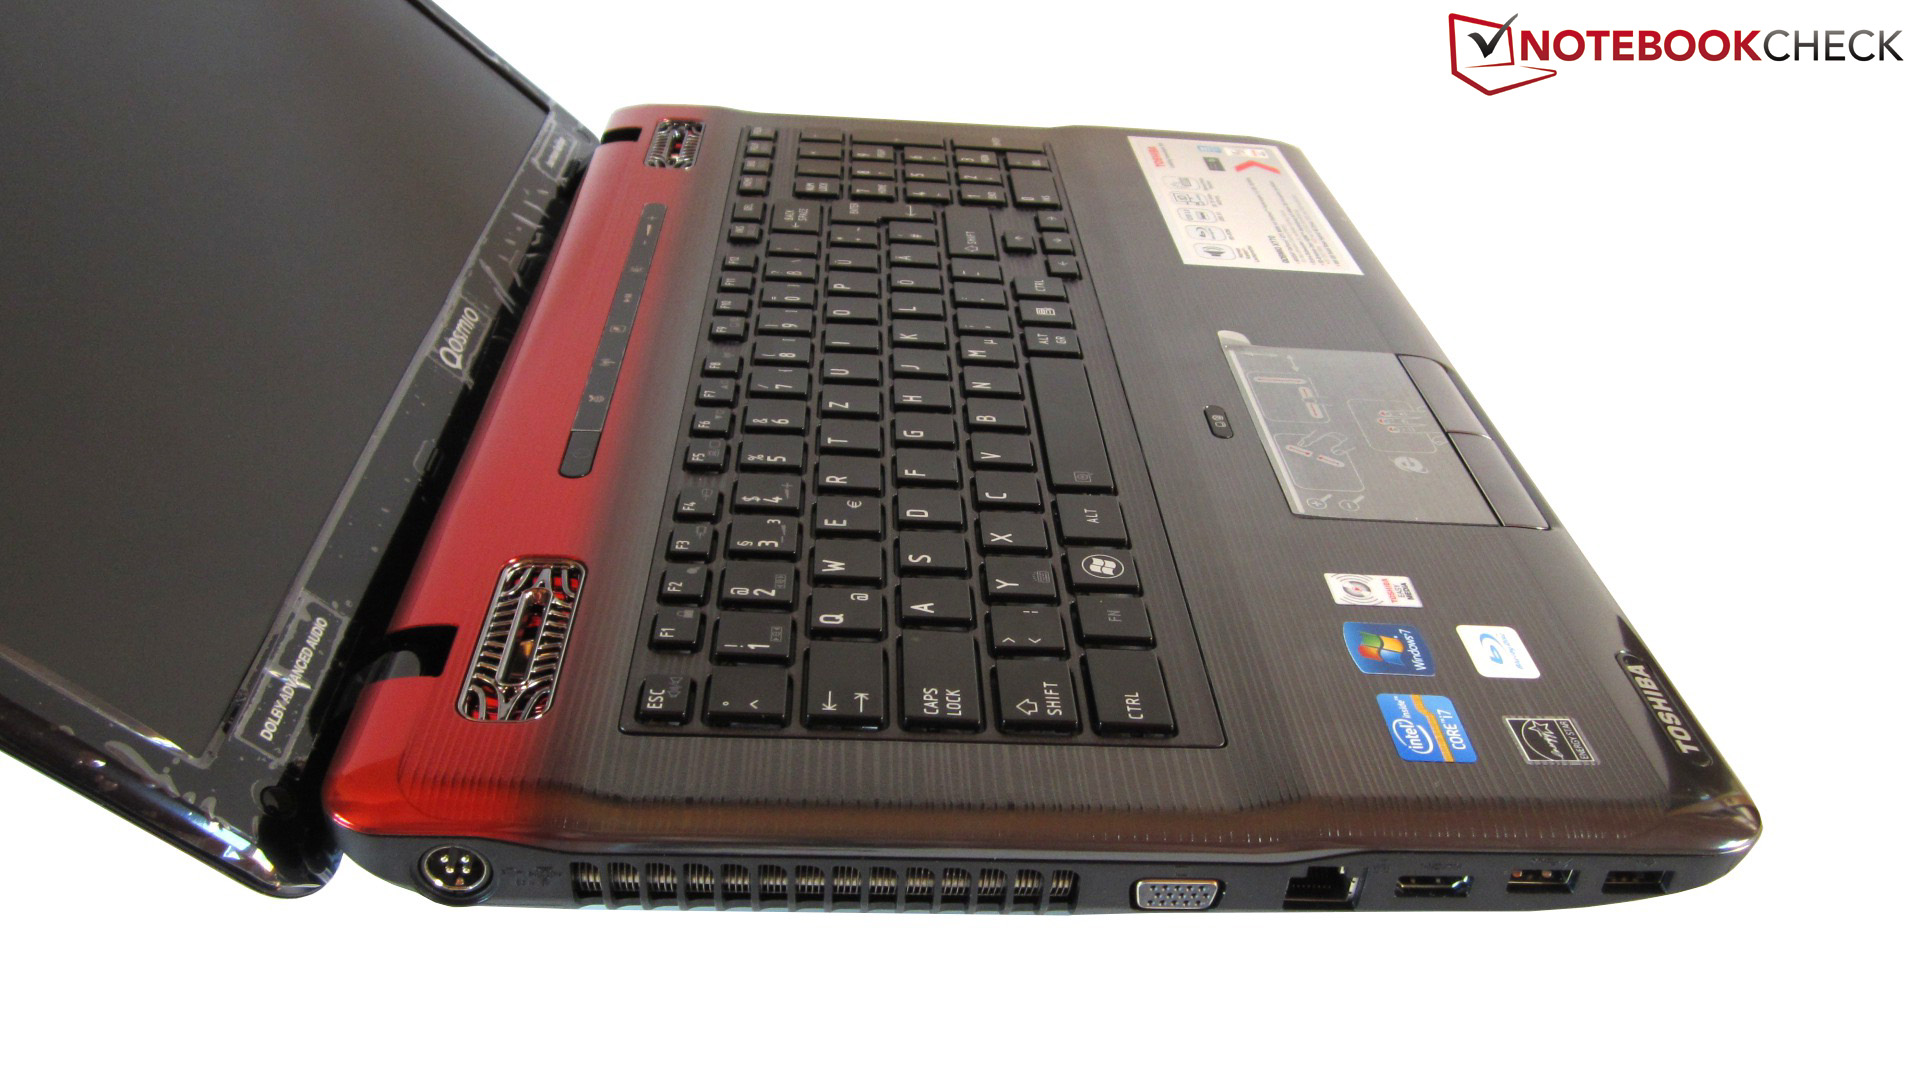
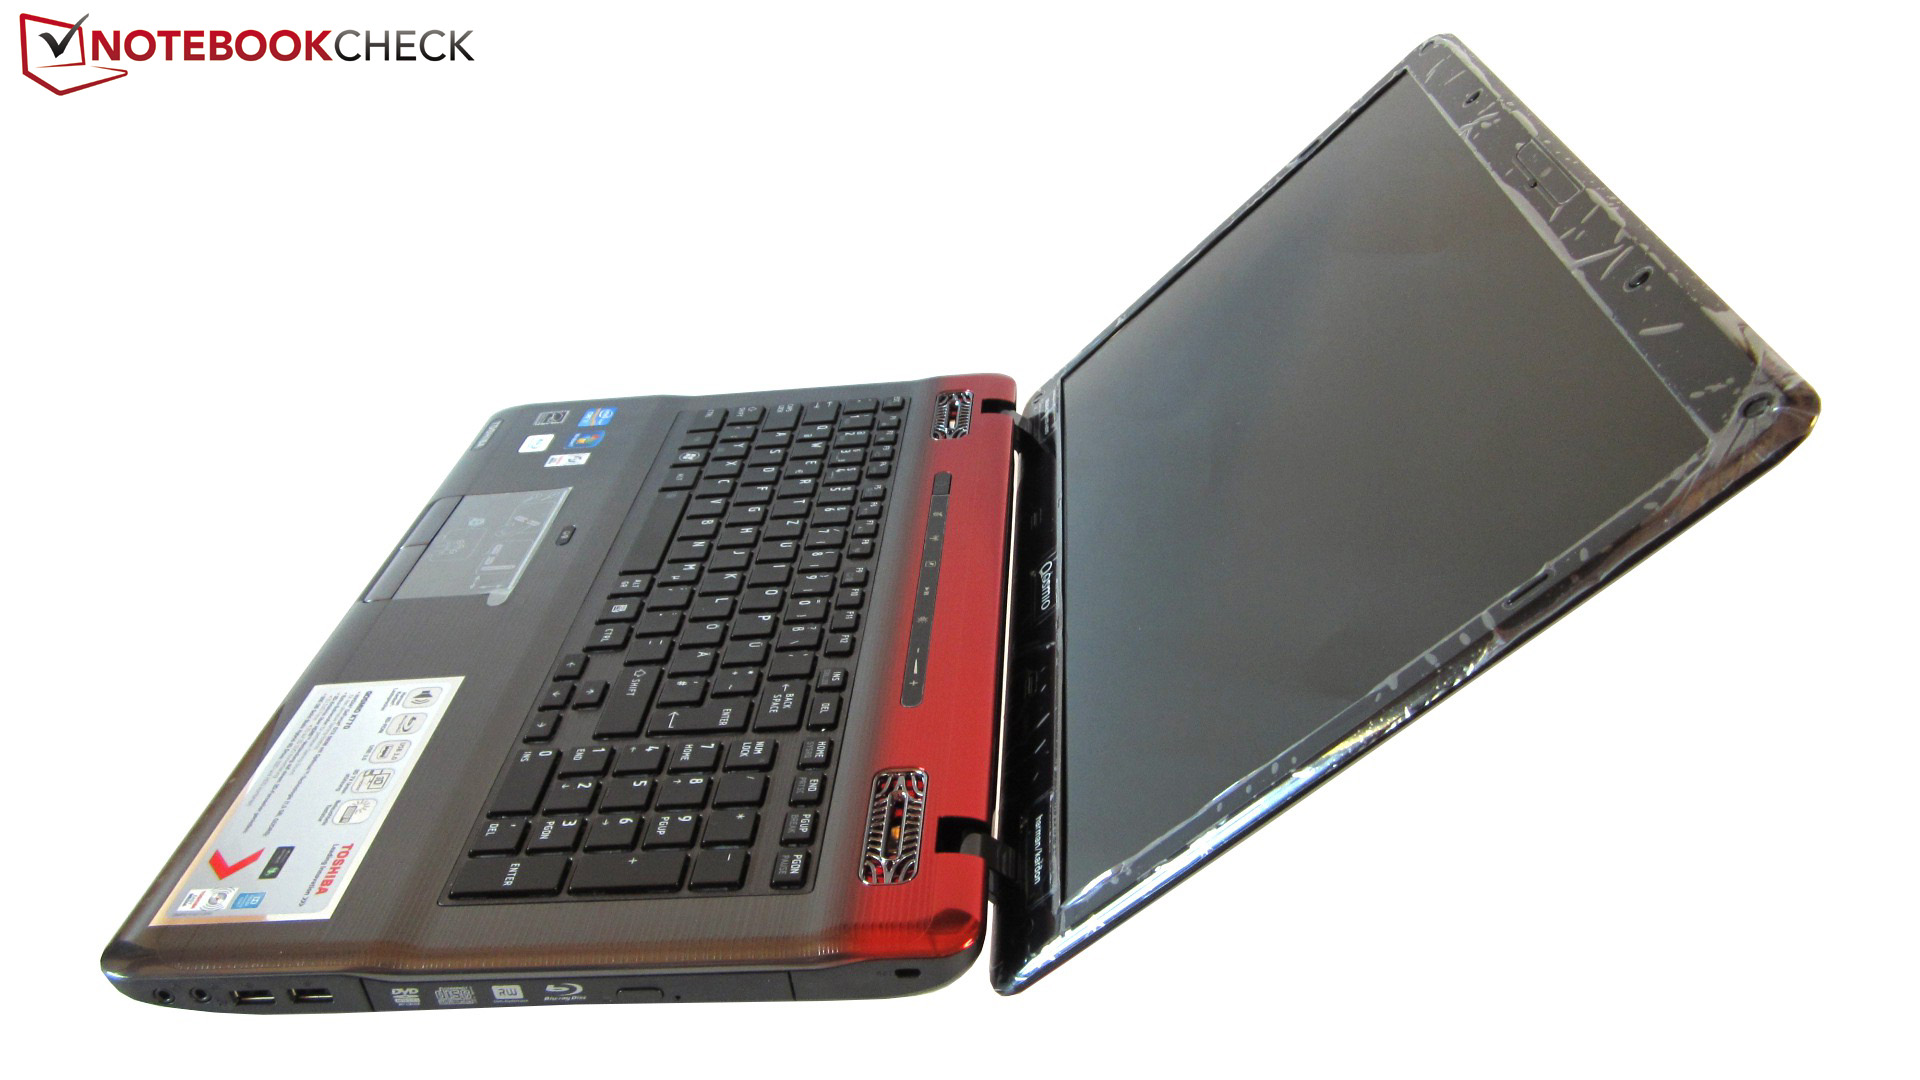
Review Toshiba Qosmio X770-11C 3D Notebook

In September 2011 we took a look at the Toshiba gaming flagship the X770. At that time we picked the small, "affordable" X770-10J with Core i7 2630QM, GeForce GTX 560M and a HD+ screen (1600x900 pixel resolution) as our test model. The picture quality of the otherwise perfect gaming notebook was disappointing (TruBrite HD+). A low contrast of 205:1 and poor viewing angles - this is not what a 1,300 Euros high-end gaming laptop should offer.
The X770-10J has been discontinued. The HD+ X770-11D and X770-123 have taken its place and these new models are equipped with a faster CPU: the Core i7 2670QM. We are interested in the Full HD configuration (1920x1080, TruBrite FHD) of the 17.3 inch 3D-ready Qosmio X770-11C. 1,400 Euros is a high price to pay for this model. So does the buyer get a first-class display for his money?
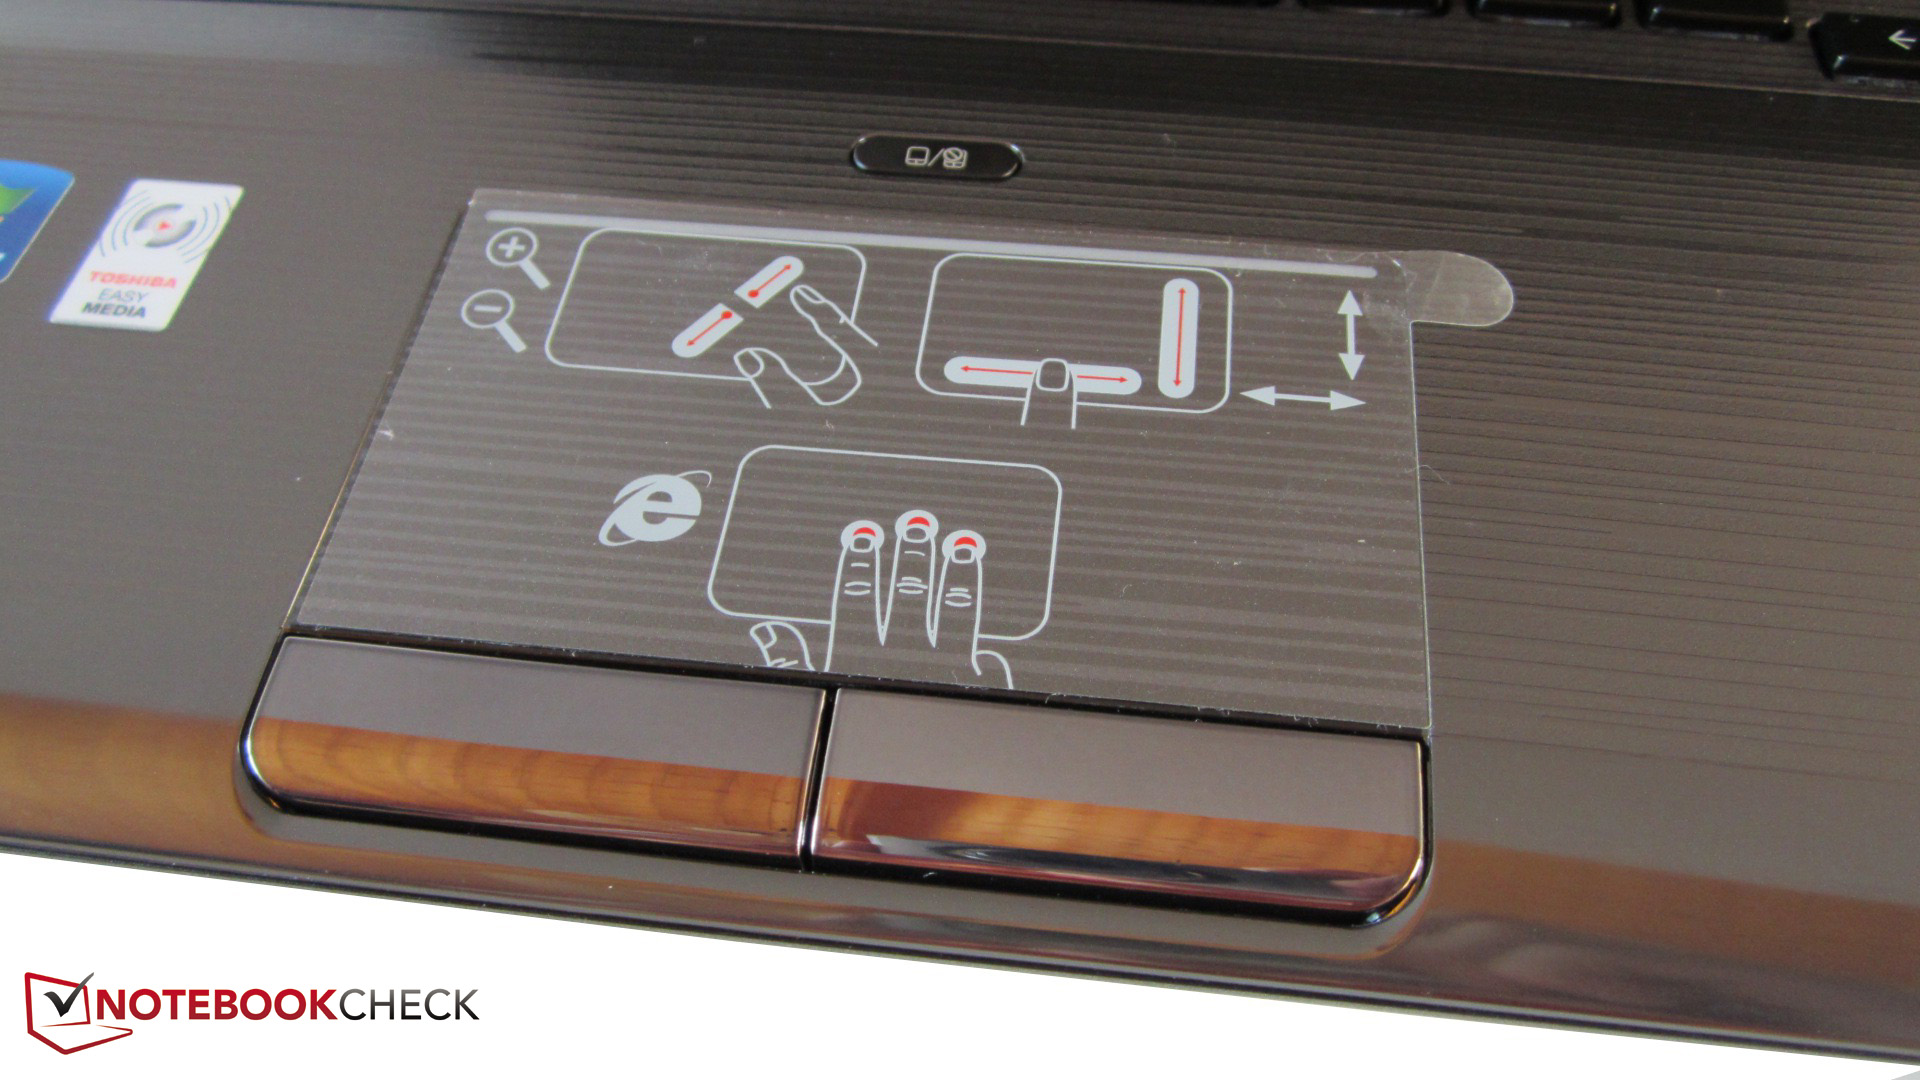
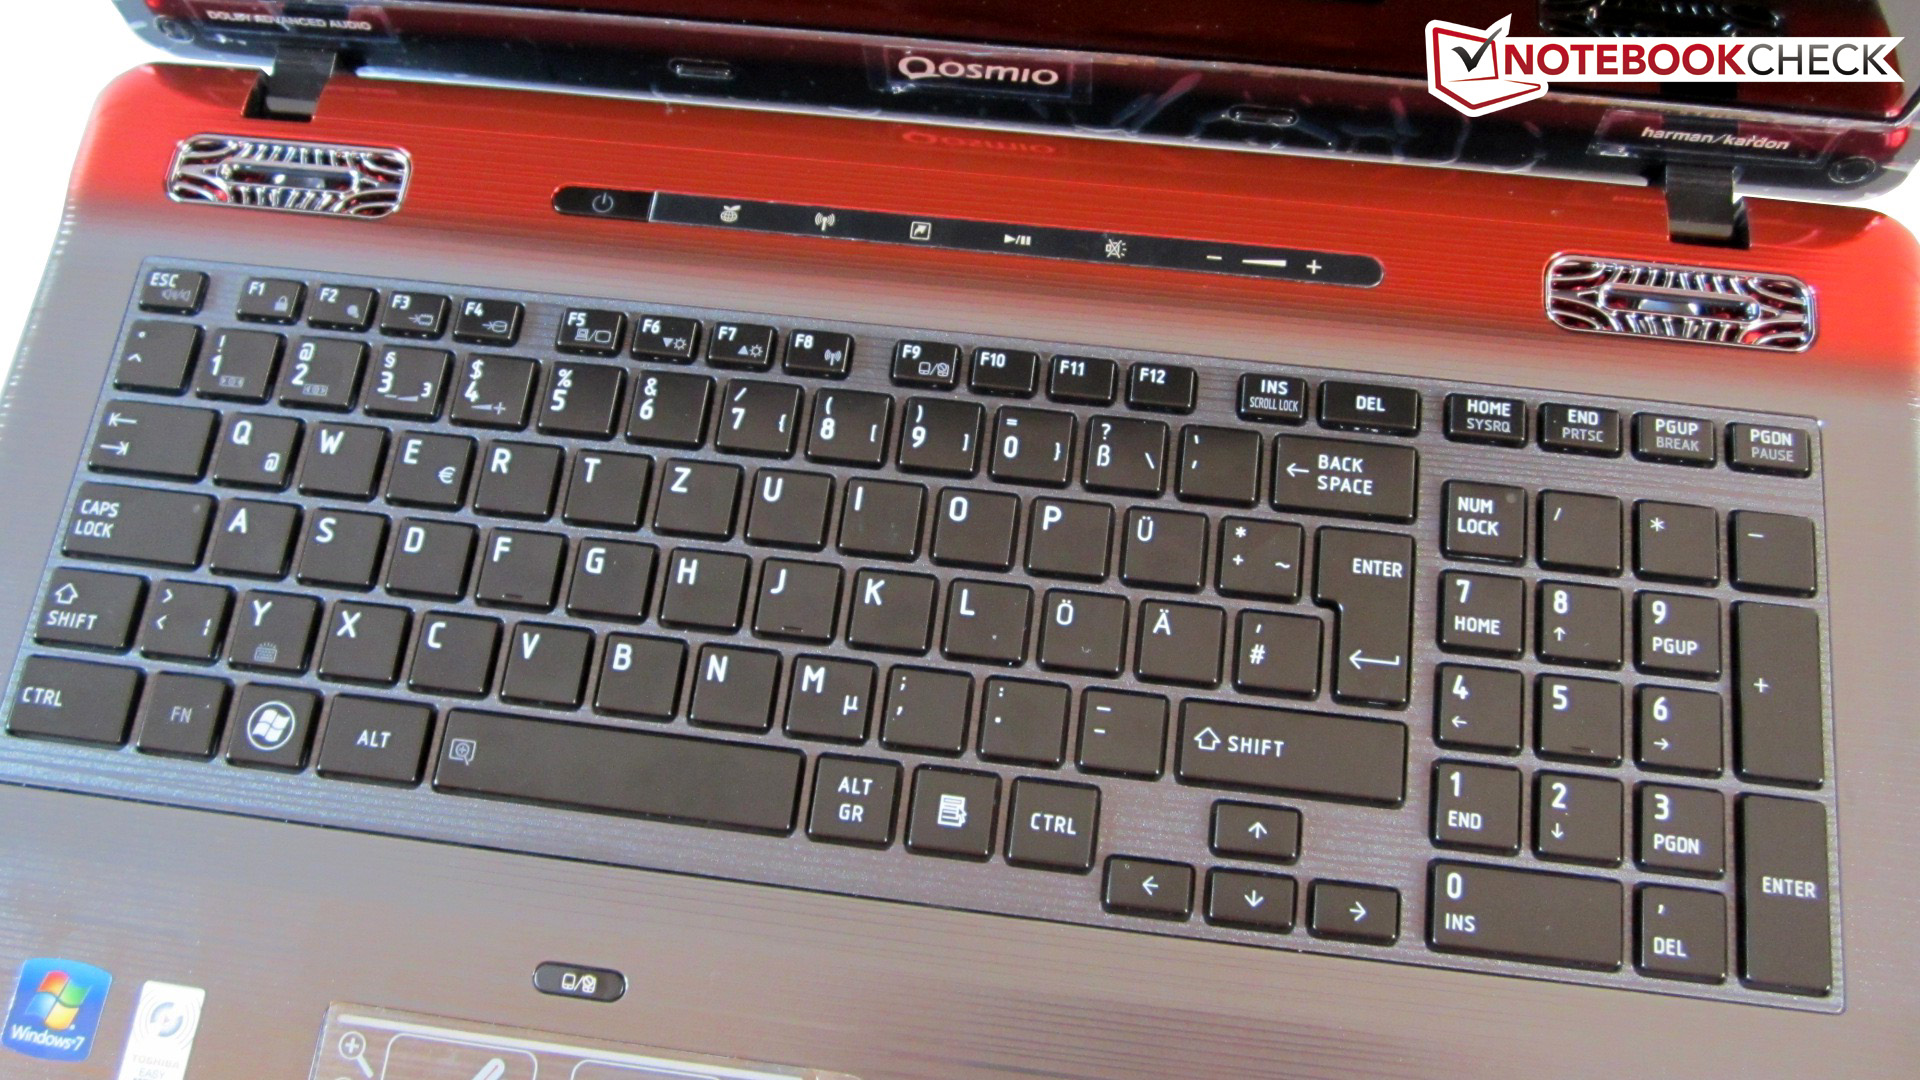
This update covers the display and the processor performance (new Core i7-2670QM - 4x2.20GHz). In addition, we will also cover battery life and emissions. For details about the input devices and the case of the laptop, we refer the reader to the Qosmio X770-10J review.
Display
The new Qosmio has a native resolution of 1920x1080 pixels (X770-10J - 1600x900 pixels). This is a must for all multimedia fans and the in-built Blu-Ray drive is a pleasant bonus. This 17.3 inch test model is reflective but that should not be a problem indoors. The panel is manufactured by Samsung (SEC5044-173HT02-T01) whereas the HD+ panel of last year's X770 test model came from AU Optronics (B173RW01 V3 / AUO139E).
Does the Full HD panel cover the professional sRGB color room? The 3D panel comes close to covering the sRGB color room. On the bright side, the display can show more colors in the yellow region. The HD+ version (X770-10J and other models) beat the FHD panel of our test model clearly: the color grid covers more area (see the third picture). The gaming flagship of Asus, the G74SX-3DE, is slightly better in this area.

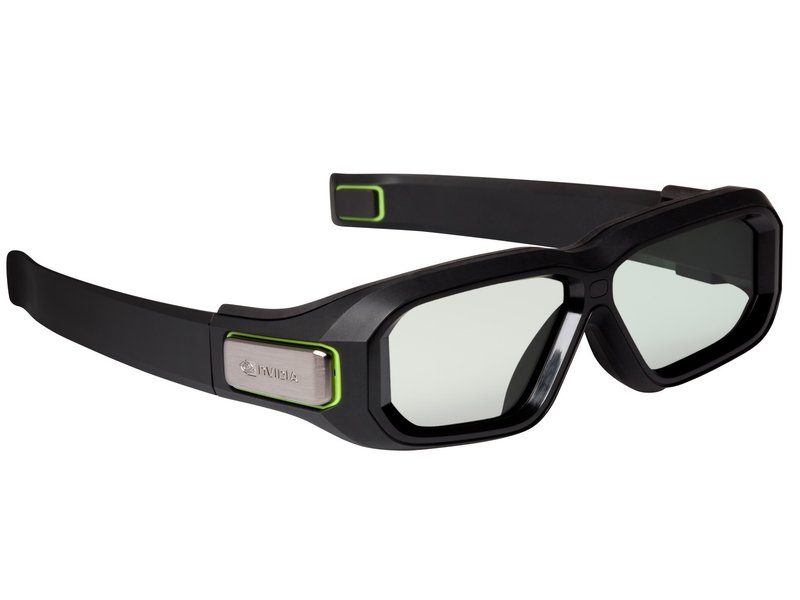
We want to take a look at the Shutter glasses and 3D option of the X770-11C. The laptop package includes a pair of active Shutter glasses (second generation). The TFT panel has a frequency of 120 Hz (typically TFTs: 60 Hz). The 3D effect is nothing new thanks to Nvidia 3D Vision, but it does make gaming more enjoyable, especially when running a strong graphics card like the GeForce GTX 560M. The performance of the graphics card is the deciding factor for 3D gaming as it has to process two half pictures (right and left eye). This halves the frame rates of games.
In our extensive test of Nvidia 3D Vision, we presented the technology and its dis-/advantages. We recommend the readers to take a look at it: Nvidia 3D Vision
| |||||||||||||||||||||||||
Brightness Distribution: 86 %
Center on Battery: 162 cd/m²
Contrast: 736:1 (Black: 0.22 cd/m²)
65.7% AdobeRGB 1998 (Argyll 3D)
89.7% sRGB (Argyll 3D)
68.2% Display P3 (Argyll 3D)

We can tell at first glance that the manufacturer did not cut costs with the display and has given the test model a TFT panel with good contrast. The black value of 0.22 cd/m² at the highest brightness level confirms our suspicion: the contrast is 736:1. The screen of our test model displays intense colors whereas the HD+ panel of the X770-10J has dull colors (contrast of 205:1).
The brightness of the panel is lower than that of the HD+ panel (213 cd/m²). The average illumination is 155 cd/m². Thankfully, the illumination has become more balanced. Instead of 74%, we measured 86%. This means that the user will not be able to distinguish patches with different brightness on the panel.
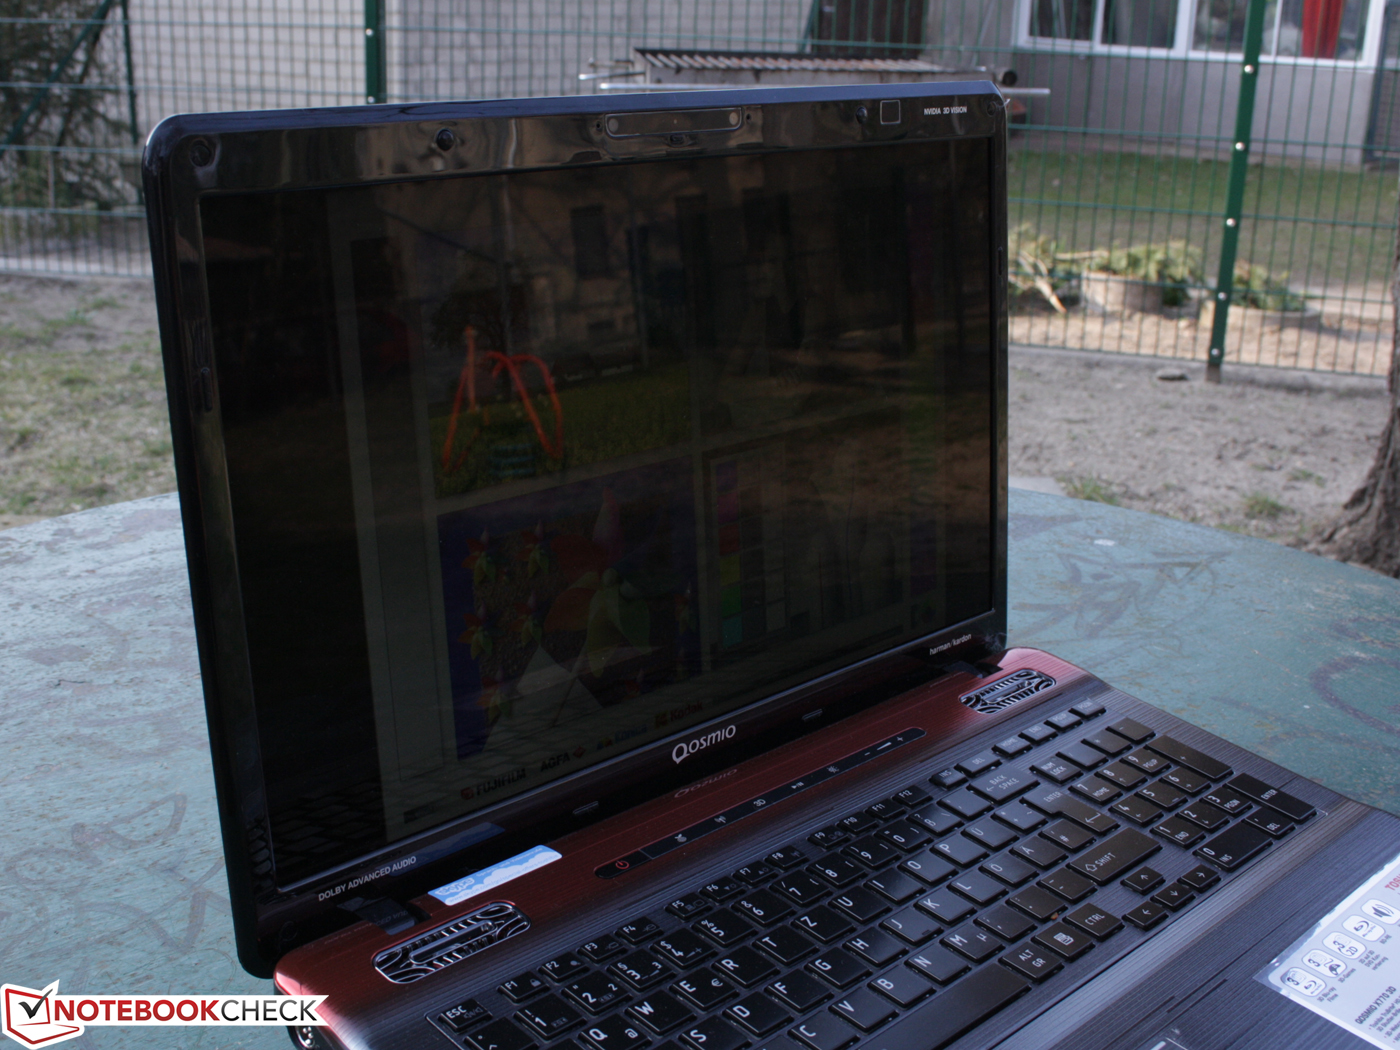
Glare Type (not anti-glare) and low brightness mean that the X770 is confined indoors. The laptop is far too dark even in the shadows. The satisfying colors are not able to have the proper affect. A matte TFT surface would not have been better as the brightness is too low.

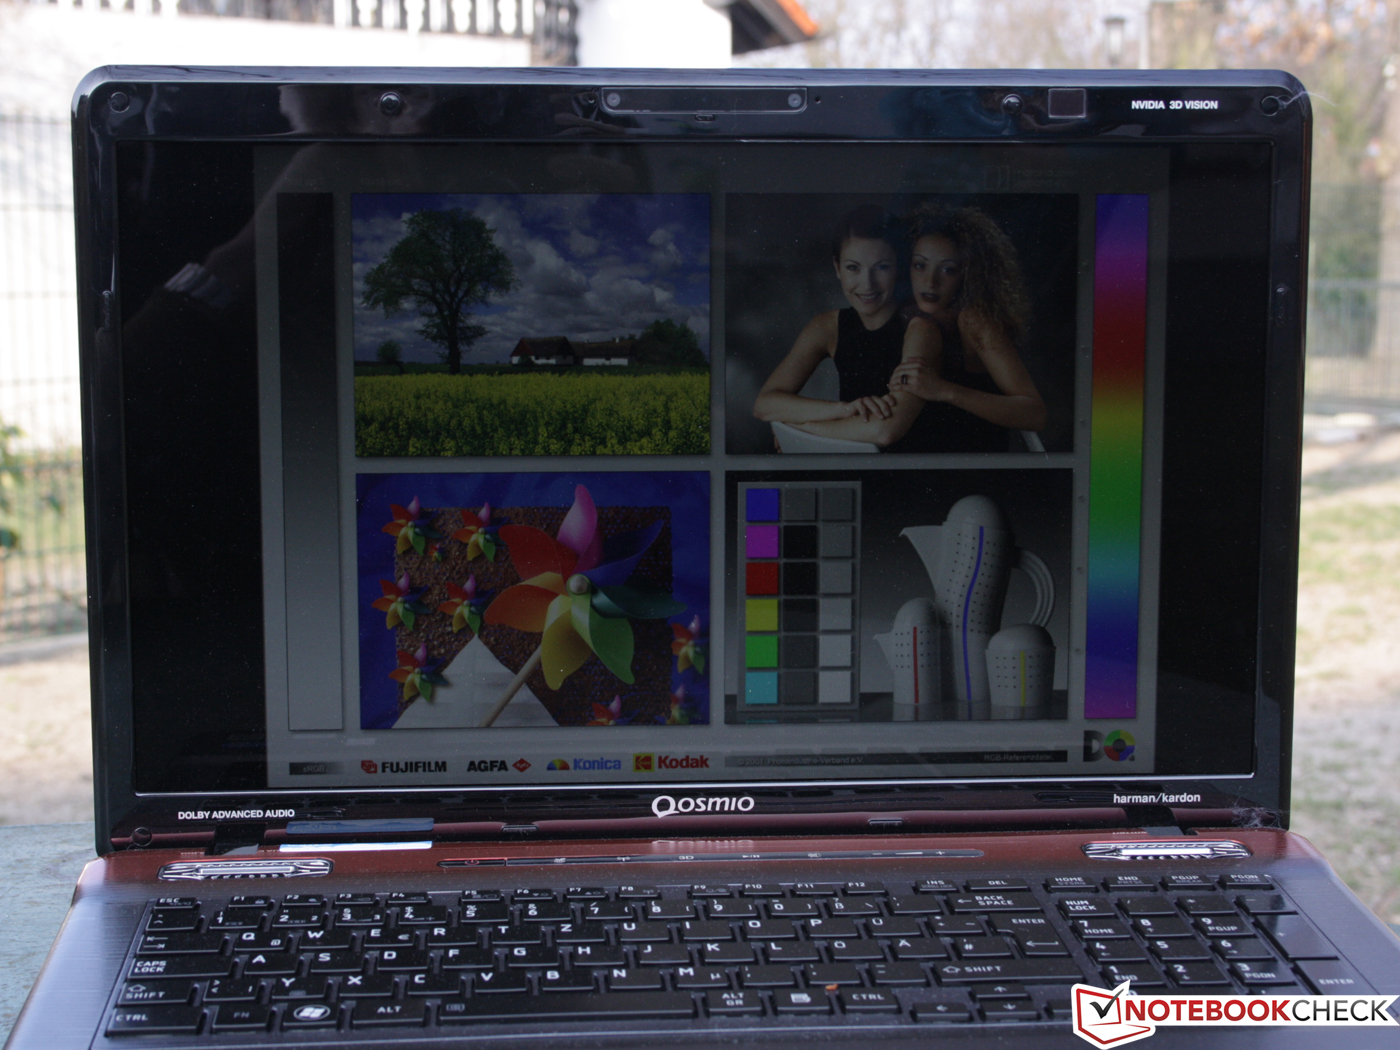
The viewing angles are quite wide and allow the notebook to be used for gaming, watching movies or TV with friends. A second or third viewer can look from the side or from above and does not suffer from ghost images. However, looking at the screen from below, will invert the colors. This is what separates the best notebook TFTs from the ordinary ones.
Poor viewing angles are the norm for laptops. A high-quality and expensive model should not have such poor viewing angles. Thankfully, the manufacturer made the right decision in picking the Samsung panel.

Performance
Toshiba has picked a fitting quad-core processor from the latest Intel line-up: the Sandy Bridge generation. The Intel Core i7 2670QM runs all four cores at 2.2 GHz and performs higher than the 2630QM of the X770-10J (first test model).
The CPU can be boosted from its standard 2.2 GHz to a maximum of 3.1 GHz (2630QM Turbo up to 2.9 GHz.). This much performance needs a lot of power and means shorter battery life.
The integrated Intel HD Graphics 3000 is deactivated (without a BIOS option), which means that the GeForce GTX 560M is solely responsible for the video output (no Optimus switchable graphics). This is different from the 10J model which uses the 2630QM and employs the IGP graphics. When needed, the laptop switched to the GTX 560M.
Processor
The 2670QM can leave the lower speed 2630QM far behind in processing power. The Cinebench R11.5 64 bit score of the CPU is 5.34 points. This is at the same level as the high-end processor: i7 2820QM (Alienware M17x R3 GTX 580M). The 2630QM of the X770-10J has only 80% of this performance.
Of all the 2670QM test models (for example, MSI GT780DX-i71691BLW7H or HP Pavilion dv7-6c07eg) the X770-11c performs best in the CPU benchmarks: both in Single-Core benchmarks (SuperPi 32M: 3% better than the Pavilion dv7-6c07eg) and Multi-Core benchmarks (Wprime 1024m: 11% faster than the dv7-6c07eg). The 2670QM test models perform almost identically in the Cinebench R10 Multi (64 bit) benchmark.
System Performance
The extremely expensive Sandy Bridge XM processors offer the highest performance in the laptop world. However, in comparison to our X770 test model, even a 2920XM of the Dell Precision M6600 work station can only perform at 118%.
The high CPU performance is beneficial to the program performance. The performance is further improved by the hybrid hard disk from Seagate with 4 GB NAND flash memory (ST95005620AS). This hard disk can save frequently used files and programs on the flash memory so as to launch them faster. This reduces the start time and the time it takes to load frequently used programs.
The program performance benchmarks are less affected by the CPU performance: PCMark Vantage (8,682 points) and PCMark 7 (3,217 points). SSD DTRs are much faster: HP Pavilion dv7-6b02eg: +186/127%. Even notebooks with an ordinary 7200 RPM hard disk, such as the Asus G74SX-91079V, can achieve 99 points (77% of the performance of our X770 test model which uses a Hybrid HDD).
The Hybrid HDD can be extremely useful after a program has been run a few times, as shown by program benchmarks we ran multiple times and in the test of Toshiba Satellite P770-10P (same Hybrid HDD).
| PCMark Vantage Result | 8682 points | |
| PCMark 7 Score | 3217 points | |
Help | ||

| 3DMark 06 Standard Score | 15684 points | |
| 3DMark Vantage P Result | 10013 points | |
| 3DMark 11 Performance | 2020 points | |
Help | ||
Emissions
System Noise
The noise emissions of the test model are slightly higher than of the X770-10J. In the stress test, the emissions wavered between 43 to 47 dB(A). The fan switched off when the laptop was idle for a long time. The only emission then was the hard disk which emitted 31.4 dB(A).
Unfortunately, the user will have to bear the sudden turning up of the fan even while doing everyday tasks such as copying files, starting programs or surfing on the web. The fan can rise from a low 35 dB(A) to a clearly audible 43 dB(A). Instead of rotating constantly at a fixed medium speed the fan keeps speeding up and slowing down. The fan does not speed up or slow down for fixed times either. While the laptop is under heavy use, the fan acts in a similar fashion but the turned up phase lasts much longer.
Noise level
| Idle |
| 31.4 / 34.1 / 34.8 dB(A) |
| HDD |
| 34 dB(A) |
| DVD |
| 38.1 / dB(A) |
| Load |
| 34.8 / 47.1 dB(A) |
 | ||
30 dB silent 40 dB(A) audible 50 dB(A) loud |
||
min: | ||
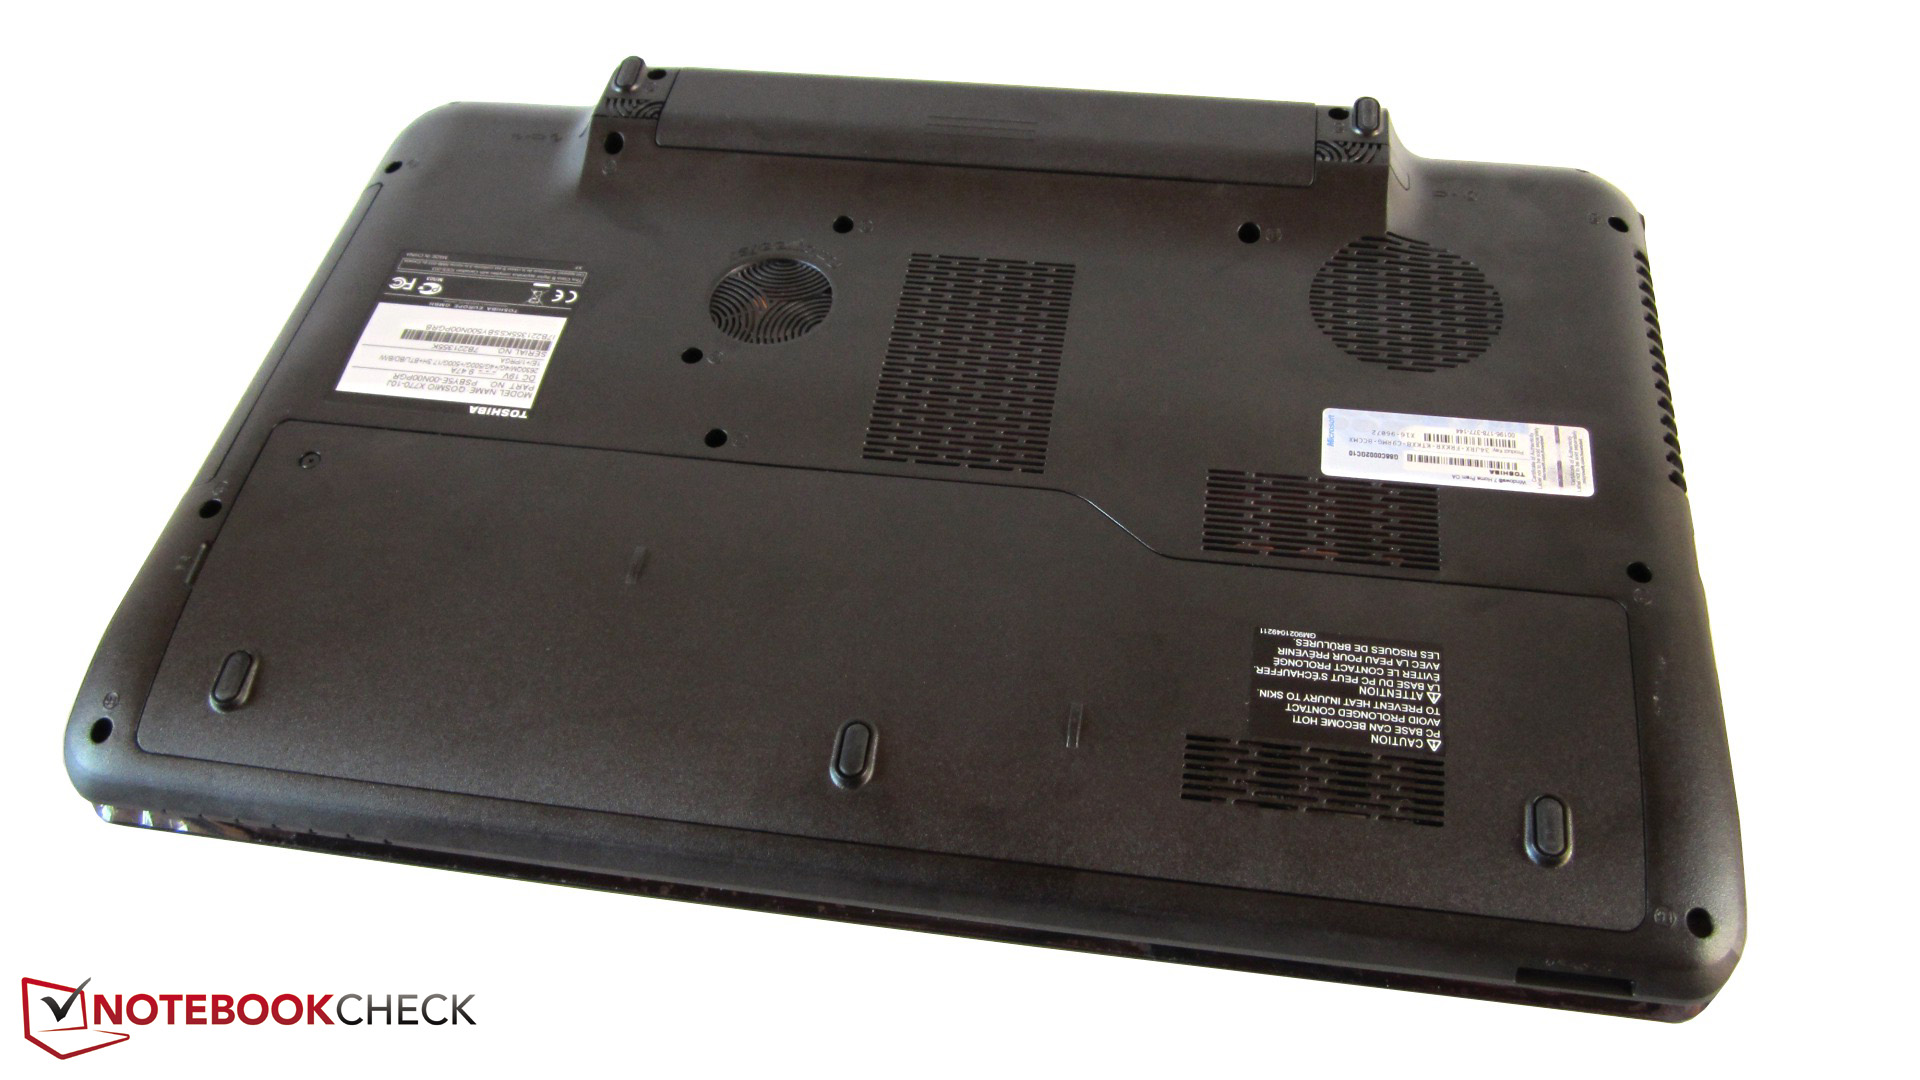
Temperature
The surface temperature of the X770 (while the laptop is idle or in office use) remains in a comfortable region, as shown by the blue temperature diagram. While the laptop is in intense use, the situation does not change much. The bottom of the laptop heats up to 40 degrees and the surface heats up to 41 degrees. The X770-10J with the 2630QM processor behaved more or less the same way, although in that test, the room temperatures were different.
GPU Throttling
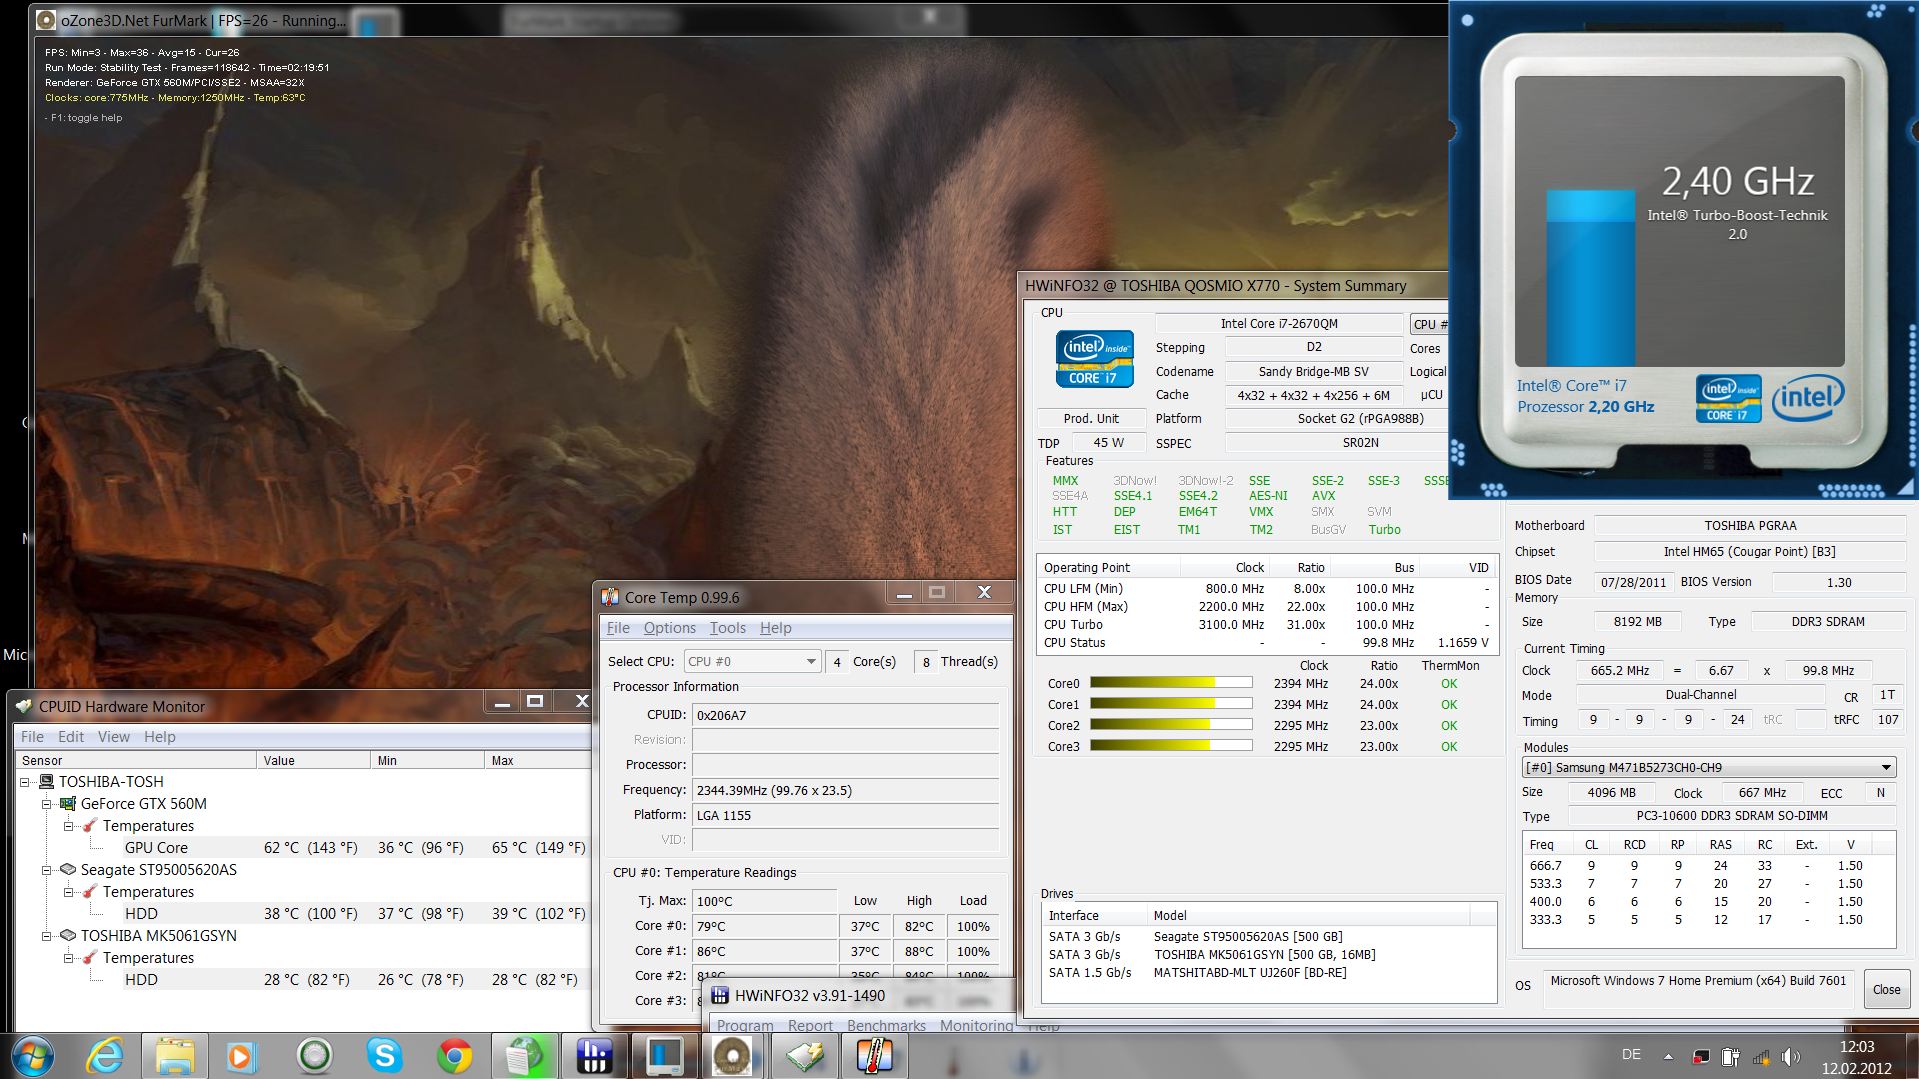
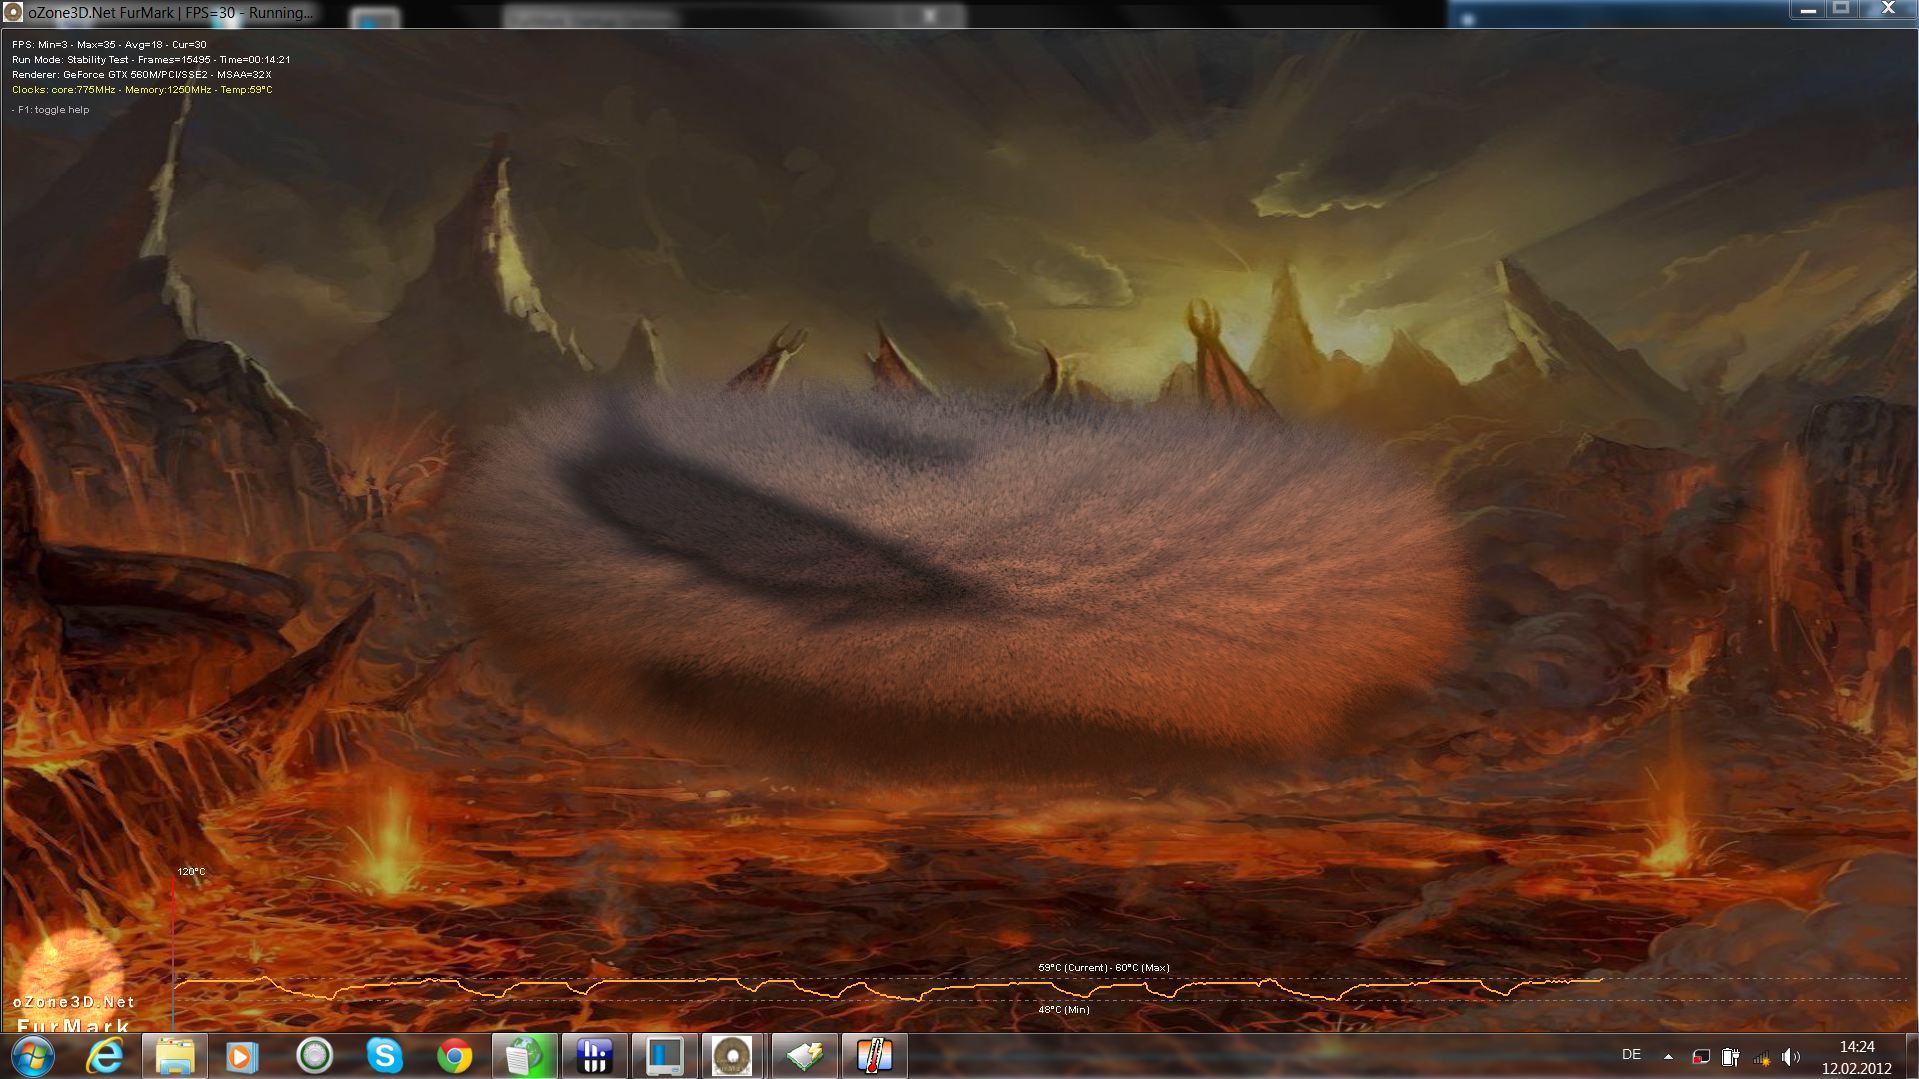
During the stress test (Prime95 + Furmark), the multimeter showed wavering power consumption: from 101 to 162 W. This indicates CPU throttling in most cases, but in this test model the graphic card is at fault. A solo Prime95 CPU stress test showed that the power consumption remained constant at 88 watts. The clock frequency in Cinebench Single and Multi-Core benchmarks stays in the Turbo regions of 2.8 and 3.0 GHz. In contrast, the GPU temperature wavered constantly, even when the Furmark stress test was being run alone. See picture four.
Afraid of how this will affect the gaming performance? The GeForce GTX 560M of our test model performs at the same level as other test models with a GTX 560M (in the synthetic benchmarks). So whether it is the 3DMark 06, Heaven 2.1 or 3D Mark 11, the results are all at the expected level of a GTX 560M. In 3DMark Vantage, the GPU actually performs slightly above average.
This may not be the case with actual games, such as: Battlefield Bad Company 2 (high stress on the CPU). We ran the game on "High" settings and the laptop delivered 70 fps (above average - power consumption constant at 136 W). However, at "Ultra" settings (FHD), the performance drops to 32 FPS. The GTX 560M can deliver 7 to 8% more even with the slower 2630QM (Asus G74SX-3DE). The reason for this drop in performance is that the benchmark simulated explosions near the middle and at that point the power consumption suddenly dropped from 138 to 67 watts (for about 15 seconds), causing the game to stutter significantly.
The reduction in GPU performance with simultaneous CPU load can be tested with benchmarks. We have narrowed the problem down to multi-core stress scenarios. While Prime95 is running, the Cinebench R10 Shading (64 bit) score drops from 5,873 to 2,290 points. A single core SuperPi test does not drop the performance: even with simultaneous stress testing, the score remains at 5,870 points (identical with the solo test).

(±) The maximum temperature on the upper side is 41.3 °C / 106 F, compared to the average of 40.4 °C / 105 F, ranging from 21.2 to 68.8 °C for the class Gaming.
(+) The bottom heats up to a maximum of 37.2 °C / 99 F, compared to the average of 43.3 °C / 110 F
(+) In idle usage, the average temperature for the upper side is 23.7 °C / 75 F, compared to the device average of 33.9 °C / 93 F.
(+) The palmrests and touchpad are reaching skin temperature as a maximum (35.2 °C / 95.4 F) and are therefore not hot.
(-) The average temperature of the palmrest area of similar devices was 28.8 °C / 83.8 F (-6.4 °C / -11.6 F).
Battery Life
Power Consumption
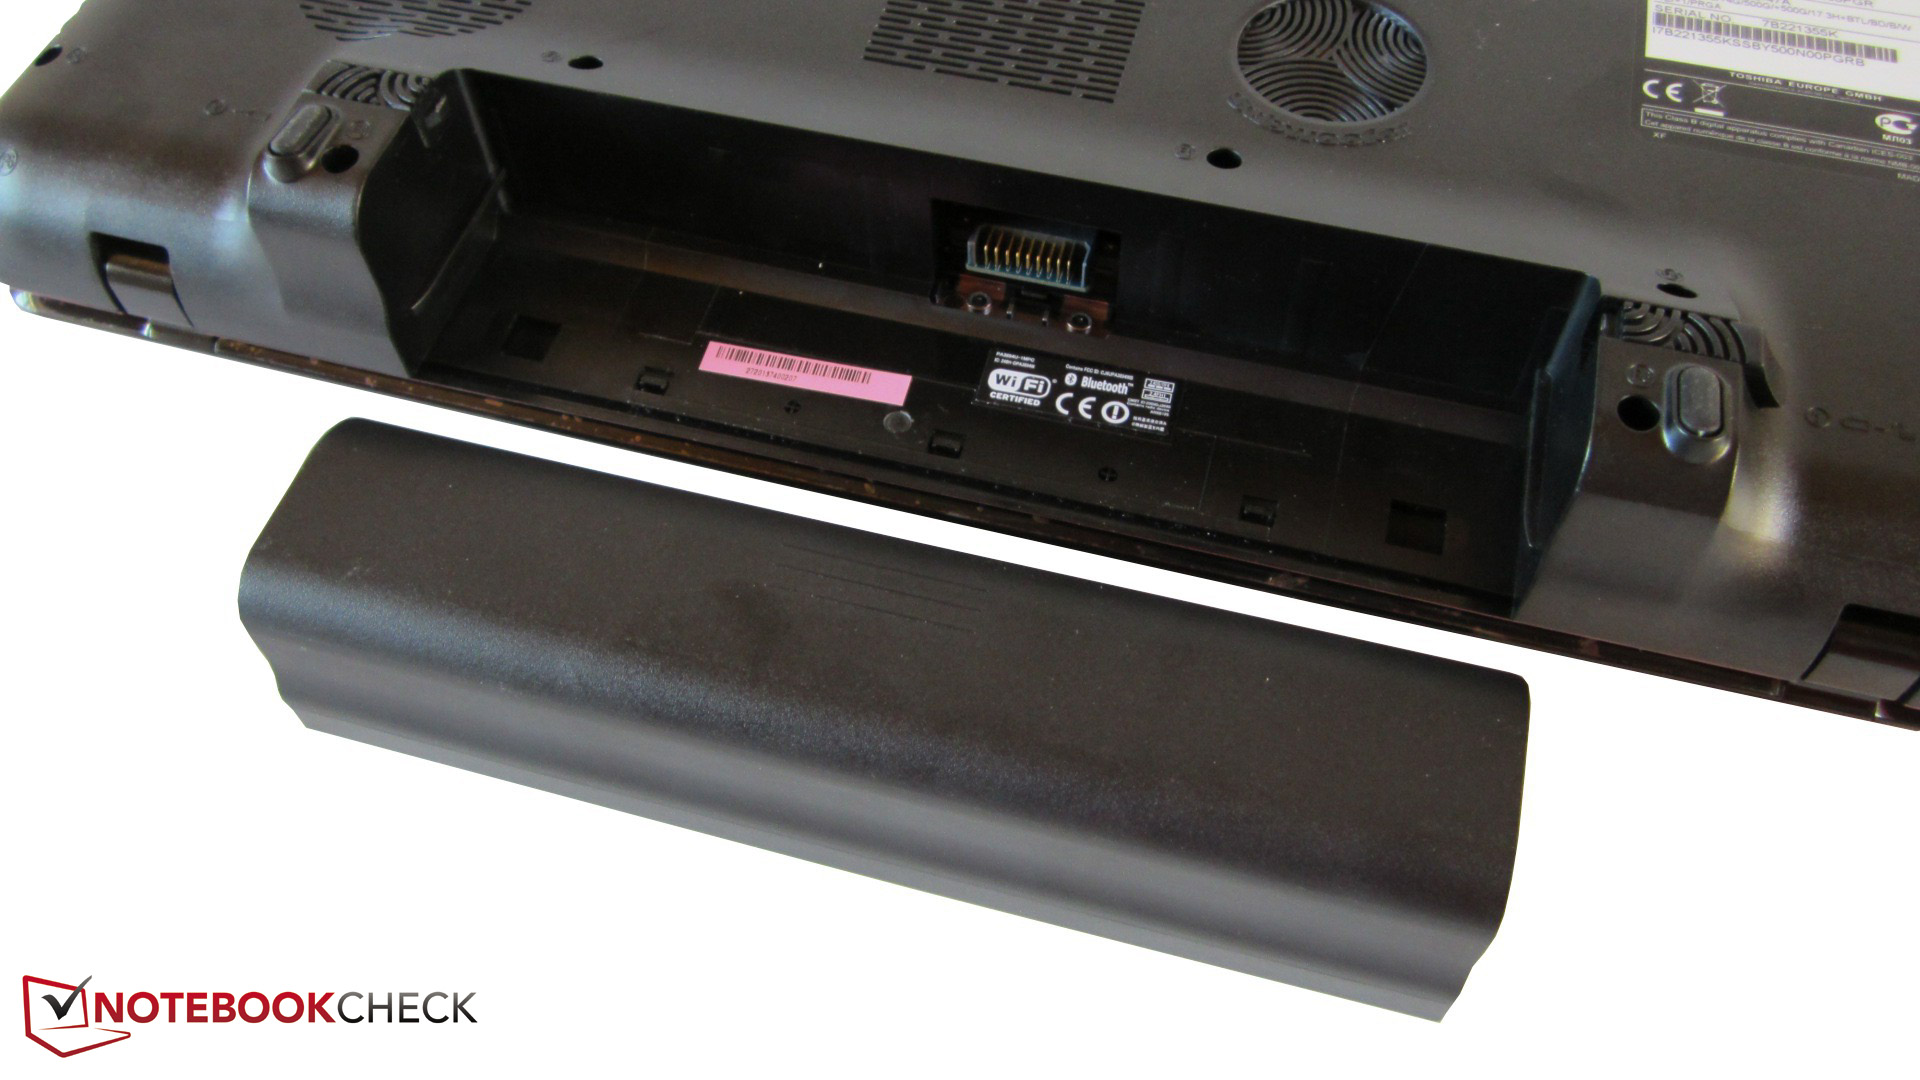
The shorter runtimes are caused by the higher power consumption while idle. Unlike the X770-10J (idle -17 W), the X770-11c consumes 26.6 W while idle ("High Performance" mode). The other idle modes behave identically (20/26 instead of 12/16 watts). The main reason for the higher power consumption seems to be the missing switchable graphics provided by Optimus. An Asus G74SX-91079V with the same GPU and no Optimus needs 27/35/37 watts (Idle Min/Med/Max).
| Off / Standby | |
| Idle | |
| Load |
|
Key:
min: | |
Battery Life
The battery life is a bad surprise. Whereas the X770-10J with Optimus GPU switching can last up to 6 hours while idle (thanks to the Intel IGP), the test model can only last 175 minutes (2:55 hours). The 47 Wh battery is still the same.
Watching a DVD is only possible for 1:32 hours and surfing the web with a brightness of 150 cd/m² (maximum) means 1:35 hours of use. The X770-10J can last 2:14 and 3:06 hours respectively. Charging the battery requires 97 minutes.

Verdict
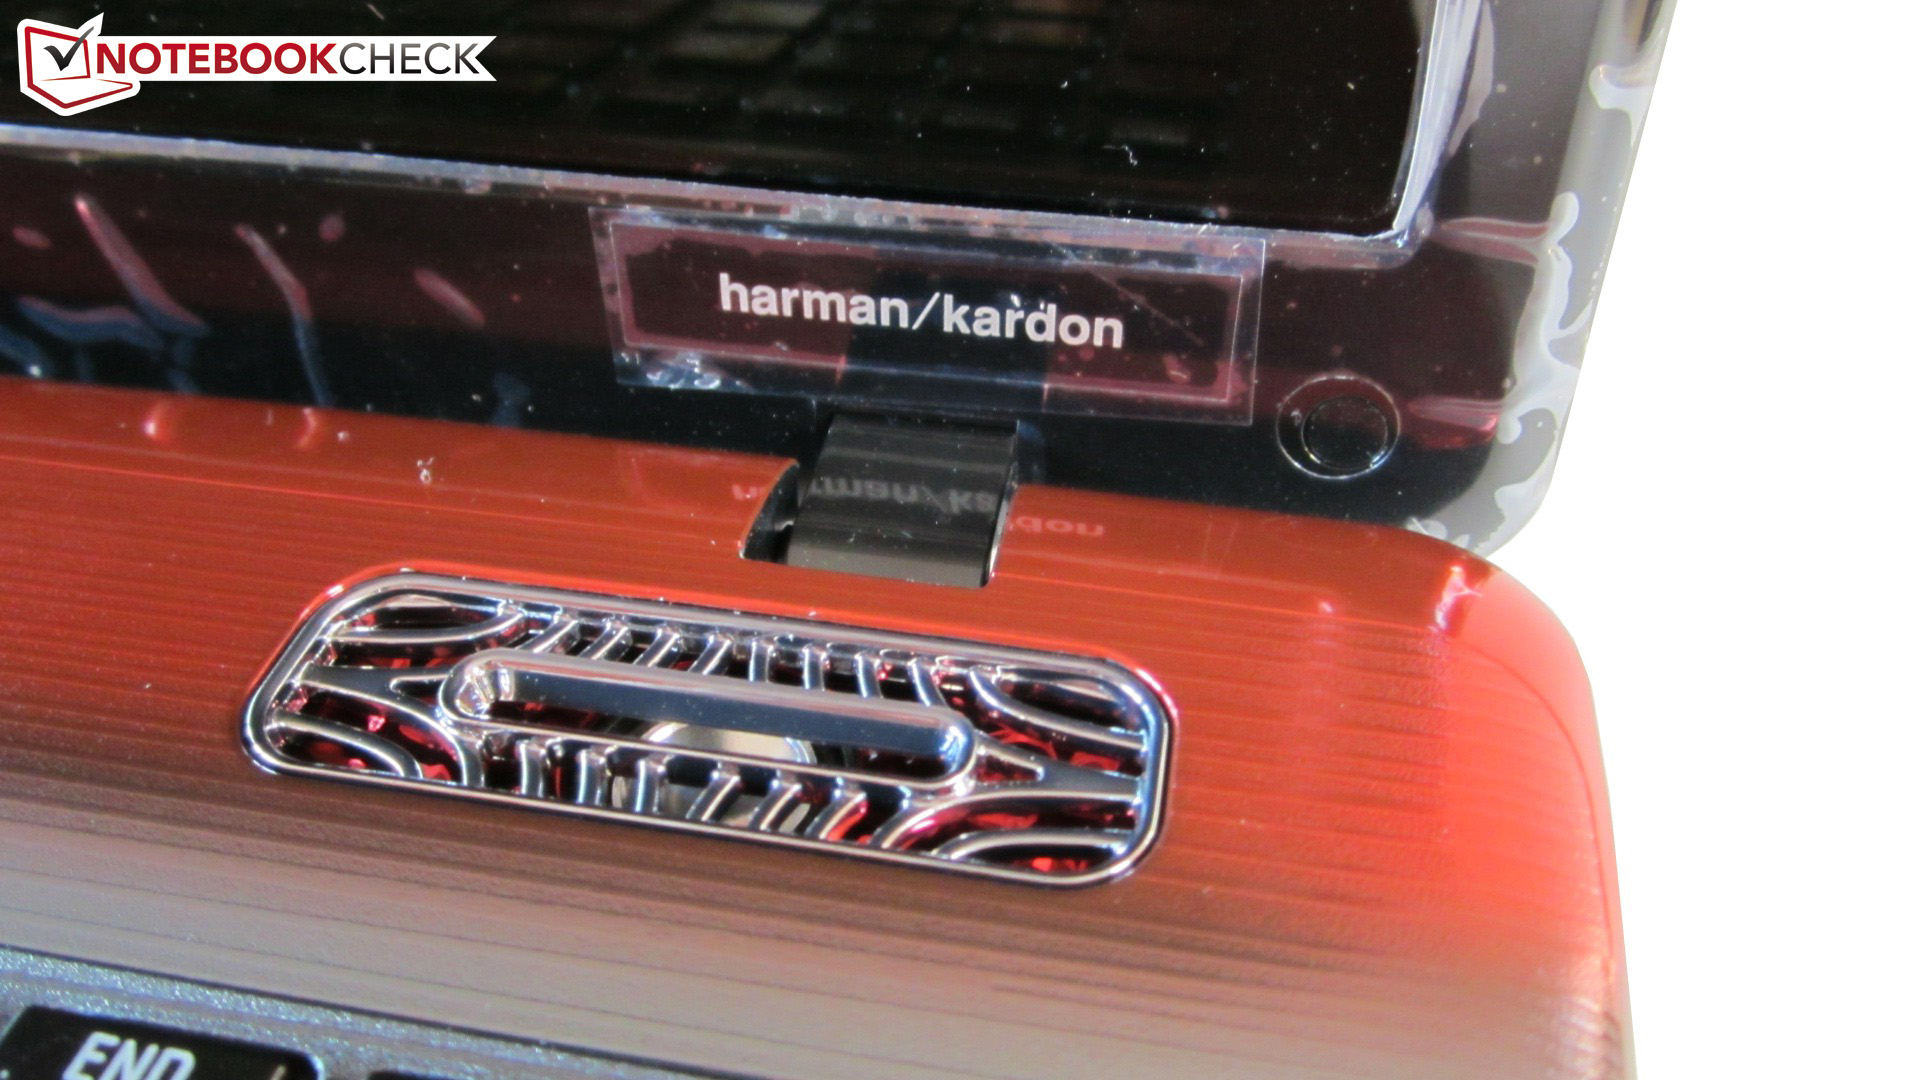
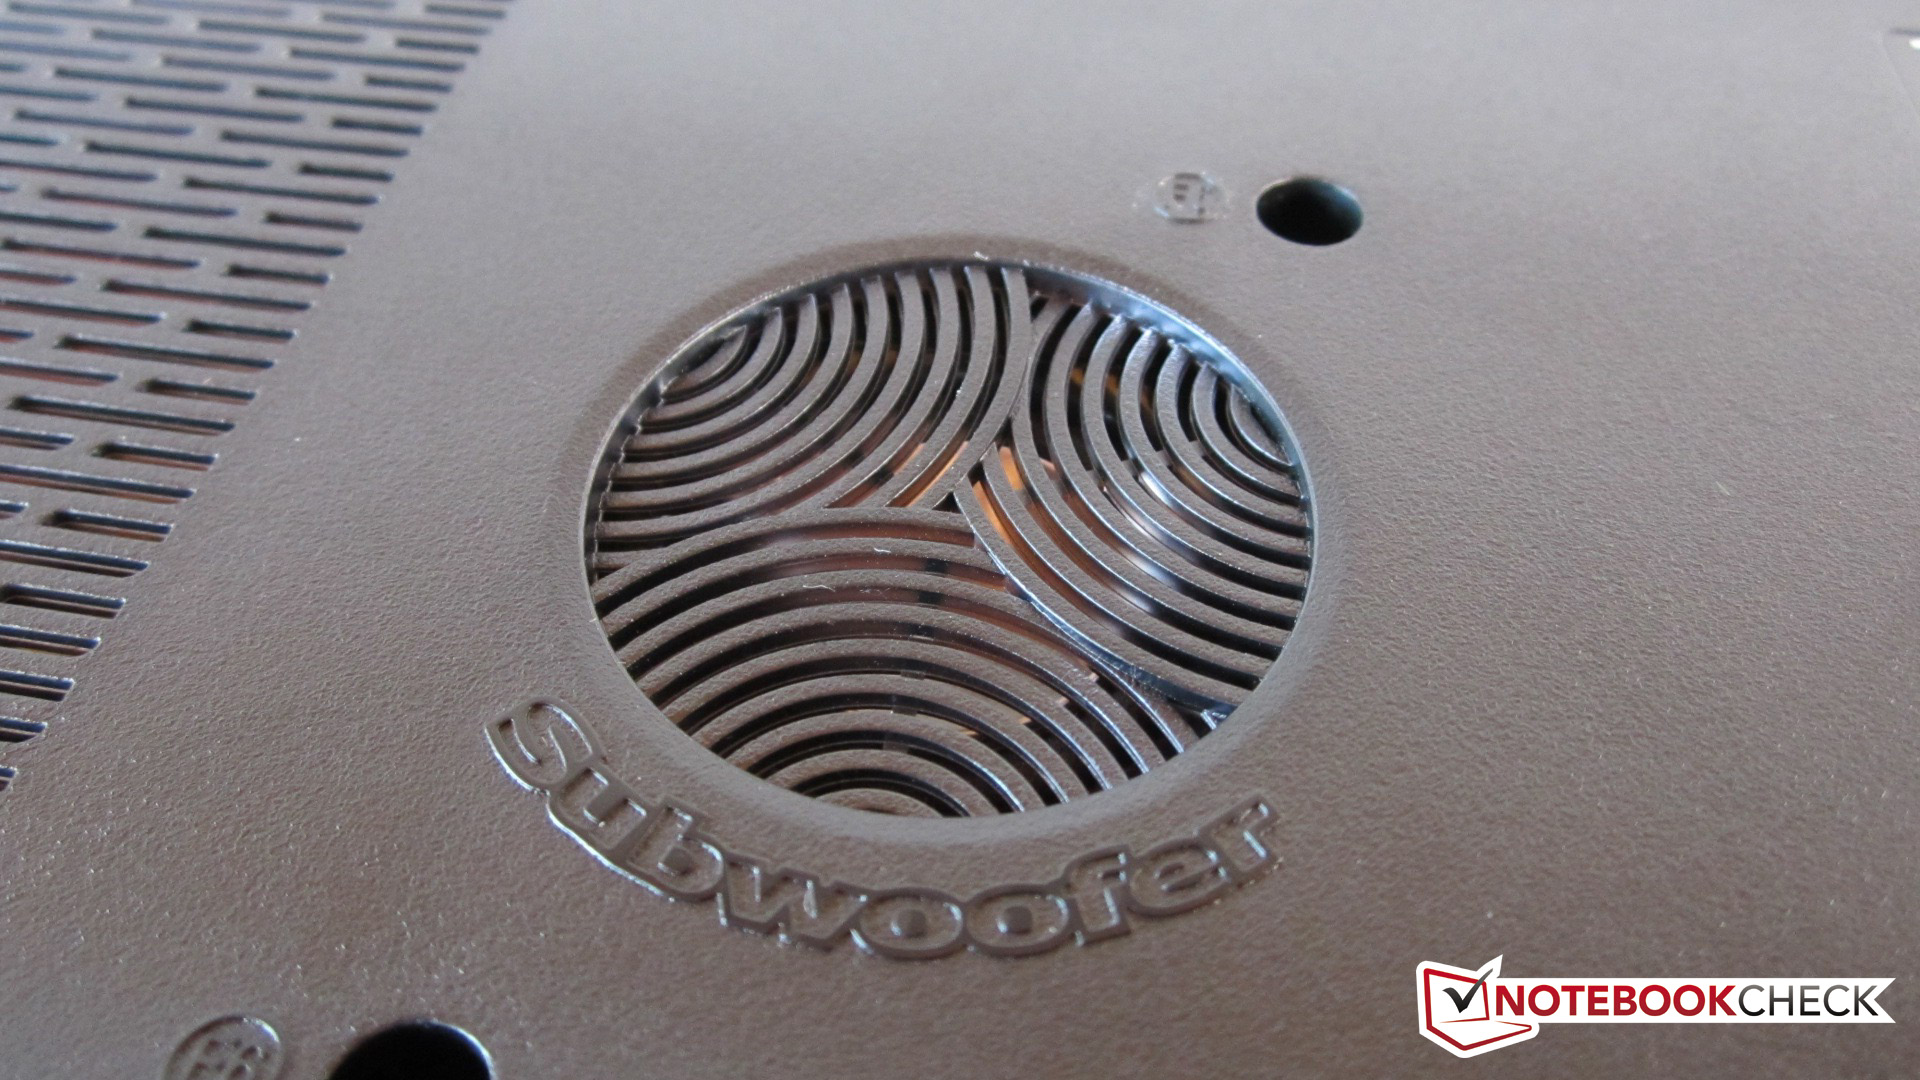
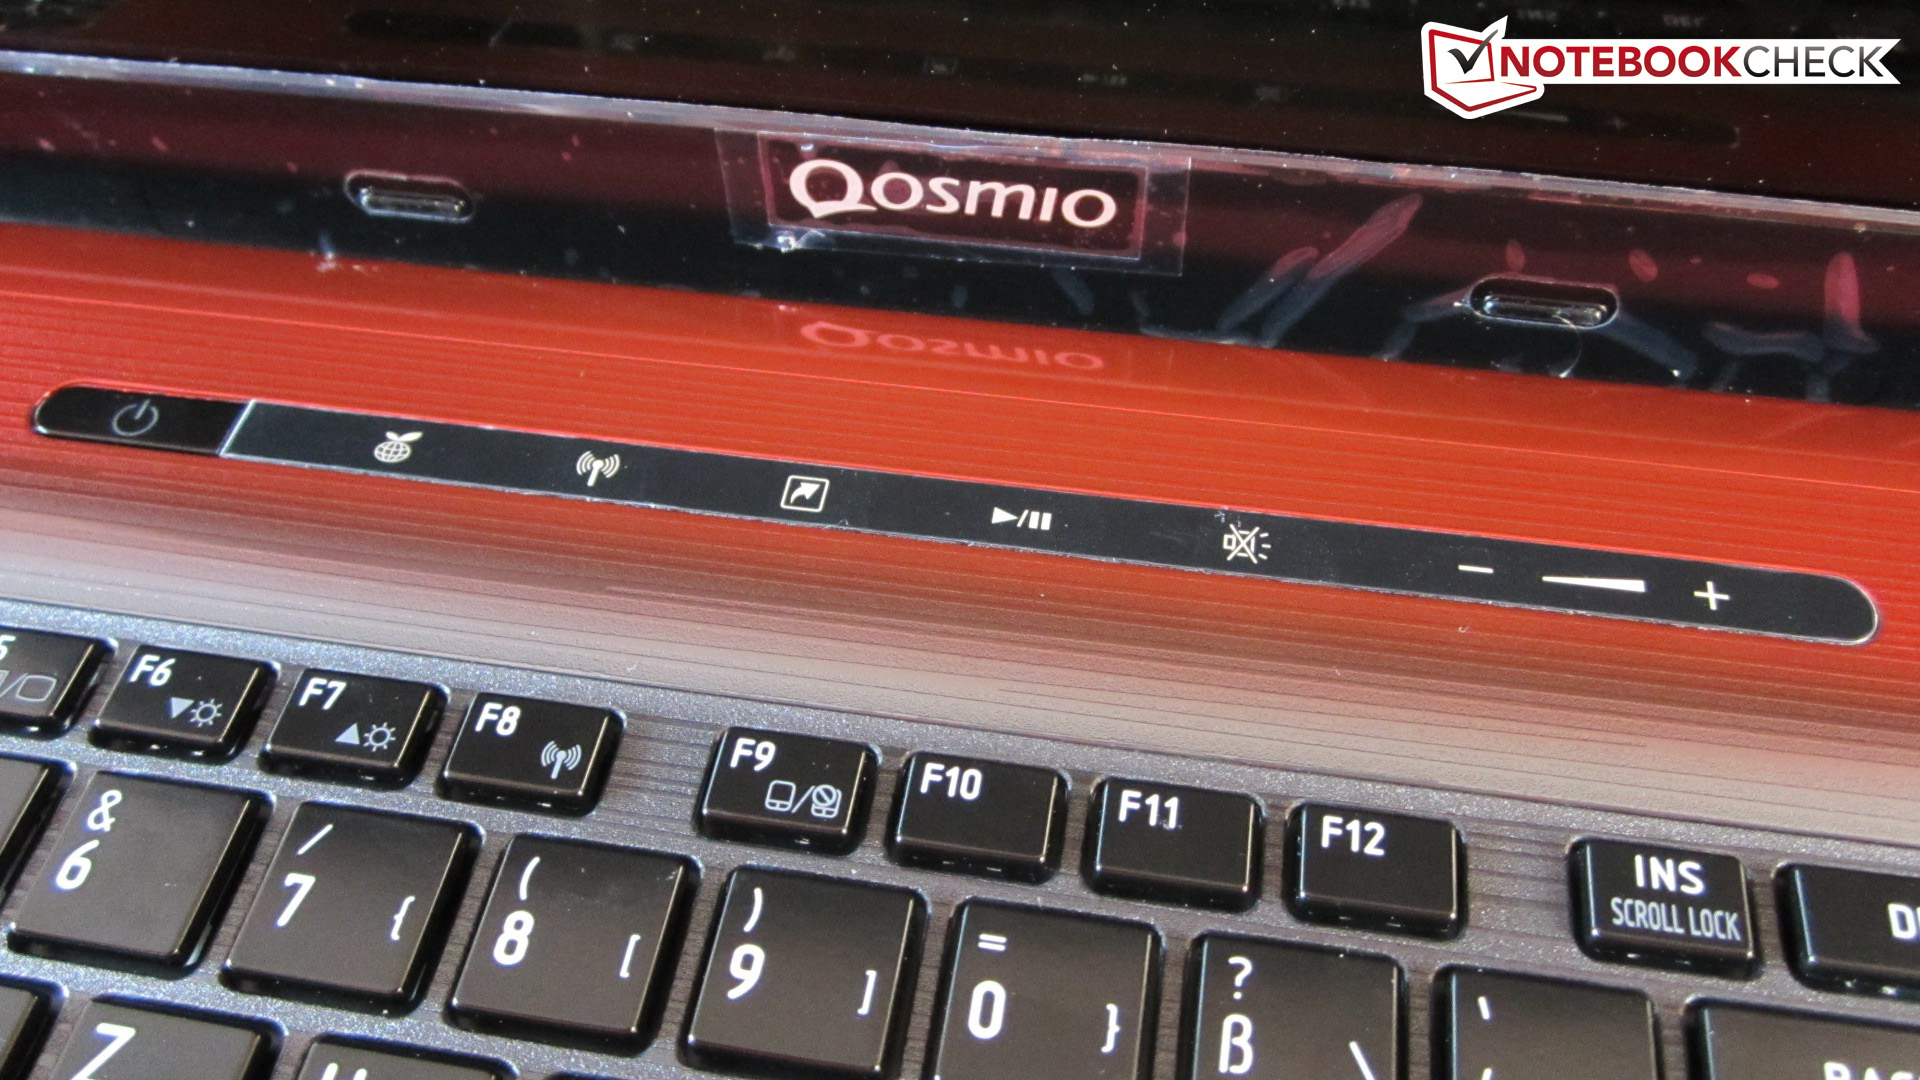
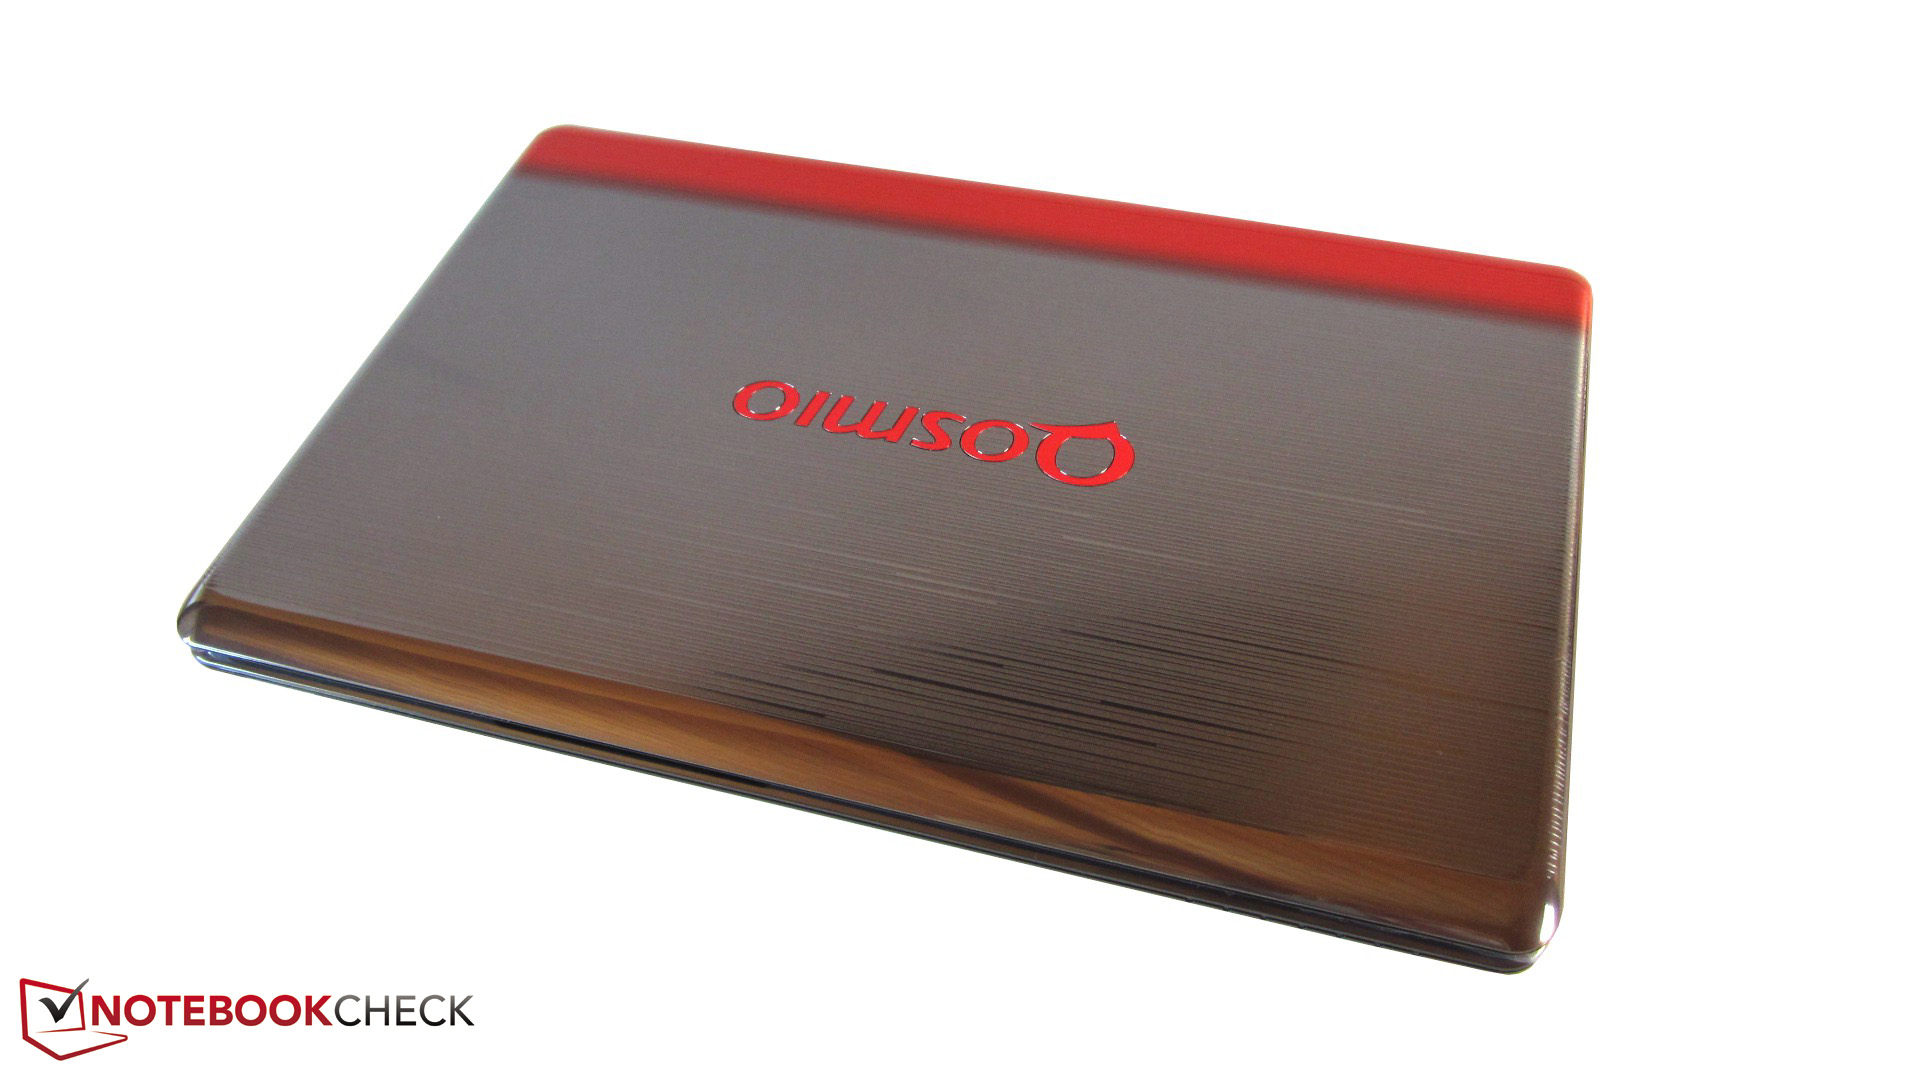
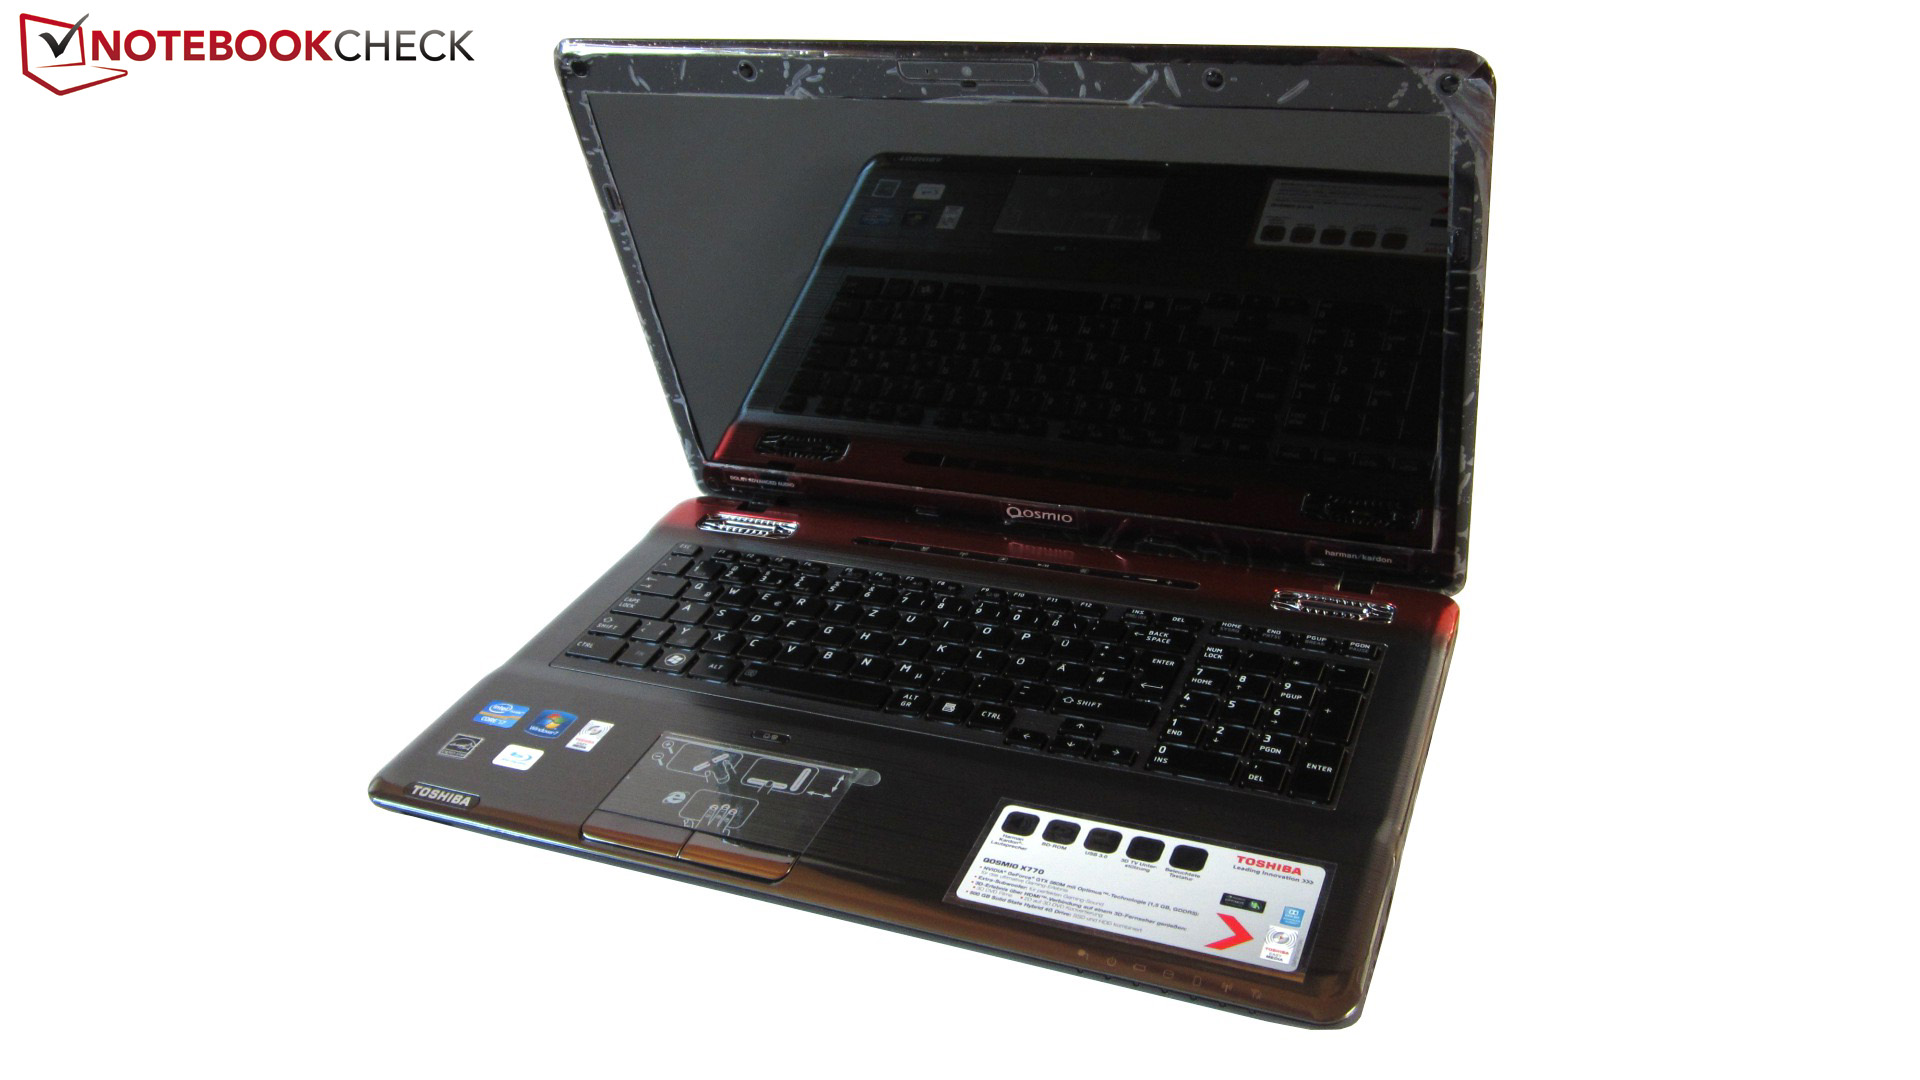
The Toshiba Qosmio X770-11C is a well-designed DTR for gamers and multimedia fans. The first-class sound, red-backlight keyboard, and the great gaming performance are still the same and worthy of praise. We compared our test model, the X770-11C, with the X770-10J (first test model).
The nice additional features (Shutter glasses and 3D display) are shadowed by the shorter battery life which is a direct result of the higher power consumption. The display has been improved (contrast, viewing angles), but as the maximum brightness is quite low, we can not give it full points. Program and gaming performance have risen thanks to the new processor, and we measured higher-than-average scores in the benchmarks. The surface temperatures of the case have also risen.
Overall, our test system gives the Toshiba Qosmio X770-11C a rating of 81%. The first test model without 3D reached 79%. This laptop has a 2% lead as the cons do not affect the laptop's rating much (as it is a DTR laptop). The battery life determines only 3% of the final score, whereas the display (13%), the performance in games (14%) and the program performance (13%) make up most of the rating. The Qosmio has scored well and been improved in the areas which matter for DTRs.
Nvidia's 3D Vision is nothing special nowadays. It is a nice feature, but most gamers are not willing to sacrifice half the frame rates for it. On the other hand, real 3D films can be enjoyed thanks to the active Shutter glasses. Toshiba has placed the second generation Nvidia 3D glasses in the packaging of the laptop. These new glasses have 20% larger glass area and let more light in.