Notebookcheck Logo

unknown vs Intel Atom N450 vs UNISOC Tiger T310

Intel Atom N450

► remove from comparison Intel N450

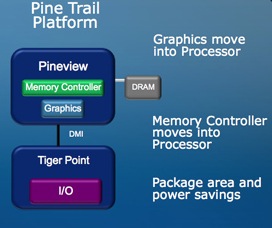
The Intel Atom N450 is a small and cheap entry level CPU for Netbooks and small laptops. In the package is an integrated memory controller for DDR2 main memory and the GMA 3150 graphics card. 

The performance of the whole system (Atom N450 and integrated GMA 3150) is only sufficient for basic tasks like surfing the web, or office working. HD video, video cutting, advanced photo editing, multitasking and of course gaming may overstrain the GPU and CPU. Compared to the previous Atom generation, the performance gain is only marginally above a similar clocked Atom N280 / GMA 950. To decode HD videos in 1080p the N450 / GMA3150 needs the help from a additional chip like the the ION2 or Broadcom video decoder.

An advantage of the interation, is the small overall power consumption of the CPU, GPU and memory controller (only 5.5 Watt TDP). Intel states 20% power reduction and 60% package reduction. Therefore, the chip is ideally used in small Netbooks, MIDs, and thin laptops. Compared to the Z500 series combined with the US15W chipset (2.4+2.3 W), the power consumption is similar.

UNISOC Tiger T310

► remove from comparison  T310

The Unisoc Tiger T310 is a SoC for smartphones and tablets of the entry level. It was first announced in mid 2019 and integrates four CPU cores (quad core). One big Cortex-A75 core clocked at up to 2 GHz and three small A55 cores with up to 1.8 GHz.

Furthermore, the chip integrates an LTE modem (Cat 7, TDD-LTE, FDD-LTE, TDSCDMA, WCDMA, CDMA, GSM), Bluetooth 5.0 and WiFi b/g/n/ac. The integrated ISP supports up to two cameras (16 MPixel and 8 Mpixel, maximum 30 fps video capture) and the GNSS can use all current standards (GPS, Glonass, Beidou, Galileo).

The memory controller is able to drive LPDDR3 at 933 MHz and faster LPDDR4x at 1333 MHz.

The PowerVR GE8300 iGPU is from Imagination and clocked at up to 800 MHz.

The chip is produced in 12nm at TSMC and should offer a rather good power efficiency (for 2019).

ModelunknownIntel Atom N450UNISOC Tiger T310
Series Intel Atom
Series:
newitem cores
HiSilicon Kirin 9000W1.53 - 2.49 GHz12 / 12 cores
UNISOC Tiger T3101.8 - 2 GHz4 / 4 cores
Rockchip RK32881.8 GHz4 / 4 cores
Apple A6x1.4 GHzcores
Apple A61 GHzcores
Apple S52 / 2 cores
HiSilicon k3v2 Hi36201.2 GHz4 / 4 cores
Rockchip RK3066 1.5 GHz1.5 GHz2 / 2 cores
Amlogic AML8726-MX1.5 GHz2 / 2 cores
Rockchip RK31681.2 GHz2 / 2 cores
Rockchip RK2918 1.2 GHz1.2 GHz1 / 1 cores
ARM Cortex A8 1.2 GHz1.2 GHz1 / 1 cores
Telechips TCC8803 1GHz1 GHz1 / 1 cores
Loongson 2F 900MHz0.9 GHz1 / 1 cores
CSR86700.08 GHzcores
ARM Cortex-M4 cores
HiSilicon Hi6262 cores
DK3.5+STcores
unknown «  cores
Intel Atom D5251.8 GHz2 / 4 cores
Intel Atom N4551.66 GHz1 / 2 cores
Intel Atom N450 « 1.66 GHz1 / 2 cores
Intel Atom N4351.33 GHz1 / 2 cores
newitem cores
HiSilicon Kirin 9000W1.53 - 2.49 GHz12 / 12 cores
UNISOC Tiger T310 « 1.8 - 2 GHz4 / 4 cores
Rockchip RK32881.8 GHz4 / 4 cores
Apple A6x1.4 GHzcores
Apple A61 GHzcores
Apple S52 / 2 cores
HiSilicon k3v2 Hi36201.2 GHz4 / 4 cores
Rockchip RK3066 1.5 GHz1.5 GHz2 / 2 cores
Amlogic AML8726-MX1.5 GHz2 / 2 cores
Rockchip RK31681.2 GHz2 / 2 cores
Rockchip RK2918 1.2 GHz1.2 GHz1 / 1 cores
ARM Cortex A8 1.2 GHz1.2 GHz1 / 1 cores
Telechips TCC8803 1GHz1 GHz1 / 1 cores
Loongson 2F 900MHz0.9 GHz1 / 1 cores
CSR86700.08 GHzcores
ARM Cortex-M4 cores
HiSilicon Hi6262 cores
DK3.5+STcores
unknown cores
Architecturex86x86ARM
CodenamePinetrail
Clock1660 MHz1800 - 2000 MHz
FSB533
L2 Cache512 KB
Cores / Threads1 / 24 / 4
TDP5.5 Watt
Transistors123 Million
Technology45 nm, 0.8-1.175V12 nm
Die Size66 mm2
max. Temp.100 °C
SocketFCBGA559
Featuresintegrated DDR2 (667 MHz) memory controller, integrated GMA 3150 GPU, Hyperthreading, SSE2, SSE3, SSSE3, Intel 64, Enhanced Speedstep, Execute Disable BitLTE Cat.7, BT 5.0, WiFi ac, GNSS, eMMC 5.1, LPDDR3 933, LPDDR4x 1333 MHz
$64 U.S.
Announced
Manufacturerark.intel.comwww.unisoc.com
iGPUPowerVR GE8300 ( - 800 MHz)

Benchmarks

Cinebench R15 - Cinebench R15 CPU Multi 64 Bit
100%
1 unknown +
min: 1029     avg: 1038     median: 1038 (7%)     max: 1047 Points
Cinebench R11.5 - Cinebench R11.5 CPU Multi 64 Bit
100%
1 N450 +
min: 0.23     avg: 0.2     median: 0.2 (0%)     max: 0.24 Points
Cinebench R10 - Cinebench R10 Rend. Single (32bit)
100%
1 N450 +
min: 457     avg: 553     median: 560 (3%)     max: 589 Points
Cinebench R10 - Cinebench R10 Rend. Multi (32bit)
100%
1 N450 +
min: 741     avg: 861     median: 865 (1%)     max: 938 Points
wPrime 2.10 - wPrime 2.0 1024m *
100%
1 N450 +
min: 3252     avg: 3766     median: 3719 (44%)     max: 5166 s
wPrime 2.10 - wPrime 2.0 32m *
100%
1 N450 +
min: 115.8     avg: 120.7     median: 117 (24%)     max: 161.7 s
PCMark 05 - PCMark 05 - Standard
100%
1 N450 +
min: 1270     avg: 1349     median: 1340 (3%)     max: 1444 Points
3DMark Vantage - 3DM Vant. Perf. CPU no Physx
100%
1 N450 +
813 Points (1%)
3DMark - 3DMark Ice Storm Unlimited Physics
100%
1 unknown +
37732 Points (32%)
3DMark - 3DMark Cloud Gate Physics
100%
1 unknown +
8923 Points (23%)
3DMark - 3DMark Time Spy CPU
100%
1 unknown +
5039 Points (21%)
3DMark - 3DMark Sling Shot Extreme (ES 3.1) Unlimited Physics
100%
1 unknown +
min: 3612     avg: 4808     median: 4807.5 (57%)     max: 6003 Points
33%
1 T310 +
1588 Points (19%)
3DMark - 3DMark Sling Shot (ES 3.0) Unlimited Physics
100%
1 T310 +
1590 Points (18%)
Geekbench 6.2 - Geekbench 6.2 Single-Core
100%
1 unknown +
min: 920     avg: 1183     median: 1183 (32%)     max: 1446 Points
Geekbench 6.2 - Geekbench 6.2 Multi-Core
100%
1 unknown +
min: 2252     avg: 3368     median: 3368 (13%)     max: 4484 Points
Geekbench 5.5 - Geekbench 5.1 - 5.4 64 Bit Single-Core
100%
1 unknown +
min: 687     avg: 887     median: 887 (37%)     max: 1087 Points
42%
1 T310 +
376 Points (16%)
Geekbench 5.5 - Geekbench 5.1 - 5.4 64 Bit Multi-Core
100%
1 unknown +
min: 2071     avg: 3146     median: 3146 (6%)     max: 4221 Points
24%
1 T310 +
756 Points (1%)
Geekbench 4.4 - Geekbench 4.1 - 4.4 64 Bit Single-Core
100%
1 unknown +
min: 3175     avg: 4274     median: 4788 (48%)     max: 4860 Points
35%
1 T310 +
1687 Points (17%)
Geekbench 4.4 - Geekbench 4.1 - 4.4 64 Bit Multi-Core
100%
1 unknown +
min: 8143     avg: 12683     median: 14710 (16%)     max: 15196 Points
20%
1 T310 +
2969 Points (3%)
Geekbench 3 - Geekbench 3 64 Bit Multi-Core
100%
1 T310 +
2987 Points (5%)
Geekbench 3 - Geekbench 3 64 Bit Single-Core
100%
1 T310 +
1656 Points (25%)
Linpack Android / IOS - Linpack Multi Thread
100%
1 unknown +
13 MFLOPS (0%)
Linpack Android / IOS - Linpack Single Thread
100%
1 unknown +
12.8 MFLOPS (1%)
Mozilla Kraken 1.1 - Kraken 1.1 Total Score *
100%
1 unknown +
min: 779.1     avg: 5662     median: 1253.9 (1%)     max: 14953 ms
98%
1 T310 +
3239 ms (4%)
Sunspider - Sunspider 0.9.1 Total Score *
100%
1 unknown +
7004 ms (66%)
Octane V2 - Octane V2 Total Score
100%
1 unknown +
min: 2672     avg: 21642     median: 17303 (16%)     max: 49290 Points
69%
1 T310 +
11986 Points (11%)
WebXPRT 4 - WebXPRT 4 Score
0 Points (0%)
100%
1 T310 +
45 Points (13%)
WebXPRT 3 - WebXPRT 3 Score
0 Points (0%)
100%
1 T310 +
63 Points (13%)
Antutu v9 - AnTuTu v9 Total Score
100%
1 T310 +
162595 Points (10%)
Antutu v9 - AnTuTu v9 CPU
100%
1 T310 +
57138 Points (16%)
PassMark PerformanceTest Mobile V1 - PerformanceTest Mobile V1 CPU Tests
100%
1 T310 +
1653 Points (0%)
PCMark for Android - PCM f. Android Storage 2.0 random write internal
100%
1 unknown +
37 MB/s (27%)
PCMark for Android - PCM f. Android Storage 2.0 seq write internal
100%
1 unknown +
587 MB/s (18%)
PCMark for Android - PCM f. Android Storage 2.0 random read internal
100%
1 unknown +
18.7 MB/s (23%)
PCMark for Android - PCM f. Android Storage 2.0 seq read internal
100%
1 unknown +
712 MB/s (20%)
PCMark for Android - PCM f. Android Storage 2.0 score
100%
1 unknown +
21410 Points (34%)
46%
1 T310 +
9900 Points (16%)
PCMark for Android - PCM f. Android Work Score 3.0
100%
1 unknown +
13575 Points (63%)
51%
1 T310 +
6866 Points (32%)
CrossMark - CrossMark Overall
100%
1 unknown +
min: 598     avg: 815     median: 814.5 (31%)     max: 1031 Points
Power Consumption - Geekbench 5.5 Power Consumption 150cd *
100%
1 T310 +
3.7 Watt (2%)
Power Consumption - Idle Power Consumption 150cd 1min *
100%
1 T310 +
1.6 Watt (2%)

Average Benchmarks unknown → 0% n=

Average Benchmarks Intel Atom N450 → 0% n=

Average Benchmarks UNISOC Tiger T310 → 0% n=

- Range of benchmark values for this graphics card
- Average benchmark values for this graphics card
* Smaller numbers mean a higher performance
1 This benchmark is not used for the average calculation

v1.27
log 08. 04:31:52

#0 checking url part for id 1859 +0s ... 0s

#1 checking url part for id 539 +0s ... 0s

#2 checking url part for id 14530 +0s ... 0s

#3 not redirecting to Ajax server +0s ... 0s

#4 did not recreate cache, as it is less than 5 days old! Created at Fri, 07 Jun 2024 05:41:01 +0200 +0.001s ... 0.001s

#5 composed specs +0.115s ... 0.116s

#6 did output specs +0s ... 0.116s

#7 getting avg benchmarks for device 1859 +0.003s ... 0.119s

#8 got single benchmarks 1859 +0.547s ... 0.665s

#9 getting avg benchmarks for device 539 +0.004s ... 0.669s

#10 got single benchmarks 539 +0.119s ... 0.788s

#11 getting avg benchmarks for device 14530 +0.003s ... 0.791s

#12 got single benchmarks 14530 +0.01s ... 0.801s

#13 got avg benchmarks for devices +0s ... 0.801s

#14 No cached benchmark found, getting uncached values +0.203s ... 1.005s

#15 No cached benchmark found, getting uncached values +0.006s ... 1.011s

#16 min, max, avg, median took s +0.045s ... 1.056s

#17 return log +0s ... 1.056s

Please share our article, every link counts!
> Expert Reviews and News on Laptops, Smartphones and Tech Innovations > Benchmarks / Tech > Processor Comparison - Head 2 Head
Redaktion, 2017-09- 8 (Update: 2023-07- 1)