Notebookcheck Logo

unknown vs HiSilicon Kirin 659 vs HiSilicon Kirin 9000W

HiSilicon Kirin 659

► remove from comparison  Kirin 659

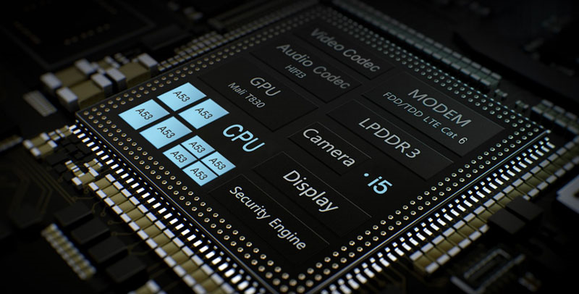
The HiSilicon Kirin 659 is an ARM-based octa-core SoC for mid-range smartphones and tablets. It was announced mid 2017 and features eight ARM Cortex-A53 cores. Four cores can be clocked with up to 1.7 GHz (power saving cores) and four with up to 2.36 GHz (performance cores). The difference to the older Kirin 650 and Kirin 655 SoCs is the higher clock speed of the performance cores (2.35 versus 2.1 and 2.0 GHz). The slightly older Kirin 658 is very similar. The 659 is in our benchmarks around 4% faster than the 658 and offers a better LTE radio (Cat. 13).

Furthermore, a ARM Mali-T830 MP2 graphics card (at >=900 MHz), a 64-Bit LPDDR3 memory controller and a dual-sim capable LTE Cat. 6 (max. 300 MBit/s and GSM, WCDMA, UMTS, HSPA+) radio are integrated in the SoC. The processor performance can be compared with the older Kirin 930 and therefore sufficient for daily usage as browsing and non demanding apps. High-end SoCs with Cortex-A57 or A72 cores however should be noticeably faster. The SoC is produced in a modern 16nm FinFET process and is therefore very power efficient.

HiSilicon Kirin 9000W

► remove from comparison  Kirin 9000W

The HiSilicon Kirin 9000W is an SoC that can be used in smartphones and tablets based on Android and was first installed in the Huawei MatePad Pro 13.2.

Huawei does not reveal any information about the SoC. The little information that is available comes from benchmarks and system analysis tools. The CPU consists of three clusters with a total of 12 cores. The power-saving cluster has four ARM Cortex-A510 cores, each operating at up to 1,530 MHz, while six other cores use unspecified cores from HiSilicon (0x0D42) and clock at up to 2,150 MHz. The third cluster contains two HiSilicon cores (0x0D02), each with a maximum clock speed of 2,487 MHz. The performance cores could possibly be based on the TaiShan V120 architecture (as in the Kirin 9000S).

The single-core performance is correspondingly mixed, but the multi-core performance is at the level of a high-end SoC from 2022 due to the numerous cores.

A Maleoon 910 by HiSilicon is integrated as the graphics unit, similar to the 9000S (where it was clocked with up to 750MHz).

Nothing concrete is known about the manufacturing process or the architecture. The SoC will probably be manufactured in 7 nm at SMIC.

ModelunknownHiSilicon Kirin 659HiSilicon Kirin 9000W
Series
Series:
HiSilicon Kirin 9000W1.53 - 2.49 GHz12 / 12 cores
UNISOC Tiger T3101.8 - 2 GHz4 / 4 cores
Rockchip RK32881.8 GHz4 / 4 cores
Apple A6x1.4 GHzcores
Apple A61 GHzcores
Apple S52 / 2 cores
HiSilicon k3v2 Hi36201.2 GHz4 / 4 cores
Rockchip RK3066 1.5 GHz1.5 GHz2 / 2 cores
Amlogic AML8726-MX1.5 GHz2 / 2 cores
Rockchip RK31681.2 GHz2 / 2 cores
Rockchip RK2918 1.2 GHz1.2 GHz1 / 1 cores
ARM Cortex A8 1.2 GHz1.2 GHz1 / 1 cores
Telechips TCC8803 1GHz1 GHz1 / 1 cores
Loongson 2F 900MHz0.9 GHz1 / 1 cores
CSR86700.08 GHzcores
ARM Cortex-M4 cores
HiSilicon Hi6262 cores
DK3.5+STcores
unknown «  cores
JLQ JR5101.5 - 2 GHz8 / 8 cores Cortex-A53
HiSilicon Kirin 9352.2 GHz8 / 8 cores Cortex-A53
HiSilicon Kirin 659 « 2.36 GHz8 / 8 cores Cortex-A53
HiSilicon Kirin 6582.35 GHz8 / 8 cores Cortex-A53
HiSilicon Kirin 6552.1 GHz8 / 8 cores Cortex-A53
HiSilicon Kirin 6502 GHz8 / 8 cores Cortex-A53
HiSilicon Kirin 9302 GHz8 / 8 cores Cortex-A53
HiSilicon Kirin 6201.2 GHz8 / 8 cores Cortex-A53
MediaTek MT8163 V/A 1.5 GHz1.5 GHz4 / 4 cores Cortex-A53
MediaTek MT8163 V/B 1.3 GHz1.3 GHz4 / 4 cores Cortex-A53
MediaTek MT81611.3 GHz4 / 4 cores Cortex-A53
Marvell Armada PXA19081.2 GHz4 / 4 cores Cortex-A53
HiSilicon Kirin 9000W « 1.53 - 2.49 GHz12 / 12 cores
UNISOC Tiger T3101.8 - 2 GHz4 / 4 cores
Rockchip RK32881.8 GHz4 / 4 cores
Apple A6x1.4 GHzcores
Apple A61 GHzcores
Apple S52 / 2 cores
HiSilicon k3v2 Hi36201.2 GHz4 / 4 cores
Rockchip RK3066 1.5 GHz1.5 GHz2 / 2 cores
Amlogic AML8726-MX1.5 GHz2 / 2 cores
Rockchip RK31681.2 GHz2 / 2 cores
Rockchip RK2918 1.2 GHz1.2 GHz1 / 1 cores
ARM Cortex A8 1.2 GHz1.2 GHz1 / 1 cores
Telechips TCC8803 1GHz1 GHz1 / 1 cores
Loongson 2F 900MHz0.9 GHz1 / 1 cores
CSR86700.08 GHzcores
ARM Cortex-M4 cores
HiSilicon Hi6262 cores
DK3.5+STcores
unknown cores
Architecturex86ARMARM
CodenameCortex-A53
Clock2360 MHz1530 - 2490 MHz
Cores / Threads8 / 812 / 12
2 x 2.5 GHz
6 x 2.2 GHz
4 x 1.5 GHz ARM Cortex-A510
Technology16 nm7 nm
FeaturesARMv8-ISA, Mali-T830 MP2, Dual SIM LTE (Cat. 6), LPDDR3 Memory Controller
iGPUARM Mali-T830 MP2HiSilicon Maleoon 910
Announced

Benchmarks

Cinebench R15 - Cinebench R15 CPU Multi 64 Bit
100%
1 unknown +
min: 1029     avg: 1038     median: 1038 (7%)     max: 1047 Points
3DMark - 3DMark Ice Storm Extreme Physics
12599 Points (10%)
3DMark - 3DMark Ice Storm Unlimited Physics
100%
1 unknown +
37732 Points (32%)
3DMark - 3DMark Cloud Gate Physics
100%
1 unknown +
8923 Points (23%)
3DMark - 3DMark Time Spy CPU
100%
1 unknown +
5039 Points (21%)
3DMark - 3DMark Sling Shot Extreme (ES 3.1) Unlimited Physics
min: 1632     avg: 1675     median: 1685 (20%)     max: 1717 Points
5690 Points (67%)
3DMark - 3DMark Sling Shot (ES 3.0) Unlimited Physics
min: 1354     avg: 1625     median: 1685 (19%)     max: 1741 Points
5614 Points (64%)
Geekbench 6.2 - Geekbench 6.2 Single-Core
1174 Points (36%)
Geekbench 6.2 - Geekbench 6.2 Multi-Core
4088 Points (16%)
Geekbench 5.5 - Geekbench 5.1 - 5.4 64 Bit Single-Core
867 Points (37%)
Geekbench 5.5 - Geekbench 5.1 - 5.4 64 Bit Multi-Core
3878 Points (7%)
Geekbench 4.4 - Geekbench 4.1 - 4.4 64 Bit Single-Core
min: 869     avg: 919     median: 926.5 (9%)     max: 946 Points
4712 Points (47%)
Geekbench 4.4 - Geekbench 4.1 - 4.4 64 Bit Multi-Core
min: 3316     avg: 3608     median: 3680.5 (4%)     max: 3805 Points
13978 Points (16%)
Geekbench 4.0 - Geekbench 4.0 64 Bit Single-Core
min: 887     avg: 888     median: 888 (12%)     max: 889 Points
Geekbench 4.0 - Geekbench 4.0 64 Bit Multi-Core
min: 3438     avg: 3473     median: 3473 (8%)     max: 3508 Points
Geekbench 3 - Geekbench 3 64 Bit Multi-Core
3508 Points (5%)
Geekbench 3 - Geekbench 3 64 Bit Single-Core
876 Points (13%)
Geekbench 2 - 32 Bit - Geekbench Stream
968 Points (8%)
Geekbench 2 - 32 Bit - Geekbench Memory
2829 Points (26%)
Geekbench 2 - 32 Bit - Geekbench Floating Point
5944 Points (12%)
Geekbench 2 - 32 Bit - Geekbench Integer
3298 Points (7%)
Geekbench 2 - 32 Bit - Geekbench Total Score
3897 Points (10%)
Linpack Android / IOS - Linpack Multi Thread
100%
1 unknown +
13 MFLOPS (0%)
Linpack Android / IOS - Linpack Single Thread
100%
1 unknown +
12.8 MFLOPS (1%)
Mozilla Kraken 1.1 - Kraken 1.1 Total Score *
min: 8684     avg: 9440     median: 9271 (11%)     max: 10788 ms
1202 ms (1%)
Sunspider - Sunspider 0.9.1 Total Score *
100%
1 unknown +
7004 ms (66%)
Sunspider - Sunspider 1.0 Total Score *
1173 ms (13%)
203.8 ms (2%)
Octane V2 - Octane V2 Total Score
2672 Points (2%)
min: 4191     avg: 4947     median: 4980 (4%)     max: 5471 Points
33982 Points (31%)
WebXPRT 4 - WebXPRT 4 Score
99 Points (28%)
WebXPRT 3 - WebXPRT 3 Score
min: 34     avg: 38.7     median: 40 (8%)     max: 42 Points
AnTuTu v6 - AnTuTu v6 Total Score
min: 62810     avg: 65730     median: 66608 (23%)     max: 68232 Points
AnTuTu v7 - AnTuTu v7 MEM
min: 7947     avg: 8633     median: 8430.5 (26%)     max: 9656 Points
AnTuTu v7 - AnTuTu v7 UX
min: 21484     avg: 23751     median: 24193.5 (30%)     max: 24268 Points
AnTuTu v7 - AnTuTu v7 GPU
min: 12982     avg: 13331     median: 13167.5 (4%)     max: 14340 Points
AnTuTu v7 - AnTuTu v7 CPU
min: 39451     avg: 41305     median: 41643.5 (25%)     max: 41874 Points
AnTuTu v7 - AnTuTu v7 Total Score
min: 81992     avg: 87019     median: 87511.5 (15%)     max: 89639 Points
Antutu v9 - AnTuTu v9 Total Score
655341 Points (40%)
Antutu v9 - AnTuTu v9 CPU
182634 Points (50%)
AndEBench - AndEBench Java
1694 Iter./s (52%)
AndEBench - AndEBench Native
20418 Iter./s (67%)
PassMark PerformanceTest Mobile V1 - PerformanceTest Mobile V1 CPU Tests
min: 122441     avg: 127602     median: 127602 (17%)     max: 132762 Points
PCMark for Android - PCM f. Android Computer Vision
min: 2413     avg: 2626     median: 2635 (14%)     max: 2819 Points
PCMark for Android - PCM f. Android Storage
min: 5970     avg: 7032     median: 6957 (15%)     max: 8244 Points
PCMark for Android - PCM f. Android Work Score 2.0
min: 4615     avg: 4805     median: 4834.5 (32%)     max: 4911 Points
PCMark for Android - PCM f. Android Work Score
min: 5704     avg: 5956     median: 5887 (29%)     max: 6252 Points
PCMark for Android - PCM f. Android Storage 2.0 random write internal
110.5 MB/s (81%)
PCMark for Android - PCM f. Android Storage 2.0 seq write internal
1435 MB/s (44%)
PCMark for Android - PCM f. Android Storage 2.0 random read internal
63.2 MB/s (78%)
PCMark for Android - PCM f. Android Storage 2.0 seq read internal
1522 MB/s (42%)
PCMark for Android - PCM f. Android Storage 2.0 score
45015 Points (71%)
PCMark for Android - PCM f. Android Work Score 3.0
10620 Points (49%)
CrossMark - CrossMark Overall
834 Points (32%)
Power Consumption - Geekbench 5.5 Power Consumption 150cd *
8.2 Watt (4%)
Power Consumption - Idle Power Consumption 150cd 1min *
4.2 Watt (5%)

Average Benchmarks unknown → 100% n=1

Average Benchmarks HiSilicon Kirin 659 → 186% n=1

Average Benchmarks HiSilicon Kirin 9000W → 1272% n=1

- Range of benchmark values for this graphics card
- Average benchmark values for this graphics card
* Smaller numbers mean a higher performance
1 This benchmark is not used for the average calculation

v1.26
log 07. 17:20:44

#0 checking url part for id 1859 +0s ... 0s

#1 checking url part for id 9252 +0s ... 0s

#2 checking url part for id 17388 +0s ... 0s

#3 not redirecting to Ajax server +0s ... 0s

#4 did not recreate cache, as it is less than 5 days old! Created at Tue, 07 May 2024 05:39:01 +0200 +0.001s ... 0.001s

#5 composed specs +0.152s ... 0.153s

#6 did output specs +0s ... 0.153s

#7 getting avg benchmarks for device 1859 +0.003s ... 0.156s

#8 got single benchmarks 1859 +0.476s ... 0.632s

#9 getting avg benchmarks for device 9252 +0.002s ... 0.634s

#10 got single benchmarks 9252 +0.02s ... 0.654s

#11 getting avg benchmarks for device 17388 +0.002s ... 0.656s

#12 got single benchmarks 17388 +0.006s ... 0.662s

#13 got avg benchmarks for devices +0s ... 0.662s

#14 min, max, avg, median took s +0.142s ... 0.804s

#15 return log +0s ... 0.804s

Please share our article, every link counts!
> Expert Reviews and News on Laptops, Smartphones and Tech Innovations > Benchmarks / Tech > Processor Comparison - Head 2 Head
Redaktion, 2017-09- 8 (Update: 2023-07- 1)