 Deutsch
 English
 Español
 Français
 Italiano
 Nederlands
 Polski
 Português
 Русский
 Türkçe
 Svenska
 Chinese
 Magyar
Laptop, Smartphone, and Tablet Comparison
On this page you are able to compare test data and specifications from our reviews. Select a model using our search, the search box below or the compare link in our reviews (below the specs).
Asus ZenBook 15 UX534FTAsus ZenBook 15 UX534F Laptop Review: Look Like an Ultrabook, Play Like a Gamer by Allen Ngo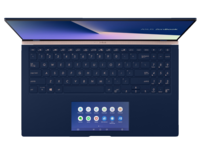 | ||||||||||||||||||||||||||||||||||
#454 Intel Core i7-8565U 16384 MB 1024 GB unknown: 6 15.60-inch 1920x1080 1650 g 354 x 220 x 18.9 71 Wh 1400 Euro | ||||||||||||||||||||||||||||||||||
SpecificationsAsus ZenBook 15 UX534FT-DB77 (ZenBook 15 UX534 Series) Processor Intel Core i7-8565U 4 x 1.8 - 4.6 GHz (Intel Core i7) Graphics adapter NVIDIA GeForce GTX 1650 Max-Q - 4 GB VRAM, Core: 1020 MHz, Memory: 1751 MHz, GDDR5, 436.30, Optimus Memory 16 GB , 1200 MHz, 16-20-20-45 Display 15.60 inch 16:9, 1920 x 1080 pixel 141 PPI, BOE NV156FHM-N63, IPS, BOE07D8, glossy: yes Mainboard Intel Cannon Lake-U PCH-LP Premium Storage Samsung SSD PM981 MZVLB1T0HALR, 1024 GB Soundcard Intel Cannon Lake-LP - cAVS Connections 1 USB 3.0 / 3.1 Gen1, 2 USB 3.1 Gen2, 1 HDMI, 1 DisplayPort, Audio Connections: 3.5 mm combo, Card Reader: SD reader Networking Intel Wireless-AC 9560 (a/b/g/n = Wi-Fi 4/ac = Wi-Fi 5/), Bluetooth 5 Size height x width x depth (in mm): 18.9 x 354 x 220 ( = 0.74 x 13.94 x 8.66 in) Battery 71 Wh Lithium-Polymer Operating System Microsoft Windows 10 Pro 64 Bit Camera Webcam: 720p Primary Camera: 0.9 MPix Additional features Speakers: Stereo, Keyboard: Chiclet, Keyboard Light: yes, My Asus, ICEPower, 12 Months Warranty Weight 1.65 kg ( = 58.2 oz / 3.64 pounds), Power Supply: 418 g ( = 14.74 oz / 0.92 pounds) Price 1400 USD
| ||||||||||||||||||||||||||||||||||
BOE NV156FHM-N63 tested with X-Rite i1Pro 2 Maximum: 312.6 cd/m² (Nits) Average: 290.3 cd/m² Minimum: 16.68 cd/m²Brightness Distribution: 85 % Center on Battery: 312.6 cd/m² Contrast: 1008:1 (Black: 0.31 cd/m²) ΔE Color 5.78 | 0.5-29.43 Ø5, calibrated: 3.78 ΔE Greyscale 5.4 | 0.57-98 Ø5.3 87.4% sRGB (Argyll 1.6.3 3D) 57.1% AdobeRGB 1998 (Argyll 1.6.3 3D) 64.1% AdobeRGB 1998 (Argyll 2.2.0 3D) 87.7% sRGB (Argyll 2.2.0 3D) 66.6% Display P3 (Argyll 2.2.0 3D) Gamma: 2.21 | ||||||||||||||||||||||||||||||||||
ERROR no Specs ID specified in element or header and also no heat ID found in element
| ||||||||||||||||||||||||||||||||||
Noise Level
| ||||||||||||||||||||||||||||||||||
Power Consumption
| ||||||||||||||||||||||||||||||||||
Asus ZenBook 15 UX534FT-DB77
-
09/29/2019 v7
Multimedia - Weighted Average
| ||||||||||||||||||||||||||||||||||
| ||||||||||||||||||||||||||||||||||
AS SSD Copy Game MB/s: 1287 MB/s | ||||||||||||||||||||||||||||||||||
AS SSD Copy Program MB/s: 468 MB/s | ||||||||||||||||||||||||||||||||||
AS SSD Copy ISO MB/s: 1375 MB/s | ||||||||||||||||||||||||||||||||||
AS SSD Score Total: 3483 Points | ||||||||||||||||||||||||||||||||||
AS SSD Score Write: 1664 Points | ||||||||||||||||||||||||||||||||||
AS SSD Score Read: 1210 Points | ||||||||||||||||||||||||||||||||||
AS SSD Access Time Write: 0.075 ms* | ||||||||||||||||||||||||||||||||||
AS SSD Access Time Read: 0.034 ms* | ||||||||||||||||||||||||||||||||||
AS SSD 4K-64 Write: 1375 MB/s | ||||||||||||||||||||||||||||||||||
AS SSD 4K-64 Read: 969 MB/s | ||||||||||||||||||||||||||||||||||
AS SSD 4K Write: 146 MB/s | ||||||||||||||||||||||||||||||||||
AS SSD 4K Read: 52.3 MB/s | ||||||||||||||||||||||||||||||||||
AS SSD Seq Write: 1432 MB/s | ||||||||||||||||||||||||||||||||||
AS SSD Seq Read: 1887 MB/s | ||||||||||||||||||||||||||||||||||
Cinebench R15 CPU Single 64Bit: 181 Points | ||||||||||||||||||||||||||||||||||
Cinebench R15 CPU Multi 64Bit: 683 Points | ||||||||||||||||||||||||||||||||||
Cinebench R15 Ref. Match 64Bit: 99.6 % | ||||||||||||||||||||||||||||||||||
Cinebench R15 OpenGL 64Bit: 107.1 fps | ||||||||||||||||||||||||||||||||||
3DMark 11 Performance Combined: 8563 Points | ||||||||||||||||||||||||||||||||||
3DMark 11 Performance Physics: 9092 Points | ||||||||||||||||||||||||||||||||||
3DMark 11 Performance GPU: 10761 Points | ||||||||||||||||||||||||||||||||||
3DMark 11 Performance: 10217 Points | ||||||||||||||||||||||||||||||||||
3DMark Time Spy CPU: 3810 Points | ||||||||||||||||||||||||||||||||||
3DMark Time Spy Graphics: 2836 Points | ||||||||||||||||||||||||||||||||||
3DMark Time Spy Score: 2949 Points | ||||||||||||||||||||||||||||||||||
3DMark Fire Strike Ultra Combined: 868 Points | ||||||||||||||||||||||||||||||||||
3DMark Fire Strike Ultra Physics: 10566 Points | ||||||||||||||||||||||||||||||||||
3DMark Fire Strike Ultra Graphics: 1457 Points | ||||||||||||||||||||||||||||||||||
3DMark Fire Strike Ultra Score: 1552 Points | ||||||||||||||||||||||||||||||||||
3DMark Fire Strike Combined: 2760 Points | ||||||||||||||||||||||||||||||||||
3DMark Fire Strike Physics: 10504 Points | ||||||||||||||||||||||||||||||||||
3DMark Fire Strike Graphics: 7593 Points | ||||||||||||||||||||||||||||||||||
3DMark Fire Strike Score: 6698 Points | ||||||||||||||||||||||||||||||||||
3DMark Cloud Gate Standard Physics: 7470 Points | ||||||||||||||||||||||||||||||||||
3DMark Cloud Gate Standard Graphics: 46686 Points | ||||||||||||||||||||||||||||||||||
3DMark Cloud Gate Standard Score: 21547 Points | ||||||||||||||||||||||||||||||||||
Mozilla Kraken 1.1 Total: 1073 ms* | ||||||||||||||||||||||||||||||||||
Octane V2 Total Score: 35259 Points | ||||||||||||||||||||||||||||||||||
CrystalDiskMark 5.2 / 6 Write 4K: 141.6 MB/s | ||||||||||||||||||||||||||||||||||
CrystalDiskMark 5.2 / 6 Read 4K: 45.28 MB/s | ||||||||||||||||||||||||||||||||||
CrystalDiskMark 5.2 / 6 Write Seq: 1975 MB/s | ||||||||||||||||||||||||||||||||||
CrystalDiskMark 5.2 / 6 Read Seq: 2272 MB/s | ||||||||||||||||||||||||||||||||||
CrystalDiskMark 5.2 / 6 Write 4K Q32T1: 458.6 MB/s | ||||||||||||||||||||||||||||||||||
CrystalDiskMark 5.2 / 6 Read 4K Q32T1: 391.4 MB/s | ||||||||||||||||||||||||||||||||||
CrystalDiskMark 5.2 / 6 Write Seq Q32T1: 2393 MB/s | ||||||||||||||||||||||||||||||||||
CrystalDiskMark 5.2 / 6 Read Seq Q32T1: 3464 MB/s | ||||||||||||||||||||||||||||||||||
Cinebench R20 CPU (Single Core): 444 Points | ||||||||||||||||||||||||||||||||||
Cinebench R20 CPU (Multi Core): 1645 Points | ||||||||||||||||||||||||||||||||||
PCMark 8 Work Score Accelerated v2: 5132 Points | ||||||||||||||||||||||||||||||||||
PCMark 8 Home Score Accelerated v2: 3764 Points | ||||||||||||||||||||||||||||||||||
JetStream 1.1 Total Score: 246.8 Points | ||||||||||||||||||||||||||||||||||
PCMark 10 Digital Content Creation: 4680 Points | ||||||||||||||||||||||||||||||||||
PCMark 10 Productivity: 7201 Points | ||||||||||||||||||||||||||||||||||
PCMark 10 Essentials: 9067 Points | ||||||||||||||||||||||||||||||||||
PCMark 10 Score: 4828 Points | ||||||||||||||||||||||||||||||||||
Shadow of the Tomb Raider Highest Preset: 34 fps | ||||||||||||||||||||||||||||||||||
Shadow of the Tomb Raider High Preset: 39 fps | ||||||||||||||||||||||||||||||||||
Shadow of the Tomb Raider Medium Preset: 48 fps | ||||||||||||||||||||||||||||||||||
Shadow of the Tomb Raider Lowest Preset: 92 fps | ||||||||||||||||||||||||||||||||||
BioShock Infinite Ultra Preset, DX11 (DDOF): 72 fps | ||||||||||||||||||||||||||||||||||
BioShock Infinite High Preset: 172.2 fps | ||||||||||||||||||||||||||||||||||
BioShock Infinite Medium Preset: 196.1 fps | ||||||||||||||||||||||||||||||||||
BioShock Infinite Very Low Preset: 259.1 fps | ||||||||||||||||||||||||||||||||||
The Witcher 3 Ultra Graphics & Postprocessing (HBAO+): 30.7 fps | ||||||||||||||||||||||||||||||||||
The Witcher 3 High Graphics & Postprocessing (Nvidia HairWorks Off): 54.3 fps | ||||||||||||||||||||||||||||||||||
The Witcher 3 Medium Graphics & Postprocessing: 93.6 fps | ||||||||||||||||||||||||||||||||||
The Witcher 3 Low Graphics & Postprocessing: 156.1 fps | ||||||||||||||||||||||||||||||||||
Rocket League High Quality: 97.8 fps | ||||||||||||||||||||||||||||||||||
Rocket League Quality: 138.1 fps | ||||||||||||||||||||||||||||||||||
Rocket League Performance: 193.4 fps | ||||||||||||||||||||||||||||||||||
Rocket League Performance: 216.1 fps | ||||||||||||||||||||||||||||||||||
SD Card Reader JPG Copy Test (av. of 3 runs): 69.2 MB/s | ||||||||||||||||||||||||||||||||||
SD Card Reader AS SSD Seq Read Test (1GB): 82.2 MB/s | ||||||||||||||||||||||||||||||||||
Battery Runtime WiFi Websurfing: 503 min | ||||||||||||||||||||||||||||||||||
Response Times Response Time Grey 50% / Grey 80%: 41.2 ms* | ||||||||||||||||||||||||||||||||||
Response Times Response Time Black / White: 33.2 ms* | ||||||||||||||||||||||||||||||||||
Response Times PWM Frequency: 0 Hz | ||||||||||||||||||||||||||||||||||
Emissions Fan Noise The Witcher 3 ultra: 39.8 dB(A) | ||||||||||||||||||||||||||||||||||
Loudspeakers Pink Noise: 77.5 dB(A) | ||||||||||||||||||||||||||||||||||
Networking iperf3 receive AX12: 696 MBit/s | ||||||||||||||||||||||||||||||||||
Networking iperf3 transmit AX12: 621 MBit/s | ||||||||||||||||||||||||||||||||||
Power Consumption Witcher 3 ultra Efficiency: 0.485 fps per Watt | ||||||||||||||||||||||||||||||||||
Power Consumption Witcher 3 ultra: 63.3 Watt* | ||||||||||||||||||||||||||||||||||
Display Display P3 Coverage: 66.6 % | ||||||||||||||||||||||||||||||||||
Display sRGB Coverage: 87.7 % | ||||||||||||||||||||||||||||||||||
Display AdobeRGB 1998 Coverage: 64.1 % | ||||||||||||||||||||||||||||||||||

Console
log 02. 19:30:29
#0 before search +0s ... 0s
#1 after search +0s ... 0s
#2 added compareJS +0s ... 0s
#3 looking up spec 311899 +0s ... 0s
#4 more than one entry found +0.002s ... 0.003s
#5 ZenBook 15 UX534FT for array +0.242s ... 0.244s
#6 return log +0s ... 0.244s