Notebookcheck Logo

Qualcomm Snapdragon 8 Gen 1 vs Apple M2 Max

Qualcomm Snapdragon 8 Gen 1

► remove from comparison Qualcomm SD 8 Gen 1

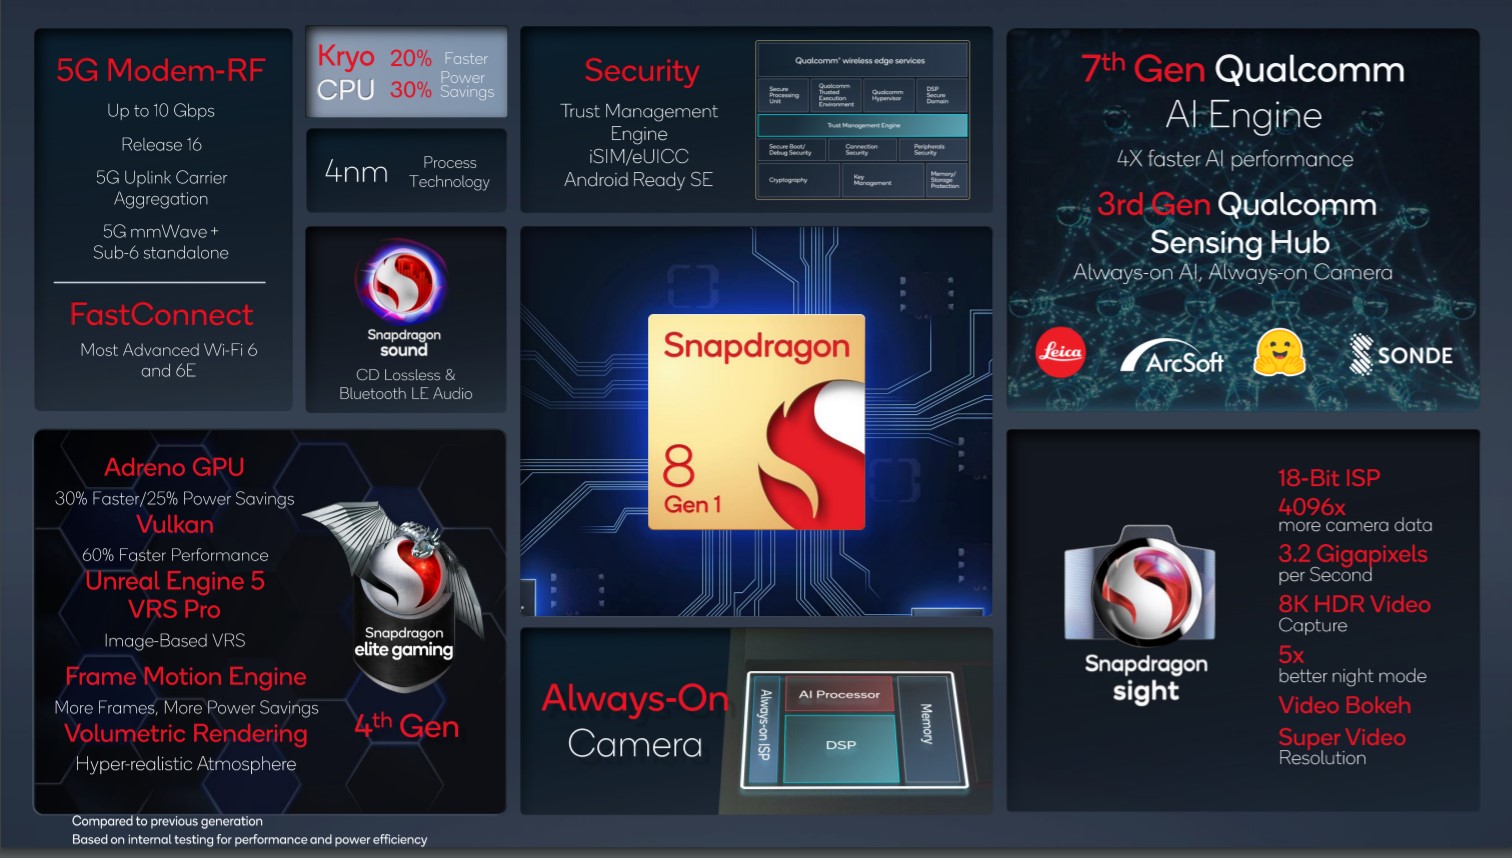
The Qualcomm Snapdragon 8 Gen 1 Mobile Platform is a high-end SoC for smartphones that was introduced in late 2021 and manufactured in 4 nm at Samsung. Integrates one “Prime Core” based on a ARM Cortex-X2 architecture clocked at up to 3 GHz. Three more performance cores are based on the Cortex-A710 but clocked up to 2.5 GHz. Furthermore, four energy saving cores are integrated that are based on the ARM Cortex-A510 architecture and clocked at up to 1.8 GHz. All cores can use the shared 6 MB level 3 cache.

Compared to the Snapdragon 888 (Plus), the CPU part gains 20% performance and 30% power savings according to Qualcomm. This means that the Snapdragon 8 Gen 1 is the fastest CPU for Android based smartphones and should be positioned between the Apple A13 and A14 CPU.

The integrated AI Engine can offer up to 4x faster AI performance thanks to the bigger Tensor engine. The 18-Bit-Spectra-ISP also saw some big improvements and is now called Snapdragon Sight.

The integrated Adreno 730 offers a 30% graphics boost compared to the previous Adreno 660.

The integrated Snapdragon X65 5G modem is also new and offers faster transfer rates (up to 10 Gbps download and 3 Gbps upload). The FastConnect 6900 offers support for the current Wifi 6E and Bluetooth 5.2.

Apple M2 Max

► remove from comparison Apple M2 Max

The Apple M2 Max is a System on a Chip (SoC) from Apple that is found in the early 2023 MacBook Pro 14 and 16-inch models. It offers all 12 CPU cores available in the chip divided in eight performance cores (P-cores) and four power-efficiency cores (E-cores). The E-cores clock with up to 3.4 GHz, the P-Cores up to 3.7 GHz (mostly 3.3 GHz in multi-threaded workloads and 3.4 GHz in single threaded).

The big cores (codename Avalanche) offer 192 KB instruction cache, 128 KB data cache, and 36 MB shared L2 cache (up from 24 MB in the M1 Pro). The four efficiency cores (codename Blizzard) are a lot smaller and offer only 128 KB instruction cache, 64 KB data cache, and 4 MB shared cache. CPU and GPU can both use the 49 MB SLC (System Level Cache). 

The unified memory (32, 64, or 96 GB LPDDR5-6400) next to the chip is connected by a 512 Bit memory controller (400 GB/s bandwidth) and can be used by the GPU and CPU.

The CPU performance should be quite similar to the M2 Pro as only the higher memory bandwidth and bigger L3 cache could make a difference for some workloads.

The integrated graphics card in the M1 Max offers a 30-core GPU or a GPU with all 38 cores.

Furthermore, the SoC integrates a fast 16 core neural engine (faster than M1 Max), a secure enclave (e.g., for encryption), a unified memory architecture, Thunderbolt 4 controller, an ISP, and media de- and encoders (including ProRes).

The M2 Max is manufactured in 5 nm at TSMC (second generation) and integrates 40 billion transistors. The power consumption of the CPU part is up to 36 Watt according to powermetrics. When fully loading the CPU and GPU cores, the chip uses up to 89 Watt and the CPU part is limited to 25 Watt.

ModelQualcomm Snapdragon 8 Gen 1Apple M2 Max
SeriesQualcomm SnapdragonApple Apple M2
CodenameCortex-X2 / A710 / A510 (Kryo) Waipio
Series: Apple M2
Qualcomm Snapdragon 8+ Gen 1 compare1.8 - 3.2 GHz8 / 8 cores6 MB L3
Qualcomm Snapdragon 8 Gen 1 « 1.8 - 3 GHz8 / 8 cores6 MB L3
Apple M2 Max « 2.42 - 3.7 GHz12 / 12 cores48 MB L3
Apple M2 Pro compare2.42 - 3.5 GHz12 / 12 cores24 MB L3
Apple M2 Pro 10-Core compare2.42 - 3.7 GHz10 / 10 cores24 MB L3
Apple M2 compare2.42 - 3.48 GHz8 / 8 cores8 MB L3
Clock1800 - 2995 MHz2424 - 3696 MHz
L3 Cache6 MB48 MB
Cores / Threads8 / 8
1 x 3.0 GHz ARM Cortex-X2
3 x 2.5 GHz ARM Cortex-A710
4 x 1.8 GHz ARM Cortex-A510
12 / 12
Technology4 nm5 nm
FeaturesAdreno 730 GPU, Spectra ISP, Hexagon, X65 5G Modem, FastConnect 6900 WiFi, LPDDR5-6400 Memory ControllerARMv8 Instruction Set
iGPUQualcomm Adreno 730Apple M2 Max 38-Core GPU
ArchitectureARM v9ARM
Announced
L1 Cache3.3 MB
L2 Cache36 MB
TDP79 Watt
Transistors67000 Million

Benchmarks

Cinebench R23 - Cinebench R23 Multi Core
100%
1 M2 Max +
min: 14738     avg: 14753     median: 14752.5 (14%)     max: 14767 Points
Cinebench R23 - Cinebench R23 Single Core
100%
1 M2 Max +
min: 1625     avg: 1644     median: 1643.5 (70%)     max: 1662 Points
Cinebench R20 - Cinebench R20 CPU (Single Core)
100%
1 M2 Max +
min: 451     avg: 455.5     median: 455.5 (51%)     max: 460 Points
Cinebench R20 - Cinebench R20 CPU (Multi Core)
100%
1 M2 Max +
min: 4044     avg: 4065     median: 4064.5 (10%)     max: 4085 Points
Cinebench R15 - Cinebench R15 CPU Multi 64 Bit
100%
1 M2 Max +
min: 2074     avg: 2084     median: 2084 (13%)     max: 2094 Points
Cinebench R15 - Cinebench R15 CPU Single 64 Bit
100%
1 M2 Max +
min: 233     avg: 236     median: 236 (71%)     max: 239 Points
Blender - Blender 3.3 Classroom CPU *
100%
1 M2 Max +
326 Seconds (4%)
Blender - Blender 2.79 BMW27 CPU *
100%
1 M2 Max +
333 Seconds (2%)
Geekbench 6.2 - Geekbench 6.2 Single-Core
1610 Points (43%)
2692 Points (72%)
Geekbench 6.2 - Geekbench 6.2 Multi-Core
3860 Points (15%)
14863 Points (59%)
min: 1965     avg: 1970     median: 1967 (83%)     max: 1978 Points
min: 15348     avg: 15388     median: 15373 (28%)     max: 15444 Points
Geekbench 4.4 - Geekbench 4.1 - 4.4 64 Bit Single-Core
min: 6273     avg: 6608     median: 6668 (67%)     max: 6984 Points
Geekbench 4.4 - Geekbench 4.1 - 4.4 64 Bit Multi-Core
min: 14289     avg: 15053     median: 15021 (16%)     max: 15948 Points
Geekbench 4.0 - Geekbench 4.0 64 Bit Single-Core
5038 Points (69%)
Geekbench 4.0 - Geekbench 4.0 64 Bit Multi-Core
13465 Points (33%)
Geekbench 3 - Geekbench 3 64 Bit Multi-Core
7296 Points (11%)
Geekbench 3 - Geekbench 3 64 Bit Single-Core
3017 Points (45%)
Geekbench 2 - 32 Bit - Geekbench Stream
4412 Points (36%)
Geekbench 2 - 32 Bit - Geekbench Memory
8709 Points (79%)
Geekbench 2 - 32 Bit - Geekbench Floating Point
12775 Points (25%)
Geekbench 2 - 32 Bit - Geekbench Integer
5715 Points (12%)
Geekbench 2 - 32 Bit - Geekbench Total Score
8654 Points (23%)
Mozilla Kraken 1.1 - Kraken 1.1 Total Score *
min: 813.5     avg: 1010     median: 897.3 (1%)     max: 1440.1 ms
min: 430.2     avg: 437.2     median: 437.2 (1%)     max: 444.2 ms
Sunspider - Sunspider 1.0 Total Score *
302.5 ms (3%)
Octane V2 - Octane V2 Total Score
min: 27730     avg: 42391     median: 45945 (41%)     max: 50626 Points
min: 76610     avg: 77676     median: 77676 (70%)     max: 78742 Points
WebXPRT 4 - WebXPRT 4 Score
min: 68     avg: 93     median: 92.5 (27%)     max: 119 Points
min: 258     avg: 259     median: 259 (74%)     max: 260 Points
WebXPRT 3 - WebXPRT 3 Score
min: 79     avg: 142.9     median: 151 (31%)     max: 193 Points
min: 402     avg: 404.5     median: 404.5 (84%)     max: 407 Points
PCMark for Android - PCM f. Android Storage 2.0 random write internal
min: 36.15     avg: 47.6     median: 43.5 (32%)     max: 69.62 MB/s
PCMark for Android - PCM f. Android Storage 2.0 seq write internal
min: 831     avg: 1096     median: 1169.1 (36%)     max: 1193.1 MB/s
PCMark for Android - PCM f. Android Storage 2.0 random read internal
min: 29.04     avg: 32.6     median: 30.1 (37%)     max: 42.71 MB/s
PCMark for Android - PCM f. Android Storage 2.0 seq read internal
min: 1283     avg: 1482     median: 1526.6 (42%)     max: 1662.25 MB/s
PCMark for Android - PCM f. Android Storage 2.0 score
min: 19708     avg: 30794     median: 30302 (48%)     max: 44918 Points
PCMark for Android - PCM f. Android Work Score 2.0
min: 11351     avg: 11629     median: 11628.5 (76%)     max: 11906 Points
min: 1759     avg: 1835     median: 1834.5 (70%)     max: 1910 Points
Power Consumption - Cinebench R15 Multi Power Consumption - external Monitor *
100%
1 M2 Max +
72.8 Watt (13%)
Power Consumption - Idle Power Consumption - external Monitor *
100%
1 M2 Max +
9.2 Watt (6%)
Power Consumption - Cinebench R15 Multi Power Efficiency - external Monitor
100%
1 M2 Max +
28.5 Points per Watt (21%)

Average Benchmarks Qualcomm Snapdragon 8 Gen 1 → 100% n=9

Average Benchmarks Apple M2 Max → 238% n=9

- Range of benchmark values for this graphics card
- Average benchmark values for this graphics card
* Smaller numbers mean a higher performance
1 This benchmark is not used for the average calculation

Add one or more devices and compare

In the following list you can select (and also search for) devices that should be added to the comparison. You can select more than one device.

restrict list:

show all (including archived), 2024, 2023
v1.27
log 03. 15:12:54

#0 checking url part for id 14029 +0s ... 0s

#1 checking url part for id 14975 +0s ... 0s

#2 not redirecting to Ajax server +0s ... 0s

#3 did not recreate cache, as it is less than 5 days old! Created at Sat, 01 Jun 2024 05:37:57 +0200 +0.001s ... 0.001s

#4 composed specs +0.034s ... 0.035s

#5 did output specs +0s ... 0.035s

#6 getting avg benchmarks for device 14029 +0.003s ... 0.038s

#7 got single benchmarks 14029 +0.043s ... 0.081s

#8 getting avg benchmarks for device 14975 +0.004s ... 0.085s

#9 got single benchmarks 14975 +0.009s ... 0.094s

#10 got avg benchmarks for devices +0s ... 0.094s

#11 min, max, avg, median took s +0.146s ... 0.24s

#12 return log +0.021s ... 0.261s

Please share our article, every link counts!
> Expert Reviews and News on Laptops, Smartphones and Tech Innovations > Benchmarks / Tech > Processor Comparison - Head 2 Head
Redaktion, 2017-09- 8 (Update: 2023-07- 1)