Notebookcheck Logo

Qualcomm Snapdragon 660 vs Apple A15 Bionic

Qualcomm Snapdragon 660

► remove from comparison Qualcomm SD 660

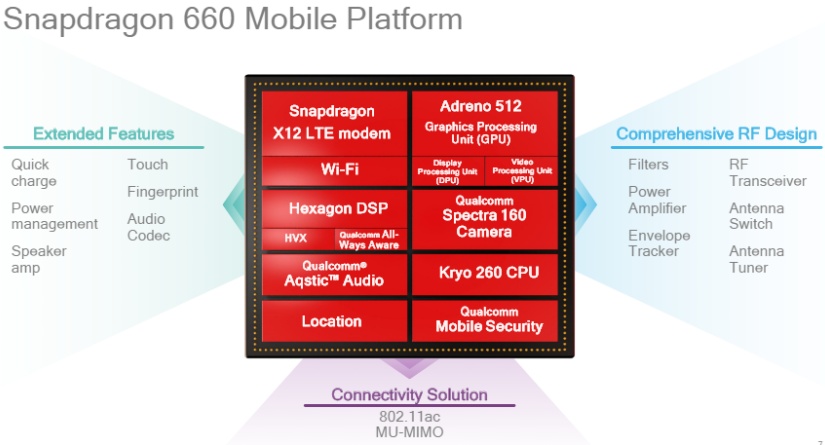
The Qualcomm Snapdragon 660 (SD660) is a fast mid-range ARM-based SoC largely found on Android tablets and smartphones. Announced in mid 2017, the SD660 is the successor to the Snapdragon 625. It features 8 Kryo 260 cores (custom design, 64-Bit capable) that are divided in two clusters. A fast cluster of four cores with up to 2.2 GHz and a power saving efficiency cluster with up to 1.8 GHz. Both clusters can also used together.

In addition to the 8 CPU cores, the SoC integrates a mid range Adreno 512 GPU with a LPDDR4 memory controller (dual-channel 1866 MHz)  and supports Wi-Fi (802.11ac + MIMO, max. 867 Mbps), Bluetooth 5, and LTE (X12 LTE modem with up to 600 Mbps download and 150 Mbps upload).

Performance

In Benchmarks of the Oppo R11, the CPU part of the Snapdragon SD660 performs between former high end Socs like the Snapdragon 821 in the Pixel XL and the Snapdragon 835. The graphics performance is however much lower, as the Adreno 512 is only a slight upgrade of the older Adreno 510 (due to the higher clock speed).

CPU

The Snapdragon 660 is based on a similar concept as ARM's big.LITTLE, which combines a low power CPU cluster (2x Kyro clocked at up to 1.8 GHz) and a performance CPU cluster (2x Kyro clocked at up to 2.2 GHz). The clock speed of each cluster can be individually adjusted (but not per core) and the lowest clock speed is 310 MHz (unverified).

Power Consumption

Thanks to the new 14 nm process, the energy efficiency has been improved noticeably compared to its 20 nm predecessors.

Apple A15 Bionic

► remove from comparison Apple A15

The Apple A15 Bionic is a System on a Chip (SoC) from Apple that is found in the iPhone 13 and iPad Mini (2021) models. It was announced late 2021 and offers 6 cores divided in 2 performance cores and four power efficiency cores. The CPU performance increases only slightly compared to the A14, but GPU (in the higher end models) offers higher gains.

The chip is manufactured in 5nm and integrates 15.8 billion transistors (compared to the 11.8 of the A14).

ModelQualcomm Snapdragon 660Apple A15 Bionic
CodenameKryo 260
SeriesQualcomm SnapdragonApple Apple A-Series
Series: Apple A-Series
Qualcomm Snapdragon 665 compare2.2 GHz8 / 8 cores Kryo 260
Qualcomm Snapdragon 6s 4G Gen 1 compare1.8 - 2.1 GHz8 / 8 cores Kryo 260
Qualcomm Snapdragon 662 compare1.8 - 2 GHz8 / 8 cores Kryo 260
Qualcomm Snapdragon 660 « 2.2 GHz8 / 8 cores Kryo 260
Qualcomm Snapdragon 636 compare1.8 GHz8 / 8 cores Kryo 260
Apple A19 Pro compare2.6 - 4.26 GHz6 / 6 cores32 MB L3
Apple A19 compare2.6 - 4.26 GHz6 / 6 cores12 MB L3
Apple A18 Pro compare - 4 GHz6 / 6 cores
Apple A18 compare - 3.8 GHz6 / 6 cores
Apple A15 Bionic « 2.02 - 3.23 GHz6 / 6 cores32 MB L3
Apple A12 Bionic compare - 2.49 GHz6 / 6 cores
Apple A6x compare1.4 GHzcores
Apple A6 compare1 GHzcores
Clock2200 MHz2020 - 3230 MHz
Cores / Threads8 / 86 / 6
Technology14 nm5 nm
FeaturesAdreno 512 GPU, X12 LTE Modem, Hexagon 680 DSP, Specra ISPARMv8 Instruction Set, Machine Learning Controller, 16-Core Neural Engine, Secure Enclave, Advanced Image Signal Processor
iGPUQualcomm Adreno 512 ( - 850 MHz)Apple A15 GPU 5-Core
ArchitectureARMARM
Announced
Manufacturerwww.qualcomm.com
L2 Cache16 MB
L3 Cache32 MB
Transistors15800 Million
NPU / AI15.8 TOPS INT8

Benchmarks

Performance Rating - Geekbench 5.5, PCM Work, Sling Shot Physics, Antutu v8 CPU - SD 660
0.5 pt (40%)
Restrict / Search: Model: Max. age: years
3DMark - 3DMark Ice Storm Unlimited Physics
100%
1 SD 660 +
min: 15088     avg: 19093     median: 19488.5 (16%)     max: 21016 Points
70%
A15 +
min: 1852     avg: 2027     median: 1913 (18%)     max: 2307 Points
3DMark - 3DMark Sling Shot (ES 3.0) Unlimited Physics
min: 2238     avg: 2695     median: 2752 (31%)     max: 2815 Points
Geekbench 6.5 - Geekbench 6.5 Single-Core
100%
1 A15 +
2332 Points (54%)
Geekbench 6.5 - Geekbench 6.5 Multi-Core
100%
1 A15 +
5661 Points (22%)
Geekbench 5.5 - Geekbench 5.1 - 5.5 64 Bit Single-Core
min: 294     avg: 322.8     median: 330.5 (11%)     max: 336 Points
525%
A15 +
min: 1590     avg: 1723     median: 1734 (58%)     max: 1755 Points
Geekbench 5.5 - Geekbench 5.1 - 5.5 64 Bit Multi-Core
min: 1304     avg: 1445     median: 1440.5 (3%)     max: 1595 Points
332%
A15 +
min: 4559     avg: 4755     median: 4788 (9%)     max: 4914 Points
Geekbench 5.0 - Geekbench 5.0 64 Bit Single-Core
100%
1 SD 660 +
min: 313     avg: 321.5     median: 321.5 (1%)     max: 330 Points
Geekbench 5.0 - Geekbench 5.0 64 Bit Multi-Core
100%
1 SD 660 +
min: 1127     avg: 1305     median: 1305 (4%)     max: 1483 Points
Geekbench 4.4 - Geekbench 4.1 - 4.4 64 Bit Single-Core
100%
1 SD 660 +
min: 1431     avg: 1598     median: 1617 (16%)     max: 1646 Points
Geekbench 4.4 - Geekbench 4.1 - 4.4 64 Bit Multi-Core
100%
1 SD 660 +
min: 4895     avg: 5694     median: 5850 (6%)     max: 5913 Points
Geekbench 4.0 - Geekbench 4.0 64 Bit Single-Core
100%
1 SD 660 +
min: 1609     avg: 1628     median: 1628 (18%)     max: 1647 Points
Geekbench 4.0 - Geekbench 4.0 64 Bit Multi-Core
100%
1 SD 660 +
min: 5846     avg: 5860     median: 5859.5 (8%)     max: 5873 Points
Geekbench 2 - 32 Bit - Geekbench Stream
100%
1 SD 660 +
min: 1038     avg: 1079     median: 1079 (6%)     max: 1120 Points
Geekbench 2 - 32 Bit - Geekbench Memory
100%
1 SD 660 +
min: 2981     avg: 2996     median: 2995.5 (21%)     max: 3010 Points
Geekbench 2 - 32 Bit - Geekbench Floating Point
100%
1 SD 660 +
min: 9892     avg: 10223     median: 10223 (20%)     max: 10554 Points
Geekbench 2 - 32 Bit - Geekbench Integer
100%
1 SD 660 +
min: 5295     avg: 5302     median: 5301.5 (11%)     max: 5308 Points
Geekbench 2 - 32 Bit - Geekbench Total Score
100%
1 SD 660 +
min: 6031     avg: 6141     median: 6141 (16%)     max: 6251 Points
Mozilla Kraken 1.1 - Kraken 1.1 Total Score *
min: 3796     avg: 4115     median: 3954 (5%)     max: 4769 ms
877%
A15 +
min: 413.6     avg: 455.6     median: 451 (1%)     max: 507.3 ms
Sunspider - Sunspider 1.0 Total Score *
630 ms (7%)
818%
A15 +
77 ms (1%)
Octane V2 - Octane V2 Total Score
min: 8463     avg: 9973     median: 10070 (7%)     max: 10945 Points
636%
A15 +
min: 57143     avg: 63305     median: 64026.5 (42%)     max: 65969 Points
WebXPRT 4 - WebXPRT 4 Score
100%
1 A15 +
min: 188     avg: 188.3     median: 188 (49%)     max: 189 Points
WebXPRT 3 - WebXPRT 3 Score
min: 47     avg: 57.1     median: 59 (11%)     max: 63 Points
424%
A15 +
min: 219     avg: 254.3     median: 250 (45%)     max: 279 Points
AnTuTu v6 - AnTuTu v6 Total Score
100%
1 SD 660 +
min: 105973     avg: 116194     median: 117165 (40%)     max: 120479 Points
AnTuTu v7 - AnTuTu v7 MEM
100%
1 SD 660 +
min: 6301     avg: 7335     median: 7220.5 (22%)     max: 8424 Points
AnTuTu v7 - AnTuTu v7 UX
100%
1 SD 660 +
min: 33509     avg: 37799     median: 38669.5 (47%)     max: 39182 Points
AnTuTu v7 - AnTuTu v7 GPU
100%
1 SD 660 +
min: 21675     avg: 28666     median: 30372.5 (9%)     max: 30829 Points
AnTuTu v7 - AnTuTu v7 CPU
100%
1 SD 660 +
min: 48764     avg: 63355     median: 64877.5 (40%)     max: 66862 Points
AnTuTu v7 - AnTuTu v7 Total Score
100%
1 SD 660 +
min: 116346     avg: 137699     median: 140898 (25%)     max: 143551 Points
AnTuTu v8 - AnTuTu v8 UX
100%
1 SD 660 +
min: 26647     avg: 30836     median: 32596 (27%)     max: 33266 Points
AnTuTu v8 - AnTuTu v8 MEM
100%
1 SD 660 +
min: 28919     avg: 31931     median: 32883 (27%)     max: 33992 Points
AnTuTu v8 - AnTuTu v8 GPU
100%
1 SD 660 +
min: 33505     avg: 36822     median: 35936 (7%)     max: 41026 Points
AnTuTu v8 - AnTuTu v8 CPU
100%
1 SD 660 +
min: 62411     avg: 68266     median: 66442 (24%)     max: 75946 Points
AnTuTu v8 - AnTuTu v8 Total Score
100%
1 SD 660 +
min: 157877     avg: 167856     median: 161462 (16%)     max: 184230 Points
Antutu v9 - AnTuTu v9 Total Score
100%
1 A15 +
min: 722973     avg: 788523     median: 800415 (39%)     max: 832548 Points
Antutu v9 - AnTuTu v9 CPU
100%
1 A15 +
min: 192891     avg: 209810     median: 209802 (52%)     max: 227638 Points
AndEBench - AndEBench Java
100%
1 SD 660 +
3240 Iter./s (100%)
AndEBench - AndEBench Native
100%
1 SD 660 +
28882 Iter./s (95%)
PassMark PerformanceTest Mobile V1 - PerformanceTest Mobile V1 CPU Tests
min: 2487     avg: 125771     median: 186416 (25%)     max: 188411 Points
min: 10349     avg: 10411     median: 10410.5 (1%)     max: 10472 Points
PCMark for Android - PCM f. Android Work Score 3.0
100%
1 SD 660 +
6514 Points (23%)
PCMark for Android - PCM f. Android Computer Vision
100%
1 SD 660 +
min: 3032     avg: 3285     median: 3363 (18%)     max: 3486 Points
PCMark for Android - PCM f. Android Storage
100%
1 SD 660 +
min: 2889     avg: 4395     median: 4250 (9%)     max: 5913 Points
PCMark for Android - PCM f. Android Work Score 2.0
100%
1 SD 660 +
min: 5789     avg: 6050     median: 6052 (40%)     max: 6426 Points
PCMark for Android - PCM f. Android Work Score
100%
1 SD 660 +
min: 6274     avg: 6676     median: 6723 (34%)     max: 7026 Points
CrossMark - CrossMark Overall
100%
1 A15 +
min: 1132     avg: 1156     median: 1145 (43%)     max: 1190 Points
Power Consumption - Geekbench 5.5 Power Consumption 150cd *
100%
1 A15 +
min: 4.54     avg: 4.9     median: 5 (2%)     max: 5.64 Watt
Power Consumption - Idle Power Consumption 150cd 1min *
100%
1 A15 +
min: 0     avg: 0.7     median: 0.7 (1%)     max: 1.415 Watt

Average Benchmarks Qualcomm Snapdragon 660 → 100% n=9

Average Benchmarks Apple A15 Bionic → 418% n=9

- Range of benchmark values for this graphics card
red legend - Average benchmark values for this graphics card
* Smaller numbers mean a higher performance
1 This benchmark is not used for the average calculation

Add one or more devices and compare

In the following list you can select (and also search for) devices that should be added to the comparison. You can select more than one device.

restrict list:
v1.35
log 20. 22:54:04

#0 ran 0s before starting gpusingle class +0s ... 0s

#1 checking url part for id 9944 +0s ... 0s

#2 checking url part for id 13825 +0s ... 0s

#3 redirected to Ajax server, took 1766267644s time from redirect:0 +0s ... 0s

#4 did not recreate cache, as it is less than 5 days old! Created at Fri, 19 Dec 2025 14:52:30 +0100 +0s ... 0s

#5 composed specs +0.005s ... 0.005s

#6 did output specs +0s ... 0.005s

#7 getting avg benchmarks for device 9944 +0.003s ... 0.008s

#8 got single benchmarks 9944 +0.016s ... 0.023s

#9 getting avg benchmarks for device 13825 +0.001s ... 0.024s

#10 got single benchmarks 13825 +0.009s ... 0.033s

#11 got avg benchmarks for devices +0s ... 0.033s

#12 min, max, avg, median took s +0.023s ... 0.056s

#13 return log +0.001s ... 0.056s

Please share our article, every link counts!
Mail Logo
Google Logo Add as a preferred
source on Google
> Expert Reviews and News on Laptops, Smartphones and Tech Innovations > Benchmarks / Tech > Processor Comparison - Head 2 Head
Redaktion, 2017-09- 8 (Update: 2023-07- 1)