Notebookcheck Logo

Rockchip RK3288 vs AMD Ryzen 7 5800X3D

Rockchip RK3288

► remove from comparison  RK3288

The Rockchip RK3288 is a mid-range ARM SoC for Android and Chrome OS mobile systems. It integrates four Cortex-A12 cores clocked at up to 1.8 GHz. ARM calls these cores Cortex-A17 due to them having very similar performance levels. The SoC includes an ARM Mali-T760 MP4 (also called Mali-T764) GPU clocked at 600 MHz and a dual-channel DDR3, DDR3L, LPDDR2, LPDDR3 memory controller.

The ARM Cortex-A12 is the successor to the Cortex-A9 and is based on a 32 Bit ARMv7-A microarchitecture. A single A12 core should be roughly 40 % more powerful than an A9 core according to ARM.

The integrated video engine supports encoding of H.264, VP8, and MVC videos up to 1080p. Decoding is supported for videos up to 4K H.264 and 10 Bit H.265.

The chip is manufactured under a 28 nm HKMG process.

AMD Ryzen 7 5800X3D

► remove from comparison AMD R7 5800X3D

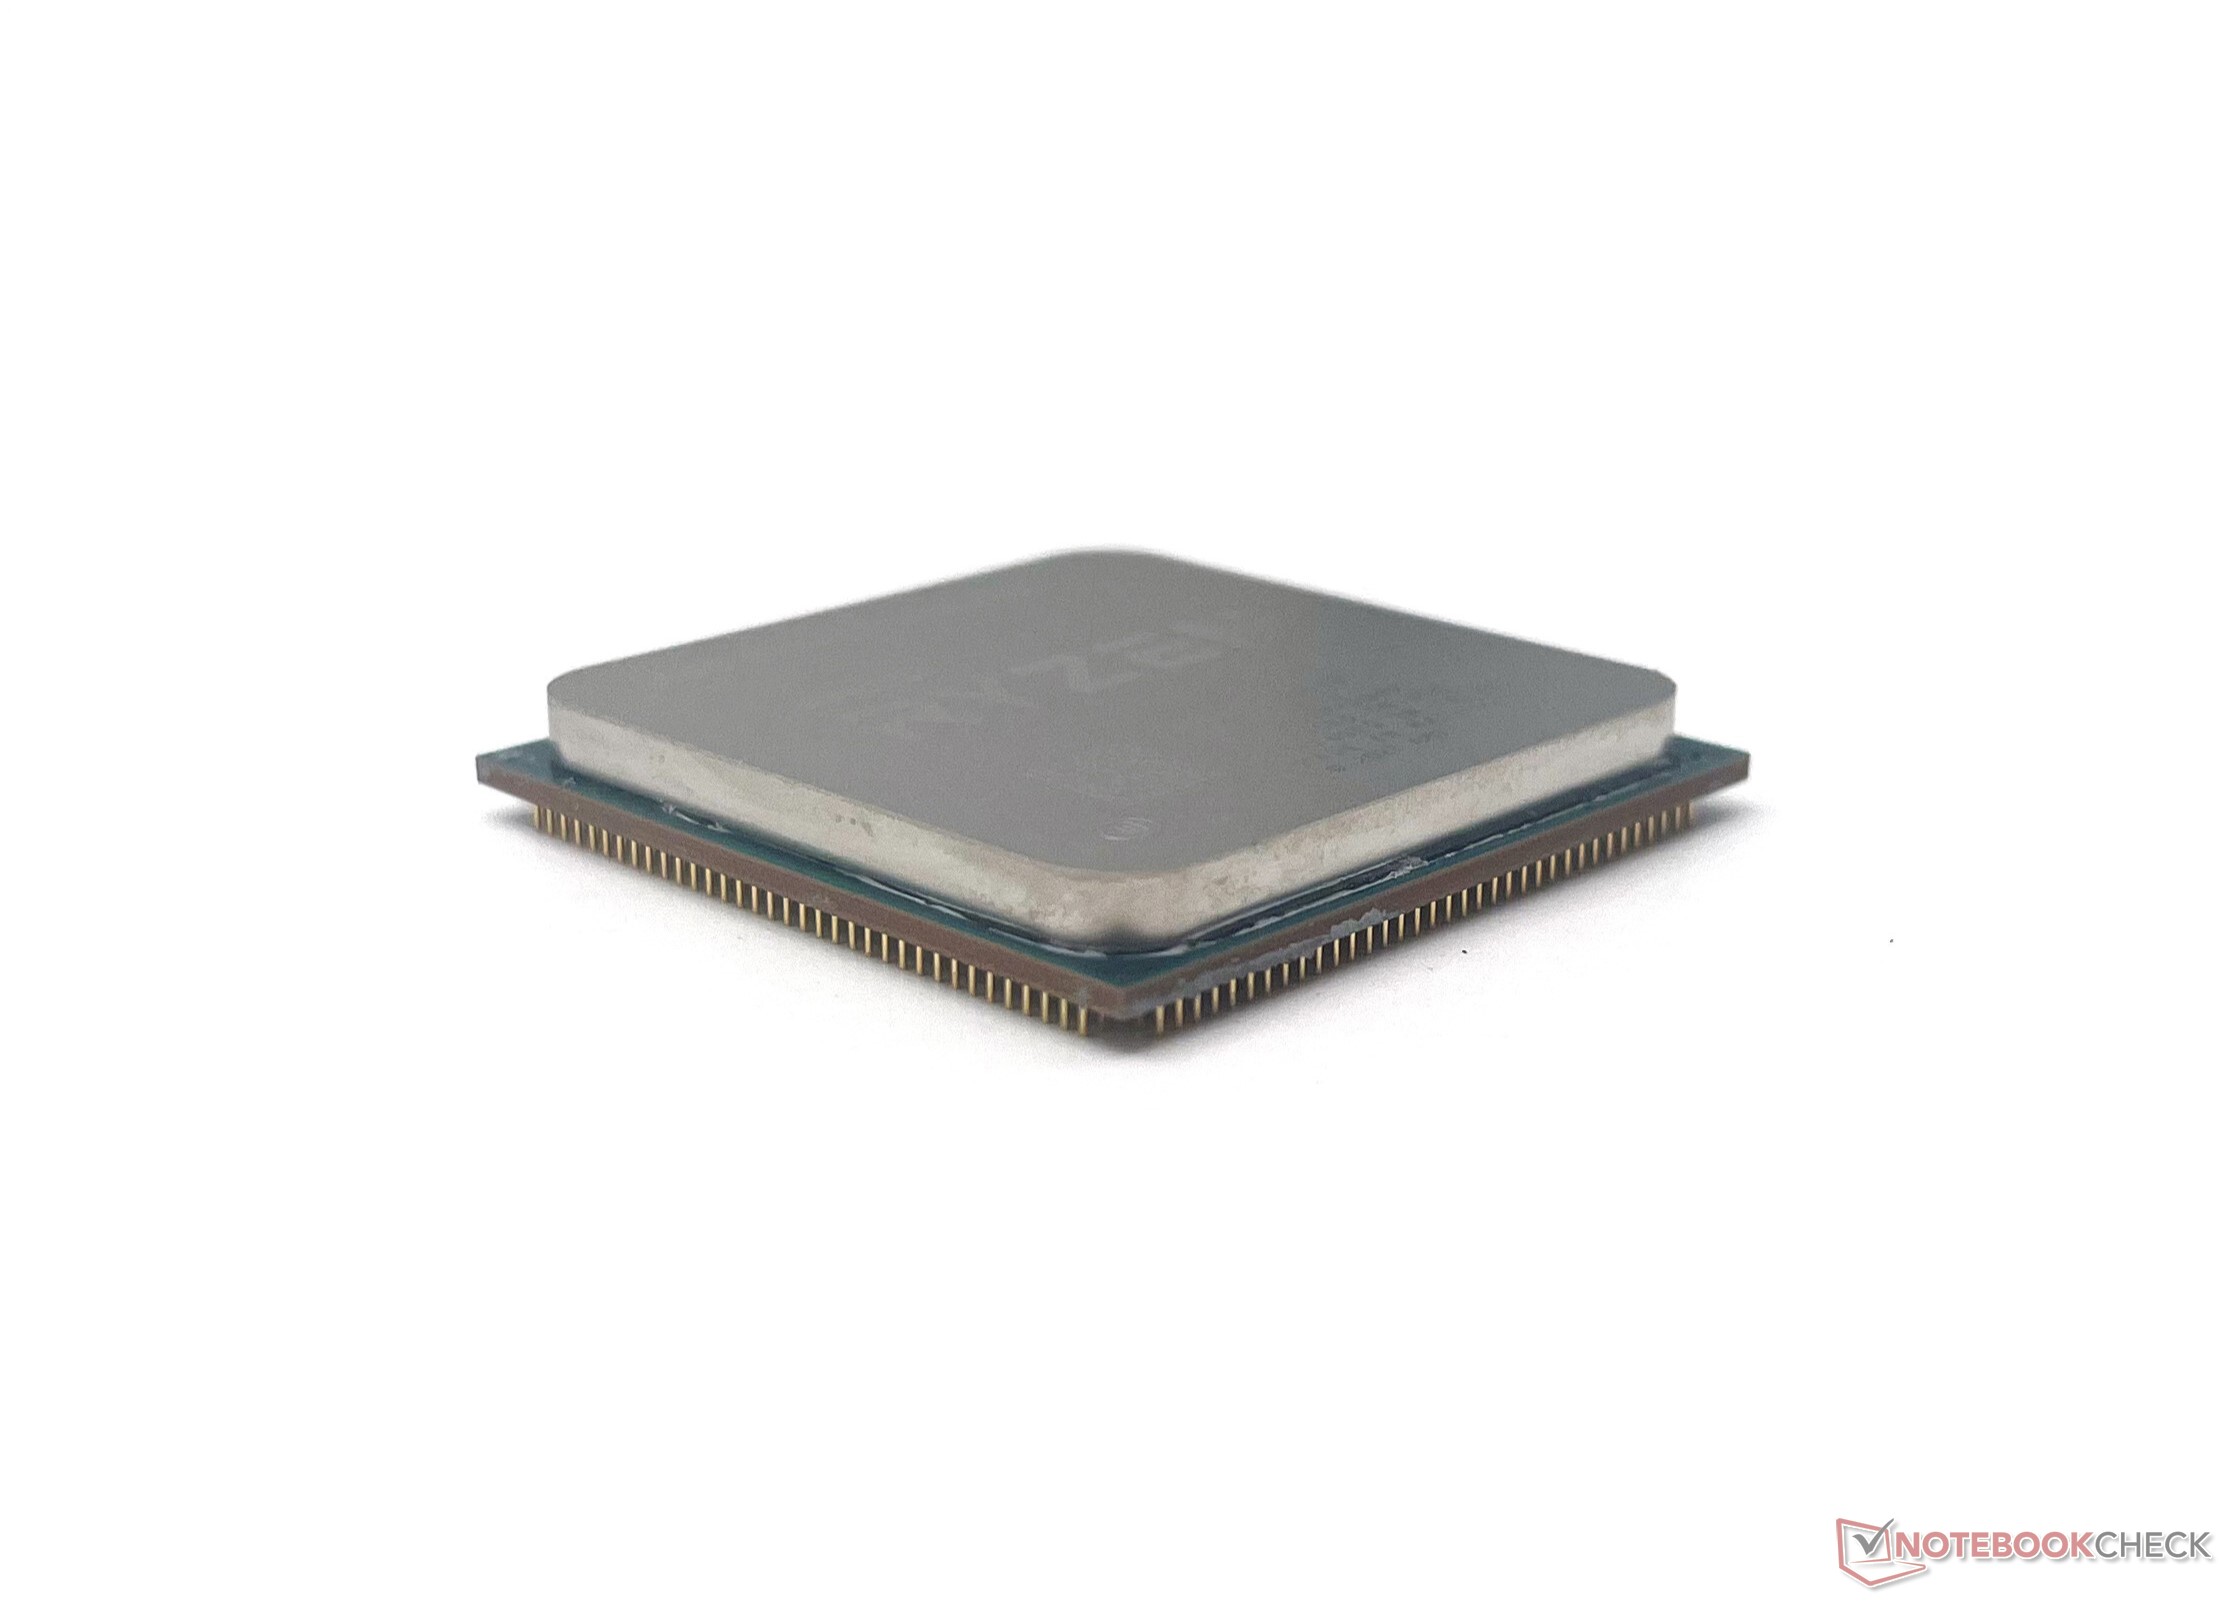
The AMD Ryzen 7 5800X3D is an 8-core desktop processor with a large level 3 cache (3DV cache) that is aimed mostly for increased gaming performance. It offers 8 Zen 3 based cores clocked at 3.4 - 4.5 GHz and therefore a bit slower than the 3.4 - 4.7 GHz of the R7 5800X. The power consumption of both chips is rated at 105 Watt (TDP) and the efficiency compared to Alder Lake desktop CPUs is rather good.

ModelRockchip RK3288AMD Ryzen 7 5800X3D
Series AMD Vermeer (Ryzen 5000)
Series: Vermeer (Ryzen 5000) Vermeer (Zen3)
newitem compare cores
HiSilicon Kirin 9000W compare1.53 - 2.49 GHz12 / 12 cores
UNISOC Tiger T310 compare1.8 - 2 GHz4 / 4 cores
Rockchip RK3288 « 1.8 GHz4 / 4 cores
Apple A6x compare1.4 GHzcores
Apple A6 compare1 GHzcores
Apple S5 compare2 / 2 cores
HiSilicon k3v2 Hi3620 compare1.2 GHz4 / 4 cores
Rockchip RK3066 1.5 GHz compare1.5 GHz2 / 2 cores
Amlogic AML8726-MX compare1.5 GHz2 / 2 cores
Rockchip RK3168 compare1.2 GHz2 / 2 cores
Rockchip RK2918 1.2 GHz compare1.2 GHz1 / 1 cores
ARM Cortex A8 1.2 GHz compare1.2 GHz1 / 1 cores
Telechips TCC8803 1GHz compare1 GHz1 / 1 cores
Loongson 2F 900MHz compare0.9 GHz1 / 1 cores
CSR8670 compare0.08 GHzcores
ARM Cortex-M4 compare cores
HiSilicon Hi6262 compare cores
DK3.5+ST comparecores
unknown compare cores
AMD Ryzen 9 5900X compare3.7 - 4.8 GHz12 / 24 cores64 MB L3
AMD Ryzen 7 5800X3D « 3.4 - 4.5 GHz8 / 16 cores96 MB L3
Clock1800 MHz3400 - 4500 MHz
Cores / Threads4 / 48 / 16
Technology28 nm7 nm
FeaturesARM MAli-T624 at 600 MHz, dedicated 2D processor, 1080P H.264, VP8, MVC encoding, 4K H.264 and 10 Bits H.265 decoding, 1080p multi video decode, Dual-channel DDR3(L) memory controller, HDMI 2.0MMX(+), SSE, SSE2, SSE3, SSSE3, SSE4.1, SSE4.2, SSE4A, x86-64, AMD-V, AES, AVX, AVX2, FMA3, SHA, Precision Boost 2
iGPUARM Mali-T760 MP4 (600 MHz)
ArchitectureARMx86
Announced
Manufacturerwww.rk3288.comwww.amd.com
CodenameVermeer (Zen3)
L1 Cache512 KB
L2 Cache4 MB
L3 Cache96 MB
TDP105 Watt
max. Temp.90 °C
SocketAM4 (1331)

Benchmarks

Performance Rating - CB R15 + R20 + 7-Zip + X265 + Blender + 3DM11 CPU - R7 5800X3D
42.7 pt (59%)
AMD Ryzen 7 5800X3D
42.7
max:
72.1 69%
0%
100%
Cinebench R23 - Cinebench R23 Multi Core
14317 Points (13%)
Cinebench R23 - Cinebench R23 Single Core
1452 Points (62%)
Cinebench R20 - Cinebench R20 CPU (Single Core)
566 Points (63%)
Cinebench R20 - Cinebench R20 CPU (Multi Core)
5479 Points (13%)
Cinebench R15 - Cinebench R15 CPU Multi 64 Bit
2413 Points (15%)
Cinebench R15 - Cinebench R15 CPU Single 64 Bit
241 Points (73%)
Cinebench R11.5 - Cinebench R11.5 CPU Multi 64 Bit
27.2 Points (35%)
Cinebench R11.5 - Cinebench R11.5 CPU Single 64 Bit
2.8 Points (69%)
Cinebench R10 - Cinebench R10 Rend. Single (32bit)
6008 Points (36%)
Cinebench R10 - Cinebench R10 Rend. Multi (32bit)
42010 Points (30%)
wPrime 2.10 - wPrime 2.0 1024m *
92.6 s (1%)
wPrime 2.10 - wPrime 2.0 32m *
3.6 s (1%)
WinRAR - WinRAR 4.0
14431 Points (23%)
7-Zip 18.03 - 7-Zip 18.03 Multli Thread 4 runs
69518 MIPS (40%)
7-Zip 18.03 - 7-Zip 18.03 Single Thread 4 runs
6799 MIPS (81%)
X264 HD Benchmark 4.0 - x264 Pass 2
138.3 fps (48%)
X264 HD Benchmark 4.0 - x264 Pass 1
292 fps (67%)
HWBOT x265 Benchmark v2.2 - HWBOT x265 4k Preset
19.1 fps (34%)
TrueCrypt - TrueCrypt Serpent
1.2 GB/s (0%)
TrueCrypt - TrueCrypt Twofish
1.9 GB/s (33%)
TrueCrypt - TrueCrypt AES
13.8 GB/s (36%)
Blender - Blender 2.79 BMW27 CPU *
212.6 Seconds (1%)
R Benchmark 2.5 - R Benchmark 2.5 *
0.5 sec (10%)
3DMark 06 - CPU - 3DMark 06 - CPU
14479 Points (31%)
Super Pi mod 1.5 XS 1M - Super Pi mod 1.5 XS 1M *
8.1 s (2%)
Super Pi mod 1.5 XS 2M - Super Pi mod 1.5 XS 2M *
17.4 s (1%)
Super Pi Mod 1.5 XS 32M - Super Pi mod 1.5 XS 32M *
385.5 s (2%)
3DMark 11 - 3DM11 Performance Physics
27236 Points (74%)
3DMark - 3DMark Ice Storm Physics
84919 Points (69%)
3DMark - 3DMark Ice Storm Extreme Physics
85531 Points (69%)
3DMark - 3DMark Ice Storm Unlimited Physics
15496 Points (13%)
3DMark - 3DMark Cloud Gate Physics
22127 Points (56%)
3DMark - 3DMark Fire Strike Standard Physics
28938 Points (52%)
3DMark - 3DMark Time Spy CPU
11809 Points (50%)
Geekbench 5.5 - Geekbench 5.1 - 5.4 64 Bit Single-Core
1622 Points (68%)
Geekbench 5.5 - Geekbench 5.1 - 5.4 64 Bit Multi-Core
10856 Points (19%)
Geekbench 5.0 - Geekbench 5.0 64 Bit Single-Core
1526 Points (7%)
Geekbench 5.0 - Geekbench 5.0 64 Bit Multi-Core
10836 Points (34%)
Geekbench 4.4 - Geekbench 4.1 - 4.4 64 Bit Single-Core
7187 Points (72%)
Geekbench 4.4 - Geekbench 4.1 - 4.4 64 Bit Multi-Core
43687 Points (48%)
Geekbench 3 - Geekbench 3 32 Bit Multi-Core
100%
1 RK3288 +
min: 1909     avg: 2183     median: 2182.5 (4%)     max: 2456 Points
Geekbench 3 - Geekbench 3 32 Bit Single-Core
100%
1 RK3288 +
min: 698     avg: 779     median: 778.5 (15%)     max: 859 Points
Mozilla Kraken 1.1 - Kraken 1.1 Total Score *
100%
1 RK3288 +
min: 4753     avg: 5809     median: 5790 (7%)     max: 6884 ms
Sunspider - Sunspider 1.0 Total Score *
100%
1 RK3288 +
min: 745     avg: 746     median: 745.5 (8%)     max: 746 ms
Octane V2 - Octane V2 Total Score
100%
1 RK3288 +
min: 5967     avg: 6798     median: 7107 (6%)     max: 7319 Points
AnTuTu v6 - AnTuTu v6 Total Score
100%
1 RK3288 +
47100 Points (16%)
PCMark for Android - PCM f. Android Work Score
100%
1 RK3288 +
3888 Points (19%)
CrossMark - CrossMark Overall
1770 Points (68%)
Power Consumption - Prime95 Power Consumption - external Monitor *
226 Watt (39%)
Power Consumption - Cinebench R15 Multi Power Consumption - external Monitor *
209 Watt (38%)
Power Consumption - Idle Power Consumption - external Monitor *
102 Watt (67%)
Power Consumption - Cinebench R15 Multi Power Efficiency - external Monitor
11.5 Points per Watt (9%)

Average Benchmarks Rockchip RK3288 → 100% n=1

Average Benchmarks AMD Ryzen 7 5800X3D → 556% n=1

- Range of benchmark values for this graphics card
- Average benchmark values for this graphics card
* Smaller numbers mean a higher performance
1 This benchmark is not used for the average calculation

Add one or more devices and compare

In the following list you can select (and also search for) devices that should be added to the comparison. You can select more than one device.

restrict list:

show all (including archived), 2024, 2023
v1.27
log 17. 18:50:07

#0 checking url part for id 6984 +0s ... 0s

#1 checking url part for id 14390 +0s ... 0s

#2 not redirecting to Ajax server +0s ... 0s

#3 did not recreate cache, as it is less than 5 days old! Created at Sun, 16 Jun 2024 05:37:17 +0200 +0.001s ... 0.001s

#4 composed specs +0.047s ... 0.048s

#5 did output specs +0s ... 0.048s

#6 getting avg benchmarks for device 6984 +0.003s ... 0.051s

#7 got single benchmarks 6984 +0.011s ... 0.062s

#8 getting avg benchmarks for device 14390 +0.016s ... 0.078s

#9 got single benchmarks 14390 +0.01s ... 0.089s

#10 got avg benchmarks for devices +0s ... 0.089s

#11 min, max, avg, median took s +0.192s ... 0.281s

#12 return log +0.054s ... 0.336s

Please share our article, every link counts!
> Expert Reviews and News on Laptops, Smartphones and Tech Innovations > Benchmarks / Tech > Processor Comparison - Head 2 Head
Redaktion, 2017-09- 8 (Update: 2023-07- 1)