Notebookcheck Logo

ARM Mali-T880 MP12 vs NVIDIA Tegra X1 Maxwell GPU

ARM Mali-T880 MP12

► remove from comparison ARM Mali-T880 MP12

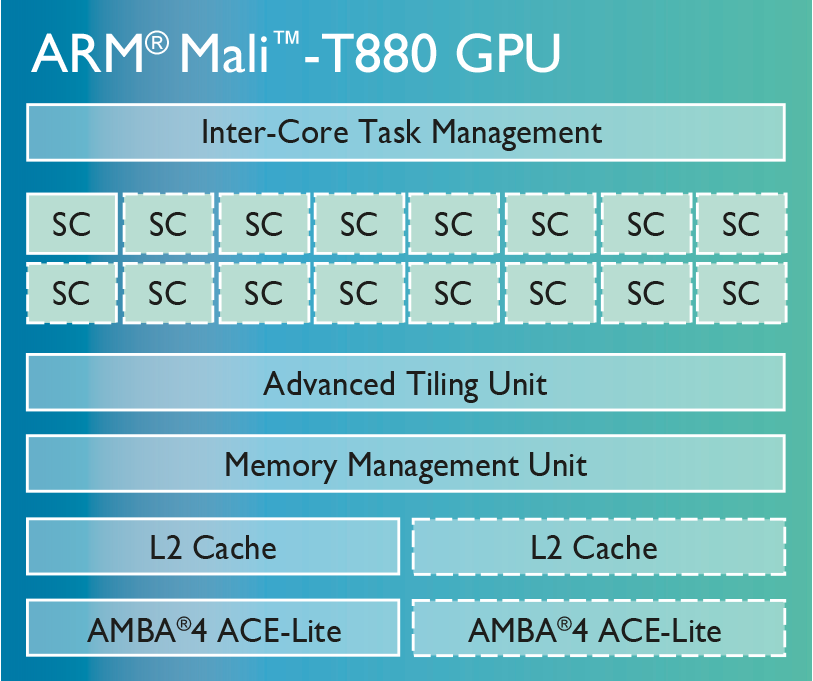
The ARM Mali-T880 MP12 is a mobile graphics solution that can be found in ARM SoCs like the Samsung Exynos 8890. The chip is available since Q1/2016 (e.g. in some of the Galaxy S7 variants) and supports OpenGL ES 3.1, OpenCL 1.2 and DirectX 11.2 (FL 11_2). The Mali-T880 can be built with 1 to 16 clusters, where the MP12 version features 12 clusters/cores.

The MP12 version that is used in the Samsung Exynos 8890 is clocked with up to 650 MHz and is a bit slower than the Adreno 530 in the Snapdragon 820 SoC. However, it still belongs to the high-end graphics cards for ARM based SoCs.

NVIDIA Tegra X1 Maxwell GPU

► remove from comparison NVIDIA Tegra X1 Maxwell GPU

The NVIDIA Tegra X1 Maxwell GPU is an integrated graphics card in the NVIDIA Tegra X1 SoC for (mostly Android based) tablets. It is the successor of the Tegra K1 GPU and based on the Maxwell architecture. It offers the same features as the laptop and desktop Maxwell based products like OpenGL 4.5, CUDA 6.0, OpenGL ES 3.1 and DirectX 11.2. The GPU offers 256 shader cores (2 SMMs) and clocks at up to 1000 MHz. The memory interface offers a maximum bandwidth of 25.6 GB/s (2x 32 Bit LPDDR4-3200).

First benchmarks of the Tegra X1 graphics card using GLBench show twice as high scores as the PowerVR GXA6850 in the Apple A8X. Therefore, the X1 should be the fastest GPU for Android based devices that should not struggle with high end Android games in high resolutions.

The improved video part of the SoC is able to en- and decode 4K videos in H.265 according to Nvidia (decoding at 60fps, encoding at 30fps). Thanks to HDMI 2.0 support, the 4K60 material can be transmitted to external displays (2 displays in parallel at max). The integrated dual ISP is able to drive up to 6 cameras (max. 100 MP, 4096 focus points) at once.

The power consumption of the whole SoC should be rather big compared to other ARM based SoCs. Therefore, Tegra X1 based smartphones are unlikely. As the Tegra K1, the X1 will be most likely seen in tablets with good cooling solutions. Similar to the Apple A8X, the Tegra X1 is manufactured in 20nm.

ARM Mali-T880 MP12NVIDIA Tegra X1 Maxwell GPU
Mali-T800 Series
Mali-T880 MP12 12 @ 0.65 GHz
Mali-T880 MP4 compare 4 @ 0.9 GHz
Mali-T880 MP2 compare 2 @ 0.9 GHz
Mali-T860 MP2 compare 2 @ 0.7 GHz
Mali-T830 MP3 compare 2 @ 0.6 GHz
Mali-T830 MP2 compare 2 @ 0.6 GHz
Mali-T830 MP1 compare 1
CodenameMidgard (4th Generation)Erista
ArchitectureMidgard (4rd-gen)Maxwell
Pipelines12 - unified256 - unified
Core Speed650 (Boost) MHz1000 MHz
Shared Memorynoyes
APIDirectX 11.2 (FL 11_2), OpenGL ES 3.1DirectX 11.2, OpenGL 4.5
technology14 nm20 nm
FeaturesOpenGL ES 3.1, OpenCL 1.2, DirectX 11.2 (FL 11_2)CUDA 6.0, OpenGL ES 3.1, AEP
Date of Announcement24.02.2016 05.01.2015
Link to Manufacturer Pagewww.arm.com
Memory Speed3200 MHz
Memory Bus Width64 Bit
CPU in Mali-T880 MP12GPU Base SpeedGPU Boost / Turbo
Samsung Exynos 8890 Octa8 x 2600 MHz650 MHz650 MHz
CPU in Tegra X1 Maxwell GPUGPU Base SpeedGPU Boost / Turbo
Nvidia Tegra X18 x 2000 MHz? MHz1000 MHz

Benchmarks

3DMark - 3DMark Ice Storm Unlimited Graphics
min: 23431     avg: 29937     median: 33031 (4%)     max: 33348 Points
min: 52816     avg: 56145     median: 57697 (7%)     max: 57922 Points
3DMark - 3DMark Ice Storm Extreme Graphics
0 Points (0%)
3DMark - 3DMark Ice Storm Graphics
0 Points (0%)
3DMark - 3DMark Sling Shot (ES 3.0) Unlimited
min: 2641     avg: 2644     median: 2644 (11%)     max: 2647 Points
3DMark - 3DMark Sling Shot (ES 3.0) Unlimited Graphics
min: 3059     avg: 3065     median: 3065 (7%)     max: 3071 Points
3DMark - 3DMark Sling Shot Extreme (ES 3.1) Unlimited
min: 2060     avg: 2147     median: 2147 (11%)     max: 2234 Points
3DMark - 3DMark Sling Shot Extreme (ES 3.1) Unlimited Graphics
min: 2257     avg: 2326     median: 2325.5 (7%)     max: 2394 Points
GFXBench - GFXBench Car Chase Offscreen
15 fps (2%)
min: 24     avg: 27     median: 27 (3%)     max: 30 fps
GFXBench 3.1 - GFXBench Manhattan ES 3.1 Offscreen
min: 26     avg: 27.3     median: 28 (1%)     max: 28 fps
min: 31     avg: 38.5     median: 38.5 (1%)     max: 46 fps
GFXBench 3.0 - GFXBench 3.0 Manhattan Offscreen
min: 38     avg: 39     median: 39 (2%)     max: 40 fps
min: 40     avg: 53.5     median: 54 (3%)     max: 65.8 fps
GFXBench (DX / GLBenchmark) 2.7
GFXBench T-Rex HD Offscreen C24Z16 + ARM Mali-T880 MP12
GFXBench (DX / GLBenchmark) 2.7 - GFXBench T-Rex HD Offscreen C24Z16
min: 80     avg: 82     median: 82 (1%)     max: 84 fps
GFXBench T-Rex HD Offscreen C24Z16 + NVIDIA Tegra X1 Maxwell GPU
min: 69     avg: 105.4     median: 123 (1%)     max: 124.2 fps
Basemark X 1.1 - Basemark X 1.1 High Quality
min: 19134     avg: 27168     median: 30097 (68%)     max: 32273 Points
min: 38721     avg: 41416     median: 41415.5 (94%)     max: 44110 Points
Basemark X 1.1 - Basemark X 1.1 Medium Quality
min: 40252     avg: 40672     median: 40671.5 (90%)     max: 41091 Points
min: 42460     avg: 43721     median: 43721 (97%)     max: 44982 Points
PassMark PerformanceTest Mobile V1 - PerformanceTest Mobile V1 2D Graphics Tests
min: 5864     avg: 6100     median: 6055 (6%)     max: 6382 Points
5215 Points (5%)
PassMark PerformanceTest Mobile V1 - PerformanceTest Mobile V1 3D Graphics Tests
min: 2094     avg: 2132     median: 2131 (4%)     max: 2172 Points
3320 Points (6%)
Smartbench 2012 - Smartbench 2012 Gaming Index
4497 Points (98%)

Average Benchmarks ARM Mali-T880 MP12 → 100% n=9

Average Benchmarks NVIDIA Tegra X1 Maxwell GPU → 141% n=9

- Range of benchmark values for this graphics card
- Average benchmark values for this graphics card
* Smaller numbers mean a higher performance
1 This benchmark is not used for the average calculation

Game Benchmarks

The following benchmarks stem from our benchmarks of review laptops. The performance depends on the used graphics memory, clock rate, processor, system settings, drivers, and operating systems. So the results don't have to be representative for all laptops with this GPU. For detailed information on the benchmark results, click on the fps number.

Dead Trigger 2

Dead Trigger 2

2013
high
100%
Mali-T880 MP12:
55 56 56 ~ 56 fps
Asphalt 8: Airborne

Asphalt 8: Airborne

2013
low
100%
Mali-T880 MP12:
30 30 ~ 30 fps
high
100%
Mali-T880 MP12:
30 30 31 ~ 30 fps
Real Racing 3

Real Racing 3

2013
high
100%
Mali-T880 MP12:
44  fps
Temple Run 2

Temple Run 2

2013
high
100%
Mali-T880 MP12:
60  fps

Average Gaming ARM Mali-T880 MP12 → 100%

Average Gaming 30-70 fps → 100%

ARM Mali-T880 MP12lowmed.highultraQHD4K
Dead Trigger 256
Asphalt 8: Airborne3030
Real Racing 344
Temple Run 260
< 30 fps
< 60 fps
< 120 fps
≥ 120 fps

1


3
1


For more games that might be playable and a list of all games and graphics cards visit our Gaming List

Add one or more devices and compare

In the following list you can select (and also search for) devices that should be added to the comparison. You can select more than one device.

restrict list:

show all (including archived), 2024, 2023
v1.26
log 04. 10:56:52

#0 checking url part for id 7237 +0s ... 0s

#1 checking url part for id 6152 +0s ... 0s

#2 not redirecting to Ajax server +0s ... 0s

#3 did not recreate cache, as it is less than 5 days old! Created at Sat, 04 May 2024 05:42:18 +0200 +0.001s ... 0.001s

#4 composed specs +0.176s ... 0.177s

#5 did output specs +0s ... 0.177s

#6 start showIntegratedCPUs +0s ... 0.177s

#7 getting avg benchmarks for device 7237 +0.03s ... 0.207s

#8 got single benchmarks 7237 +0.018s ... 0.225s

#9 getting avg benchmarks for device 6152 +0.002s ... 0.227s

#10 got single benchmarks 6152 +0.01s ... 0.237s

#11 got avg benchmarks for devices +0s ... 0.237s

#12 No cached benchmark found, getting uncached values +0.017s ... 0.254s

#13 No cached benchmark found, getting uncached values +0.006s ... 0.26s

#14 min, max, avg, median took s +0.051s ... 0.311s

#15 before gaming benchmark output +0s ... 0.311s

#16 Got 10 rows for game benchmarks. +0.01s ... 0.321s

#17 composed SQL query for gamebenchmarks +0s ... 0.321s

#18 got data and put it in $dataArray +0.002s ... 0.323s

#19 benchmarks composed for output. +0.011s ... 0.334s

#20 calculated avg scores. +0s ... 0.334s

#21 return log +0.063s ... 0.396s

Please share our article, every link counts!
> Expert Reviews and News on Laptops, Smartphones and Tech Innovations > Benchmarks / Tech > Graphics Card Comparison - Head 2 Head
Redaktion, 2017-09- 8 (Update: 2023-07- 1)