 Deutsch
 English
 Español
 Français
 Italiano
 Nederlands
 Polski
 Português
 Русский
 Türkçe
 Svenska
 Chinese
 Magyar
AMD E-450 vs Intel Atom Z3735G vs AMD E1-1500
AMD E-450
► remove from comparisonThe AMD E-450 (codename Zacate) is a dual core processor for small notebooks and netbooks. It offers a relatively powerful integrated graphics card and a single channel DDR3-1333 memory controller. Compared to the older E-350, the E-450 offers only 60MHz more clock speed, but a faster graphics card (thanks to Turbo Core) and DDR3-1333 and HDMI 1.4a support.
Inside the E-450 two Bobcat cores can access 512KB level 2 cache per core. In comparison to the Atom processors, the Bobcat architecture uses an "out-of-order" execution and is therefore faster at the same clock speed. However, the performance is far worse than similar clocked Penryn (Celeron) or Danube (Athlon II) cores. On average the cpu performance of the E-450 lies a bit beyond a Celeron SU2300 at 1.2 GHz or a Athlon II Neo K325 at 1.3 GHz.
The integrated Radeon HD 6320 graphics card offers 80 shaders and an UVD3 video processor. Compared to the slow GMA 3150 in the Atom processors, the HD6320 offers a lot more performance and is about as fast as the Nvidia ION graphics solution.
The power consumption is rated with a TDP of 18 Watt by AMD. According to first reviews of Brazos prototypes the power consumption was between 11 to 29 Watt. This would be on a level of a (much more powerful) 11" MacBook Air using Windows 7.
Intel Atom Z3735G
► remove from comparison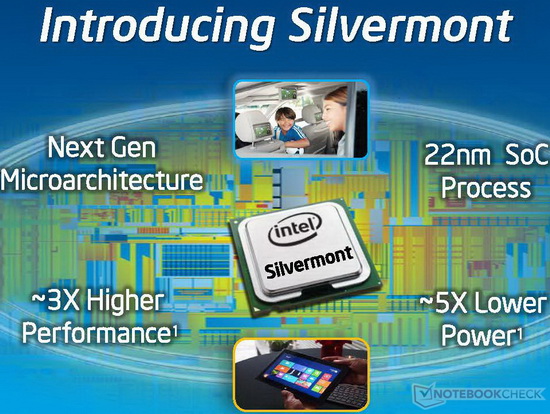
The Intel Atom Z3735G is a power-efficient quad-core SoC for tablets (mainly Android). It is clocked at 1.33 - 1.83 GHz and is part of the Bay Trail-T platform. Thanks to the specially optimized 22nm low-power design process (P1271) with Tri-Gate transistors, performance and energy efficiency have been significantly improved compared to its predecessor. In contrast to the Z3735F, the Z3735G only offers a 32 bit single-channel DDR3L-RS-1333 memory controller (max. 1 GB).
Architecture
The processor cores are based on the new Silvermont architecture, which is an out-of-order design for the first time. The increased utilization of the pipeline and many other improvements (optimized branch prediction, increased buffers, and enhanced decoders) have increased the performance per clock by about 50 percent. At the same time, however, the Hyper-Threading feature of the previous generation has been removed. Other major additions are the support for new instruction set extensions such as SSE 4.1 and 4.2 as well as AES-NI (depending on the model).
Performance
Thanks to 4 CPU cores and the improved performance per clock, the Z3735G is significantly faster than previous Intel Atoms like the Z2760. Depending on the benchmark, the Z3735G competes with AMDs Temash and Kabini APUs like the A6-1450. For everyday tasks such as Internet or Office the performance is adequate, but not for very complex software or modern games. Compared to ARM SoCs for Android systems, the Z3735G is placed in the upper mid-range segment.
Graphics
The HD Graphics (Bay Trail) is based on the Intel Gen7 architecture, which supports DirectX 11 and is also found in the Ivy Bridge series (e.g. HD Graphics 4000). With only 4 EUs (Execution Units) and a relatively low clock speed of up to 646 MHz, the GPU is even slower than the HD Graphics (Ivy Bridge). Therefore, only older and less demanding games (like simple Android titles) will run fluently. However, video acceleration and other multimedia applications are no problem for the chip.
Power Consumption
The entire SoC is rated at an SDP of 2.2 W, which indicates a TDP of less than 4 W. Thus, the chip can be used in passively cooled tablets.
AMD E1-1500
► remove from comparisonThe AMD E1-1500 (codename Zacate) is a dual core processor for small notebooks and netbooks. It offers a relatively powerful integrated graphics card and a single channel DDR3-1333 memory controller. Compared to the old E1-1200, which is based on the same chip, the E1-1500 offers an 80 MHz higher CPU and 29 MHz higher GPU clock rate.
Inside the E1-1500 two Bobcat cores can access 512KB level 2 cache per core. In comparison to the Atom processors, the Bobcat architecture uses an "out-of-order" execution and is therefore faster at the same clock speed. However, the performance is far worse than similar clocked Penryn (Celeron) or Danube (Athlon II) cores. On average the cpu performance of the E1-1500 is a bit below an Athlon X2 L310 at 1.2 GHz.
The integrated Radeon HD 7310 graphics card offers 80 shaders and an UVD3 video processor. Compared to the slow GMA 3150 in the Atom processors, the HD7310 offers a lot more performance and is about as fast as the Nvidia ION graphics solution. In the E1-1500 the 7310 is clocked at 529 MHz and therefore not much different to the HD 6310 (488 - 500 MHz depending on the APU).
The power consumption is rated with a TDP of 18 W by AMD. That's similar to Intels (faster) Ivy and Sandy Bridge ULV-CPUs.
| Model | AMD E-450 | Intel Atom Z3735G | AMD E1-1500 | ||||||||||||||||||||||||||||||||||||||||||||||||||||||||||||||||||||||||||||||||||||||||||||||||||||||||||||||||||||||||||||||||||||||||
| Series | AMD E-Series | Intel Atom | AMD E-Series | ||||||||||||||||||||||||||||||||||||||||||||||||||||||||||||||||||||||||||||||||||||||||||||||||||||||||||||||||||||||||||||||||||||||||
| Codename | Zacate | Bay Trail-T | Zacate | ||||||||||||||||||||||||||||||||||||||||||||||||||||||||||||||||||||||||||||||||||||||||||||||||||||||||||||||||||||||||||||||||||||||||
| Series: E-Series Zacate |
|
|
| ||||||||||||||||||||||||||||||||||||||||||||||||||||||||||||||||||||||||||||||||||||||||||||||||||||||||||||||||||||||||||||||||||||||||
| Clock | 1650 MHz | 1330 - 1830 MHz | 1480 MHz | ||||||||||||||||||||||||||||||||||||||||||||||||||||||||||||||||||||||||||||||||||||||||||||||||||||||||||||||||||||||||||||||||||||||||
| L1 Cache | 128 KB | 224 KB | 128 KB | ||||||||||||||||||||||||||||||||||||||||||||||||||||||||||||||||||||||||||||||||||||||||||||||||||||||||||||||||||||||||||||||||||||||||
| L2 Cache | 1 MB | 2 MB | 1 MB | ||||||||||||||||||||||||||||||||||||||||||||||||||||||||||||||||||||||||||||||||||||||||||||||||||||||||||||||||||||||||||||||||||||||||
| Cores / Threads | 2 / 2 | 4 / 4 | 2 / 2 | ||||||||||||||||||||||||||||||||||||||||||||||||||||||||||||||||||||||||||||||||||||||||||||||||||||||||||||||||||||||||||||||||||||||||
| TDP | 18 Watt | <4 Watt | 18 Watt | ||||||||||||||||||||||||||||||||||||||||||||||||||||||||||||||||||||||||||||||||||||||||||||||||||||||||||||||||||||||||||||||||||||||||
| Technology | 40 nm | 22 nm | 40 nm | ||||||||||||||||||||||||||||||||||||||||||||||||||||||||||||||||||||||||||||||||||||||||||||||||||||||||||||||||||||||||||||||||||||||||
| Die Size | 75 mm2 | 75 mm2 | |||||||||||||||||||||||||||||||||||||||||||||||||||||||||||||||||||||||||||||||||||||||||||||||||||||||||||||||||||||||||||||||||||||||||
| Socket | FT1 BGA 413-Ball | UTFCBGA592 | FT1 BGA 413-Ball | ||||||||||||||||||||||||||||||||||||||||||||||||||||||||||||||||||||||||||||||||||||||||||||||||||||||||||||||||||||||||||||||||||||||||
| Features | MMX(+), SSE(1,2,3,3S,4A), AMD-V | Intel HD Graphics (Bay Trail, 313 - 646 MHz), Quick Sync, Wireless Display, Clear Video HD, Intel 64, SSE 4.1, SSE 4.2, AES-NI, Secure Key, Anti-Theft, Identify-Protection, max. 1 GB Single-Channel (32 Bit) DDR3L-RS 1333, Quick Sync | MMX(+), SSE(1,2,3,3S,4A), AMD-V | ||||||||||||||||||||||||||||||||||||||||||||||||||||||||||||||||||||||||||||||||||||||||||||||||||||||||||||||||||||||||||||||||||||||||
| Architecture | x86 | x86 | x86 | ||||||||||||||||||||||||||||||||||||||||||||||||||||||||||||||||||||||||||||||||||||||||||||||||||||||||||||||||||||||||||||||||||||||||
| Announced | |||||||||||||||||||||||||||||||||||||||||||||||||||||||||||||||||||||||||||||||||||||||||||||||||||||||||||||||||||||||||||||||||||||||||||
| iGPU | Intel HD Graphics (Bay Trail) (311 - 646 MHz) | ||||||||||||||||||||||||||||||||||||||||||||||||||||||||||||||||||||||||||||||||||||||||||||||||||||||||||||||||||||||||||||||||||||||||||
| $17 U.S. | |||||||||||||||||||||||||||||||||||||||||||||||||||||||||||||||||||||||||||||||||||||||||||||||||||||||||||||||||||||||||||||||||||||||||||
| Manufacturer | ark.intel.com |

