Notebookcheck Logo

Apple A9 vs Mediatek MT6582M

Apple A9

► remove from comparison Apple A9

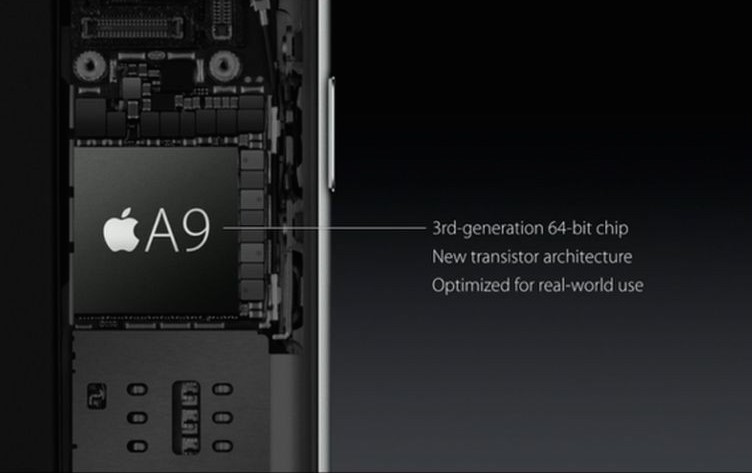
The Apple A9 is a high-end dual-core ARM SoC for smartphones. It was announced in Sept. 2015 in the new iPhone 6s and 6s Plus. Technical details were not published, but the CPU part should be about 70% and the GPU 90% faster than the previous Apple A8. Therefore, the performance should be on par with high-end Android SoCs in 2015.

It is based on the third generation of Apples 64 Bit architectures (Cyclone 3?) and uses a "new transistor technology". It is manufactured at Samsung in 14nm (slightly smaller die) and TSMC at 16nm (both FINFET 3D transistors). A performance difference of both versions are not noticable.

Furthermore, the chip now integrates the M9 motion coprocessor and a 4K video de- and encoder (as the iPhones 6s supports 4K video recording). The integrated graphics card should be still based on PowerVR technology.

The power consumption could be lower than the A8 due to the new process technology and the fact that the iPhones now got a smaller battery (due to the haptic engine part).

Mediatek MT6582M

► remove from comparison  MT6582M

The Mediatek MT6582M is a system-on-a-chip (SoC) for low-cost tablets and smartphones. It is manufactured in 28 nm and offers a quad-core Cortex-A7 processor as well as an ARM Mali-400 MP2 GPU clocked at 416 MHz. Furthermore, the chip supports dual SIM, UMTS and HSPA+, WiFi, FM, Bluetooth and GPS. 

The CPU performance of the MT6582M is similar to other Cortex-A7 SoCs clocked at the same frequency. Depending on the benchmark, the CPU power is roughly comparable with the Nvidia Tegra 3 and sufficient for everyday applications such as browsing. The GPU will handle only simple Android games in moderate resolutions.

ModelApple A9Mediatek MT6582M
SeriesApple Mediatek
CodenameCyclone 3Cortex-A7
Series: Mediatek Cortex-A7
Apple A9X compare2.26 GHz2 / 2 cores Cyclone 3
Apple A9 « 1.8 GHz2 / 2 cores Cyclone 3
Mediatek MT6592 compare1.7 GHz8 / 8 cores Cortex-A7
Mediatek MT8127 compare1.5 GHz4 / 4 cores Cortex-A7
Mediatek MT6589T compare1.5 GHz4 / 4 cores Cortex-A7
Mediatek MT8389 compare1.2 GHz4 / 4 cores Cortex-A7
Mediatek MT8125 compare1.2 GHz4 / 4 cores Cortex-A7
Mediatek MT8321 compare1.3 GHz4 / 4 cores Cortex-A7
Mediatek MT8121 compare1.3 GHz4 / 4 cores Cortex-A7
Mediatek MT6582 compare1.3 GHz4 / 4 cores Cortex-A7
Mediatek MT6582M « 1.3 GHz4 / 4 cores Cortex-A7
Mediatek MT6580M compare1.3 GHz4 / 4 cores Cortex-A7
Mediatek MT6589 compare1.2 GHz4 / 4 cores Cortex-A7
MediaTek MT6572 compare1.2 GHz2 / 2 cores Cortex-A7
Clock1800 MHz1300 MHz
Cores / Threads2 / 24 / 4
Technology14/16 nm28 nm
FeaturesARMv8 Instruction SetMali-400 MP2 @ 416 MHz, HSPA+, TD-SCDMA, Wi-Fi, Bluetooth, GPS, FM
iGPUApple A9 / PowerVR GT7600ARM Mali-400 MP2 (416 MHz)
ArchitectureARMARM
Announced
L1 Cache128 KB
L2 Cache512 KB
Manufacturerwww.mediatek.com

Benchmarks

3DMark - 3DMark Ice Storm Physics
100%
1 MT6582M +
min: 7360     avg: 7757     median: 7782 (6%)     max: 8128 Points
3DMark - 3DMark Ice Storm Extreme Physics
100%
1 MT6582M +
min: 7516     avg: 7961     median: 8016 (7%)     max: 8350 Points
3DMark - 3DMark Ice Storm Unlimited Physics
100%
A9 +
min: 12854     avg: 13248     median: 13210.5 (11%)     max: 13717 Points
min: 8505     avg: 8558     median: 8558 (7%)     max: 8611 Points
3DMark - 3DMark Sling Shot Extreme (ES 3.1) Unlimited Physics
100%
1 A9 +
1094 Points (13%)
3DMark - 3DMark Sling Shot (ES 3.0) Unlimited Physics
100%
1 A9 +
1093 Points (12%)
Geekbench 5.5 - Geekbench 5.1 - 5.4 64 Bit Single-Core
100%
1 A9 +
531 Points (22%)
Geekbench 5.5 - Geekbench 5.1 - 5.4 64 Bit Multi-Core
100%
1 A9 +
970 Points (2%)
Geekbench 4.4 - Geekbench 4.1 - 4.4 64 Bit Single-Core
100%
1 A9 +
2556 Points (26%)
Geekbench 4.4 - Geekbench 4.1 - 4.4 64 Bit Multi-Core
100%
1 A9 +
4459 Points (5%)
Geekbench 4.0 - Geekbench 4.0 64 Bit Single-Core
100%
1 A9 +
min: 2503     avg: 2527     median: 2526.5 (34%)     max: 2550 Points
Geekbench 4.0 - Geekbench 4.0 64 Bit Multi-Core
100%
1 A9 +
min: 4286     avg: 4359     median: 4359 (11%)     max: 4432 Points
Geekbench 3 - Geekbench 3 64 Bit Multi-Core
100%
1 A9 +
min: 4386     avg: 4412     median: 4422 (7%)     max: 4429 Points
Geekbench 3 - Geekbench 3 64 Bit Single-Core
100%
1 A9 +
min: 2533     avg: 2537     median: 2538 (38%)     max: 2539 Points
Geekbench 3 - Geekbench 3 32 Bit Multi-Core
100%
1 MT6582M +
min: 1157     avg: 1173     median: 1179 (2%)     max: 1182 Points
Geekbench 3 - Geekbench 3 32 Bit Single-Core
100%
1 MT6582M +
min: 346     avg: 349.7     median: 350 (7%)     max: 353 Points
Geekbench 2 - 32 Bit - Geekbench Stream
100%
1 MT6582M +
377 Points (3%)
Geekbench 2 - 32 Bit - Geekbench Memory
100%
1 MT6582M +
1015 Points (9%)
Geekbench 2 - 32 Bit - Geekbench Floating Point
100%
1 MT6582M +
2127 Points (4%)
Geekbench 2 - 32 Bit - Geekbench Integer
100%
1 MT6582M +
1255 Points (3%)
Geekbench 2 - 32 Bit - Geekbench Total Score
100%
1 MT6582M +
1424 Points (4%)
Linpack Android / IOS - Linpack Multi Thread
100%
A9 +
min: 1225     avg: 1260     median: 1260 (43%)     max: 1295 MFLOPS
min: 168     avg: 220.2     median: 238.2 (8%)     max: 254.4 MFLOPS
Linpack Android / IOS - Linpack Single Thread
100%
A9 +
min: 669     avg: 677     median: 677 (66%)     max: 685 MFLOPS
min: 81.7     avg: 95.4     median: 87.8 (9%)     max: 116.6 MFLOPS
Mozilla Kraken 1.1 - Kraken 1.1 Total Score *
100%
A9 +
min: 1458     avg: 1656     median: 1712 (2%)     max: 1743 ms
min: 15717     avg: 16521     median: 15906 (19%)     max: 17941 ms
Sunspider - Sunspider 1.0 Total Score *
100%
A9 +
223 ms (2%)
min: 1331     avg: 1442     median: 1441.5 (16%)     max: 1552 ms
Sunspider - Sunspider 0.9.1 Total Score *
100%
1 MT6582M +
min: 1578     avg: 1728     median: 1727.5 (16%)     max: 1877 ms
Octane V2 - Octane V2 Total Score
100%
A9 +
min: 15967     avg: 16716     median: 16375 (15%)     max: 18148 Points
min: 1424     avg: 1925     median: 2172 (2%)     max: 2179 Points
Vellamo 3.x - Vellamo 3.x Metal
100%
1 MT6582M +
719 Points (19%)
Vellamo 3.x - Vellamo 3.x Multicore Beta
100%
1 MT6582M +
1210 Points (27%)
Vellamo 3.x - Vellamo 3.x Browser
100%
1 MT6582M +
1734 Points (23%)
Quadrant Standard Edition 2.0 - Quadrant Standard 2.0 Total Score
100%
1 MT6582M +
min: 5841     avg: 6498     median: 6498 (15%)     max: 7155 points
AnTuTu v4 - AnTuTu v4 Total Score
100%
1 MT6582M +
min: 17300     avg: 17304     median: 17304 (40%)     max: 17308 Points
AnTuTu v5 - AnTuTu v5 Total Score
100%
A9 +
min: 58869     avg: 58977     median: 58976.5 (59%)     max: 59084 Points
18409 Points (19%)
AnTuTu v6 - AnTuTu v6 Total Score
100%
1 A9 +
min: 126969     avg: 129767     median: 128706 (44%)     max: 133626 Points
AndEBench - AndEBench Java
100%
1 MT6582M +
min: 326     avg: 343.7     median: 347 (11%)     max: 358 Iter./s
AndEBench - AndEBench Native
100%
1 MT6582M +
min: 6115     avg: 6635     median: 6790 (22%)     max: 7001 Iter./s
PassMark PerformanceTest Mobile V1 - PerformanceTest Mobile V1 CPU Tests
100%
A9 +
min: 46285     avg: 48479     median: 48849 (6%)     max: 49934 Points
min: 9254     avg: 9564     median: 9264 (1%)     max: 10173 Points
PCMark for Android - PCM f. Android Work Score
100%
1 MT6582M +
1938 Points (10%)

Average Benchmarks Apple A9 → 100% n=8

Average Benchmarks Mediatek MT6582M → 41% n=8

- Range of benchmark values for this graphics card
- Average benchmark values for this graphics card
* Smaller numbers mean a higher performance
1 This benchmark is not used for the average calculation

Add one or more devices and compare

In the following list you can select (and also search for) devices that should be added to the comparison. You can select more than one device.

restrict list:

show all (including archived), 2024, 2023
v1.27
log 03. 23:37:50

#0 checking url part for id 7085 +0s ... 0s

#1 checking url part for id 5842 +0s ... 0s

#2 not redirecting to Ajax server +0s ... 0s

#3 did not recreate cache, as it is less than 5 days old! Created at Sat, 01 Jun 2024 05:37:57 +0200 +0.001s ... 0.001s

#4 composed specs +0.052s ... 0.052s

#5 did output specs +0s ... 0.052s

#6 getting avg benchmarks for device 7085 +0.003s ... 0.056s

#7 got single benchmarks 7085 +0.01s ... 0.065s

#8 getting avg benchmarks for device 5842 +0.003s ... 0.069s

#9 got single benchmarks 5842 +0.013s ... 0.082s

#10 got avg benchmarks for devices +0s ... 0.082s

#11 min, max, avg, median took s +0.123s ... 0.205s

#12 return log +0.022s ... 0.227s

Please share our article, every link counts!
> Expert Reviews and News on Laptops, Smartphones and Tech Innovations > Benchmarks / Tech > Processor Comparison - Head 2 Head
Redaktion, 2017-09- 8 (Update: 2023-07- 1)