

AMD A6-8500P vs AMD FX-9830P vs AMD Pro A12-8800B
AMD A6-8500P
► remove from comparison
The AMD A6-8500P is a low-end Carrizo APU (6th APU generation) of 2015 for mainstream laptops. It is a SoC that contains one Excavator CPU modules (with 2 integer and 1 FP units counted as 2 compute cores), a Radeon R7 graphics card with 4 compute cores (256 shaders), a DDR3-1600 memory controller and a video engine (including UVD 6 with hardware HEVC / H.265 decoding).
Due to the single module configuration, the A6-8500P is a lot slower than the other Carrizo models with two modules (four cores). While the single thread performance should be similar to a Core i3-4030U, the Multi-Threading scores are only comparable to a Celeron N2940. For low demanding tasks like office and web-browsing, the performance however should be sufficient.
More technical details and features of the 6th generation of APUs (Carrizo) can be found in our launch article.
AMD FX-9830P
► remove from comparison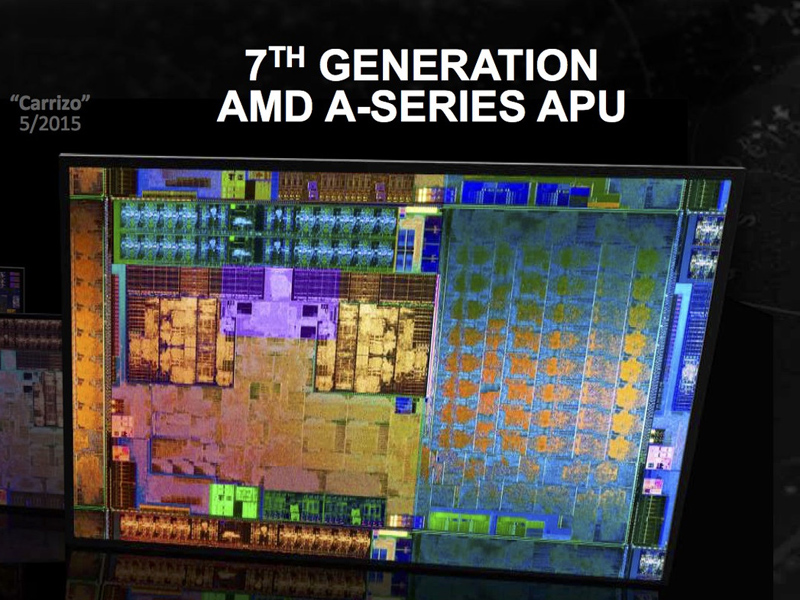
The AMD FX-9830P is a mobile mainstream SoC from the Bristol-Ridge APU series for notebooks (7th APU generation), which was announced mid 2016. The FX-9830P is the fastest Bristol Ridge APU with a 45-Watt TDP and the successor to the 15-35-Watt FX-8800P from the Carrizo generation. The chip has four CPU cores (two Excavator modules = 4 integer and 2 FP units), a Radeon R7 GPU as well as a dual-channel DDR4-1866 memory controller. Carrizo is a full-fledged SoC and is also equipped with an integrated chipset, which provides all I/0 ports.
Architecture
Bristol Ridge is the successor of the Carrizo architecture and the design is almost identical. Thanks to optimized manufacturing processes and more aggressive Boost behavior, however, the clocks are a bit higher at the same power consumption. The memory controller now also supports DDR4-RAM, in this case up to 2400 MHz. More technical details are available in the following articles:
Performance
Thanks to higher clocks, the FX9830P is slightly ahead of the old 35-Watt top model FX-8800P and competes with the entry-level dual-cores from Intel (Skylake and Kaby Lake). Compared to the Intel model, the AMD chip has a small advantage in multi-thread scenarios, but is beaten when you only stress one or two cores.
This means there is sufficient performance for typical office and web applications as well as light multitasking.
Graphics Card
The integrated Radeon R7 (Bristol Ridge) GPU has 512 active shader units (8 compute cores) clocked at up to 900 MHz (compared to 758 MHz for FX-9800P). Thanks to the better utilization of the clock range as well as faster DDR4-RAm, the GPU can slightly beat its predecessors Radeon R7 (Carrizo) and competes with a dedicated GeForce 920MX in the best-case scenario (dual-channel memory). Many games from 2015/2016 can be played smoothly at low settings.
Power Consumption
AMD specifies the TDP of the FX-9830P with 25-45 Watts, which is comparable to Intel quad-core processors from the H-series. This means the APU is a good choice for big and heavy notebooks with at least 15 inches.
AMD Pro A12-8800B
► remove from comparison
The AMD Pro A12-8800B is the top-tier Carrizo APU of 2015 for business laptops. It is a SoC containing two Excavator CPU modules (with 4 integer and 2 FP units counted as 4 compute cores), a Radeon R7 graphics card with 8 compute cores (512 shaders), a DDR3-2133 (35 Watt cTDP) memory controller and a video engine (including UVD 6 with hardware HEVC / H.265 decoding). It is similar to the consumer version, the FX-8800P, but offers business support and a ensure a long-tail support program.
The performances of the CPU and GPU cores depend on the configurable TDP. This cTDP can range from 12 to 35 Watts depending on the cooling solution and size of the laptop. Thus, clock speeds of the compute cores will vary. E.g., the GPU can score between 1992 points (15 Watts) to 2753 points (+38% with 35 Watts cTDP) in 3DMark 11 (based on the similar FX-8800P).
According to AMD, the 35 Watt configuration scores 12% (Cinebench single-thread) and 15% (Cinebench Multi-threaded) higher compared to the previous Steamroller generation (most likely the AMD FX-7600P). If configured to 15 Watt instead, the gains are higher (40% to 55%) compared to the 19 Watt Kaveri FX-7500 APU. See more benchmarks on our FX-8800P page.
More technical details and features of the 6th generation of APUs (Carrizo) can be found in our launch article.
| Model | AMD A6-8500P | AMD FX-9830P | AMD Pro A12-8800B | ||||||||||||||||||||||||||||||||||||||||||||||||||||||||||||||||||||||||||||||||||||||||||||||||||||
| Codename | Carrizo | Bristol Ridge | Carrizo | ||||||||||||||||||||||||||||||||||||||||||||||||||||||||||||||||||||||||||||||||||||||||||||||||||||
| Series | AMD Carrizo | AMD Bristol Ridge | AMD Carrizo | ||||||||||||||||||||||||||||||||||||||||||||||||||||||||||||||||||||||||||||||||||||||||||||||||||||
| Series: Carrizo Carrizo |
|
|
| ||||||||||||||||||||||||||||||||||||||||||||||||||||||||||||||||||||||||||||||||||||||||||||||||||||
| Clock | 1600 - 3000 MHz | 3000 - 3700 MHz | 2100 - 3400 MHz | ||||||||||||||||||||||||||||||||||||||||||||||||||||||||||||||||||||||||||||||||||||||||||||||||||||
| L2 Cache | 1 MB | 2 MB | 2 MB | ||||||||||||||||||||||||||||||||||||||||||||||||||||||||||||||||||||||||||||||||||||||||||||||||||||
| Cores / Threads | 2 / 2 | 4 / 4 | 4 / 4 | ||||||||||||||||||||||||||||||||||||||||||||||||||||||||||||||||||||||||||||||||||||||||||||||||||||
| TDP | 15 Watt | 45 Watt | 15 Watt | ||||||||||||||||||||||||||||||||||||||||||||||||||||||||||||||||||||||||||||||||||||||||||||||||||||
| Transistors | 3100 Million | 3100 Million | 3100 Million | ||||||||||||||||||||||||||||||||||||||||||||||||||||||||||||||||||||||||||||||||||||||||||||||||||||
| Technology | 28 nm | 28 nm | 28 nm | ||||||||||||||||||||||||||||||||||||||||||||||||||||||||||||||||||||||||||||||||||||||||||||||||||||
| Socket | FP4 BGA | FP4 BGA | |||||||||||||||||||||||||||||||||||||||||||||||||||||||||||||||||||||||||||||||||||||||||||||||||||||
| Features | HSA 1.0 | Dual-Channel DDR3/DDR4-1866 Memory Controller, PCIe 3.0 x8 | HSA 1.0 | ||||||||||||||||||||||||||||||||||||||||||||||||||||||||||||||||||||||||||||||||||||||||||||||||||||
| iGPU | AMD Radeon R5 (Carrizo) ( - 800 MHz) | AMD Radeon R7 (Bristol Ridge) ( - 900 MHz) | AMD Radeon R7 (Carrizo) ( - 800 MHz) | ||||||||||||||||||||||||||||||||||||||||||||||||||||||||||||||||||||||||||||||||||||||||||||||||||||
| Architecture | x86 | x86 | x86 | ||||||||||||||||||||||||||||||||||||||||||||||||||||||||||||||||||||||||||||||||||||||||||||||||||||
| Announced | |||||||||||||||||||||||||||||||||||||||||||||||||||||||||||||||||||||||||||||||||||||||||||||||||||||||
| Manufacturer | products.amd.com | products.amd.com | |||||||||||||||||||||||||||||||||||||||||||||||||||||||||||||||||||||||||||||||||||||||||||||||||||||
| Die Size | 250 mm2 | ||||||||||||||||||||||||||||||||||||||||||||||||||||||||||||||||||||||||||||||||||||||||||||||||||||||
| max. Temp. | 90 °C |

Benchmarks

Average Benchmarks AMD FX-9830P → 0% n=0
Average Benchmarks AMD Pro A12-8800B → 0% n=0
* Smaller numbers mean a higher performance
1 This benchmark is not used for the average calculation