Notebookcheck Logo

Apple A10X Fusion vs Apple A9X

Apple A10X Fusion

► remove from comparison

The Apple A10X Fusion is a system on a chip (SoC) from Apple that is built into the 2017 iPad Pro models. It integrates six 64 Bit cores that are divided in two clusters. Three high performance cores are clocked at up to 2.39 GHz. The three power saving cores are used for non demanding tasks. It looks like only one of both clusters is able to run at a time (therefore the apps see only three cores). The principle is similar to the first generation of ARMs big.LITTLE concept.

The performance of the SoC is positioned in the high and and clearly faster than all previous Apple SoCs. Even compared to Android high-end SoCs like the Snapdragon 835, the A10X takes the lead (e.g. in Geekbench or Antutu).

The integrated graphics card of the SoC will most likely stem from PowerVR (again) and features 12 cores instead of 6 in the A10 SoC.

According to TechInsights, the A10X is manufactured in the brand new 10 nm FinFet process at TSMC. Altough it offers more function blocks, the A10X is with measured 96.4 mm2 significantly smaller than the previous A9X (143.9 mm2).

Apple A9X

► remove from comparison Apple A9X

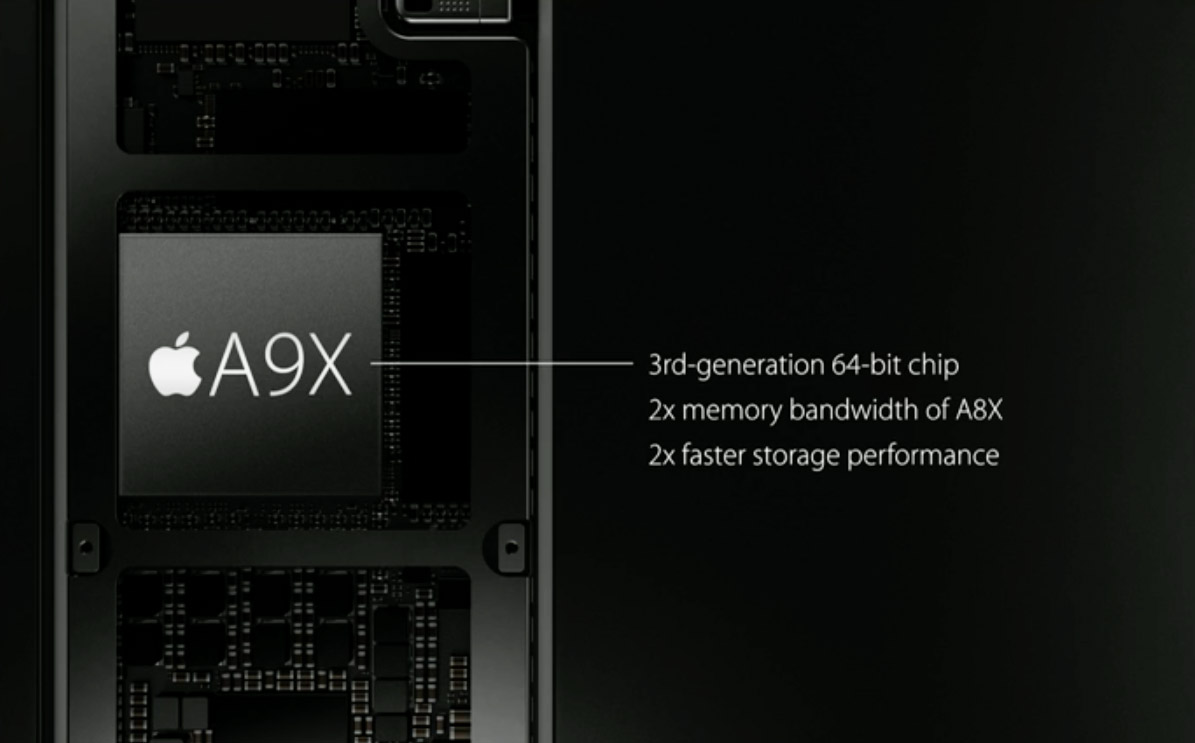
The Apple A9X is a high-end ARM SoC (System on a Chip) that was announced in September 2015 in the iPad Pro. Technical details are scarce, what we know is that it is based on the third generation of Apples 64 Bit architecture (Cyclone 3) and manufactured with a "new transistor technology" (14 or 16nm FINFet probably).

The performance of the A9X did improve a lot according to Apple. The CPU part should be 1.8x faster and the GPU part even 2x faster than the already speedy Apple A8X. Apple even stated in the keynote of the iPad Pro that the performance should be "faster than 80% of portable PCs shipped in the last 12 month". Furthermore the iPad Pro now features a 2x higher memory bandwidth (DDR4?) and 2x faster storage performance. The integrated graphics card will most likely be a PowerVR design again (Power VR Series7?).

ModelApple A10X FusionApple A9X
SeriesApple Apple A-SeriesApple
CodenameCyclone 4?Cyclone 3
Clock2390 MHz2260 MHz
Cores / Threads6 / 32 / 2
Transistors3300 Million
Technology10 nm14/16 nm
FeaturesARMv8 Instruction SetARMv8 Instruction Set
iGPUApple A10X Fusion GPU / PowerVRApple A9X / PowerVR Series 7XT
ArchitectureARMARM
Announced
Series: Cyclone 3
Apple A9X « 2.26 GHz2 / 2 cores Cyclone 3
Apple A9 compare1.8 GHz2 / 2 cores Cyclone 3
Die Size147 mm2

Benchmarks

3DMark - 3DMark Ice Storm Unlimited Physics
min: 19534     avg: 19551     median: 19550.5 (16%)     max: 19567 Points
81%
A9X +
min: 15473     avg: 15748     median: 15748 (13%)     max: 16023 Points
3DMark - 3DMark Sling Shot Extreme (ES 3.1) Unlimited Physics
min: 2036     avg: 2323     median: 2323 (27%)     max: 2610 Points
74%
A9X +
1713 Points (20%)
3DMark - 3DMark Sling Shot (ES 3.0) Unlimited Physics
min: 2145     avg: 2370     median: 2369.5 (27%)     max: 2594 Points
70%
A9X +
1649 Points (19%)
Geekbench 5.5 - Geekbench 5.1 - 5.4 64 Bit Single-Core
850 Points (36%)
Geekbench 5.5 - Geekbench 5.1 - 5.4 64 Bit Multi-Core
2324 Points (4%)
Geekbench 4.4 - Geekbench 4.1 - 4.4 64 Bit Single-Core
min: 3924     avg: 3929     median: 3928.5 (39%)     max: 3933 Points
79%
A9X +
3097 Points (31%)
Geekbench 4.4 - Geekbench 4.1 - 4.4 64 Bit Multi-Core
min: 9293     avg: 9326     median: 9325.5 (10%)     max: 9358 Points
57%
A9X +
5284 Points (6%)
Geekbench 3 - Geekbench 3 64 Bit Multi-Core
100%
1 A9X +
min: 5268     avg: 5344     median: 5343.5 (8%)     max: 5419 Points
Geekbench 3 - Geekbench 3 64 Bit Single-Core
100%
1 A9X +
min: 3079     avg: 3140     median: 3139.5 (47%)     max: 3200 Points
Linpack Android / IOS - Linpack Multi Thread
100%
1 A9X +
min: 1550     avg: 1560     median: 1559.5 (53%)     max: 1569 MFLOPS
Linpack Android / IOS - Linpack Single Thread
100%
1 A9X +
855 MFLOPS (84%)
Mozilla Kraken 1.1 - Kraken 1.1 Total Score *
min: 969     avg: 971     median: 971 (1%)     max: 973 ms
99%
A9X +
min: 1499     avg: 1523     median: 1522.5 (2%)     max: 1546 ms
Sunspider - Sunspider 1.0 Total Score *
100%
1 A9X +
181 ms (2%)
Octane V2 - Octane V2 Total Score
min: 30333     avg: 30761     median: 30760.5 (28%)     max: 31188 Points
64%
A9X +
min: 19621     avg: 19737     median: 19736.5 (18%)     max: 19852 Points
WebXPRT 3 - WebXPRT 3 Score
100%
1 A9X +
101 Points (21%)
AnTuTu v6 - AnTuTu v6 Total Score
min: 217439     avg: 222713     median: 222713 (76%)     max: 227987 Points
79%
A9X +
min: 168840     avg: 176593     median: 176593 (60%)     max: 184346 Points
AnTuTu v7 - AnTuTu v7 MEM
100%
1 A9X +
7954 Points (24%)
AnTuTu v7 - AnTuTu v7 UX
100%
1 A9X +
38538 Points (47%)
AnTuTu v7 - AnTuTu v7 GPU
100%
1 A9X +
89250 Points (28%)
AnTuTu v7 - AnTuTu v7 CPU
100%
1 A9X +
81273 Points (50%)
AnTuTu v7 - AnTuTu v7 Total Score
100%
1 A9X +
217015 Points (38%)
PassMark PerformanceTest Mobile V1 - PerformanceTest Mobile V1 CPU Tests
min: 82816     avg: 82838     median: 82837.5 (11%)     max: 82859 Points
71%
A9X +
min: 58793     avg: 59226     median: 59226 (8%)     max: 59659 Points

Average Benchmarks Apple A10X Fusion → 100% n=9

Average Benchmarks Apple A9X → 75% n=9

- Range of benchmark values for this graphics card
- Average benchmark values for this graphics card
* Smaller numbers mean a higher performance
1 This benchmark is not used for the average calculation

Add one or more devices and compare

In the following list you can select (and also search for) devices that should be added to the comparison. You can select more than one device.

restrict list:

show all (including archived), 2024, 2023
v1.27
log 16. 21:32:09

#0 checking url part for id 9162 +0s ... 0s

#1 checking url part for id 7087 +0s ... 0s

#2 not redirecting to Ajax server +0s ... 0s

#3 did not recreate cache, as it is less than 5 days old! Created at Sun, 16 Jun 2024 05:37:17 +0200 +0.001s ... 0.001s

#4 composed specs +0.055s ... 0.056s

#5 did output specs +0s ... 0.056s

#6 getting avg benchmarks for device 9162 +0.003s ... 0.06s

#7 got single benchmarks 9162 +0.007s ... 0.066s

#8 getting avg benchmarks for device 7087 +0.003s ... 0.07s

#9 got single benchmarks 7087 +0.008s ... 0.078s

#10 got avg benchmarks for devices +0s ... 0.078s

#11 min, max, avg, median took s +0.104s ... 0.182s

#12 return log +0.053s ... 0.235s

Please share our article, every link counts!
> Expert Reviews and News on Laptops, Smartphones and Tech Innovations > Benchmarks / Tech > Processor Comparison - Head 2 Head
Redaktion, 2017-09- 8 (Update: 2023-07- 1)