Notebookcheck Logo

Qualcomm Snapdragon 435 vs HiSilicon Kirin 620 vs HiSilicon Kirin 655

Qualcomm Snapdragon 435

► remove from comparison Qualcomm 435

The Qualcomm Snapdragon 435 (SD435) is a lower mainstream SoC for (Android based) smartphones and tablets. Contrary to the Snapdragon 630, it is still manufactured in a 28-nm process and also consists of an octa-core CPU part with ARM Cortex-A53 cores. However, they are only clocked at up to 1.4 GHz. The integrated X9 LTE modem supports Cat. 4 with maximum transfer rates of 300 Mbps (downstream) and 100 Mbps (upstream). The SoC also includes an Adreno 505 GPU with support for Vulkan and OpenGL ES 3.1. WiFi 802.11ac and Bluetooth 4.1 are supported as well. The memory controller supports LPDDR3 clocked at 800 MHz (so probably dual-channel DDRL-1600). The main difference to the Snapdragon 430 is the faster LTE modem.

HiSilicon Kirin 620

► remove from comparison  Kirin 620

The HiSilicon Kirin 620 is an ARM-based octa core SoC for mid-range smartphones. It was announced at the end of 2014 and features eight ARM Cortex-A53 cores at 1.2 GHz (max.). Furthermore, the processor integrates a ARM Mali-450 MP4 graphics card, an LPDDR3 memory controller, an LTE Cat.4 modem, 802.11n WiFi and Bluetooth 4.0. The chip is manufactured in 28nm and relatively power efficient.

HiSilicon Kirin 655

► remove from comparison  Kirin 655

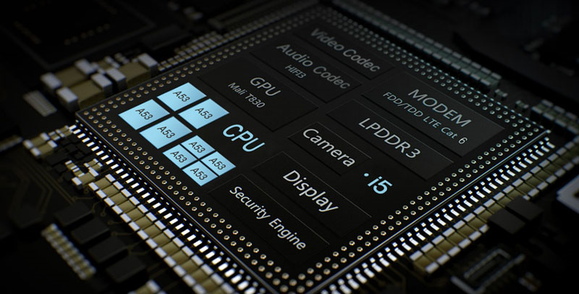
The HiSilicon Kirin 655 is an ARM-based octa-core SoC for mid-range smartphones and tablets. It was announced late 2016 and features eight ARM Cortex-A53 cores. Four cores can be clocked with up to 1.7 GHz (power saving cores) and four with up to 2.1 GHz (performance cores). The difference to the older Kirin 650 is the 100 MHz higher clock speed of the performance cores.

Furthermore, a ARM Mali-T830 MP2 graphics card (at 600 MHz or 900 MHz with 40.8 GFLOPS), a 64-Bit LPDDR3 memory controller and a dual-sim capable LTE Cat. 6 (max. 300 MBit/s and GSM, WCDMA, UMTS, HSPA+) radio are integrated in the SoC. The processor performance can be compared with the older Kirin 930 and therefore sufficient for daily usage as browsing and non demanding apps. High-end SoCs with Cortex-A57 or A72 cores however should be noticeably faster. The SoC is produced in a modern 16nm FinFET process and is therefore very power efficient.

ModelQualcomm Snapdragon 435HiSilicon Kirin 620HiSilicon Kirin 655
SeriesQualcomm Snapdragon
CodenameCortex-A53Cortex-A53Cortex-A53
Series: Cortex-A53
Qualcomm Snapdragon 6302.2 GHz8 / 8 cores Cortex-A53
Qualcomm Snapdragon 6262.2 GHz8 / 8 cores Cortex-A53
Qualcomm Snapdragon 6252 GHz8 / 8 cores Cortex-A53
Qualcomm Snapdragon 4392 GHz8 / 8 cores Cortex-A53
Qualcomm Snapdragon 4501.8 GHz8 / 8 cores Cortex-A53
Qualcomm Snapdragon 4292 GHz4 / 4 cores Cortex-A53
Qualcomm Snapdragon 617 MSM89521.5 GHz8 / 8 cores Cortex-A53
Qualcomm Snapdragon 616 MSM8939v21.7 GHz8 / 8 cores Cortex-A53
Qualcomm Snapdragon 615 MSM89391.7 GHz8 / 8 cores Cortex-A53
Qualcomm Snapdragon 610 MSM89361.7 GHz4 / 4 cores Cortex-A53
Qualcomm Snapdragon 435 « 1.4 GHz8 / 8 cores Cortex-A53
Qualcomm Snapdragon 430 (MSM8937)1.4 GHz8 / 8 cores Cortex-A53
Qualcomm Snapdragon 415 MSM89291.4 GHz8 / 8 cores Cortex-A53
Qualcomm Snapdragon 425 (MSM8917)1.4 GHz4 / 4 cores Cortex-A53
Qualcomm Snapdragon 410 MSM89161.4 GHz4 / 4 cores Cortex-A53
Qualcomm Snapdragon 410 APQ80161.2 GHz4 / 4 cores Cortex-A53
JLQ JR5101.5 - 2 GHz8 / 8 cores Cortex-A53
HiSilicon Kirin 9352.2 GHz8 / 8 cores Cortex-A53
HiSilicon Kirin 6592.36 GHz8 / 8 cores Cortex-A53
HiSilicon Kirin 6582.35 GHz8 / 8 cores Cortex-A53
HiSilicon Kirin 6552.1 GHz8 / 8 cores Cortex-A53
HiSilicon Kirin 6502 GHz8 / 8 cores Cortex-A53
HiSilicon Kirin 9302 GHz8 / 8 cores Cortex-A53
HiSilicon Kirin 620 « 1.2 GHz8 / 8 cores Cortex-A53
MediaTek MT8163 V/A 1.5 GHz1.5 GHz4 / 4 cores Cortex-A53
MediaTek MT8163 V/B 1.3 GHz1.3 GHz4 / 4 cores Cortex-A53
MediaTek MT81611.3 GHz4 / 4 cores Cortex-A53
Marvell Armada PXA19081.2 GHz4 / 4 cores Cortex-A53
JLQ JR5101.5 - 2 GHz8 / 8 cores Cortex-A53
HiSilicon Kirin 9352.2 GHz8 / 8 cores Cortex-A53
HiSilicon Kirin 6592.36 GHz8 / 8 cores Cortex-A53
HiSilicon Kirin 6582.35 GHz8 / 8 cores Cortex-A53
HiSilicon Kirin 655 « 2.1 GHz8 / 8 cores Cortex-A53
HiSilicon Kirin 6502 GHz8 / 8 cores Cortex-A53
HiSilicon Kirin 9302 GHz8 / 8 cores Cortex-A53
HiSilicon Kirin 6201.2 GHz8 / 8 cores Cortex-A53
MediaTek MT8163 V/A 1.5 GHz1.5 GHz4 / 4 cores Cortex-A53
MediaTek MT8163 V/B 1.3 GHz1.3 GHz4 / 4 cores Cortex-A53
MediaTek MT81611.3 GHz4 / 4 cores Cortex-A53
Marvell Armada PXA19081.2 GHz4 / 4 cores Cortex-A53
Clock1400 MHz1200 MHz2100 MHz
Cores / Threads8 / 88 / 88 / 8
Technology28 nm28 nm16 nm
FeaturesAdreno 505 GPU, 802.11ac WLAN, Bluetooth 4.1, LTE Cat. 7, Dual-Channel LPDDR3-1600 Memory ControllerARMv8-ISA, Mali-450 MP4, LTE (Cat. 4), LPDDR3 Memory ControllerARMv8-ISA, Mali-T830 MP2, Dual SIM LTE (Cat. 6), LPDDR3 Memory Controller
iGPUQualcomm Adreno 505ARM Mali-450 MP4ARM Mali-T830 MP2 (900 MHz)
ArchitectureARMARMARM
Announced
Manufacturerwww.qualcomm.com

Benchmarks

3DMark - 3DMark Ice Storm Physics
100%
1 435 +
7935 Points (6%)
min: 6531     avg: 6885     median: 6884.5 (6%)     max: 7238 Points
3DMark - 3DMark Ice Storm Extreme Physics
100%
1 435 +
7745 Points (6%)
min: 6434     avg: 6917     median: 6916.5 (6%)     max: 7399 Points
3DMark - 3DMark Ice Storm Unlimited Physics
100%
435 +
min: 7095     avg: 8887     median: 9015.5 (8%)     max: 9345 Points
min: 6861     avg: 7534     median: 7533.5 (6%)     max: 8206 Points
min: 13535     avg: 13553     median: 13535 (11%)     max: 13590 Points
3DMark - 3DMark Sling Shot Extreme (ES 3.1) Unlimited Physics
100%
1 435 +
min: 1028     avg: 1199     median: 1167.5 (5%)     max: 1352 Points
1438 Points (6%)
3DMark - 3DMark Sling Shot (ES 3.0) Unlimited Physics
100%
1 435 +
min: 1002     avg: 1182     median: 1152 (13%)     max: 1382 Points
1391 Points (16%)
Geekbench 4.4 - Geekbench 4.1 - 4.4 64 Bit Single-Core
100%
1 435 +
min: 637     avg: 663     median: 666 (7%)     max: 691 Points
Geekbench 4.4 - Geekbench 4.1 - 4.4 64 Bit Multi-Core
100%
1 435 +
min: 2210     avg: 2610     median: 2582 (3%)     max: 2889 Points
Geekbench 4.0 - Geekbench 4.0 64 Bit Single-Core
100%
1 435 +
577 Points (8%)
min: 780     avg: 784     median: 784 (11%)     max: 788 Points
Geekbench 4.0 - Geekbench 4.0 64 Bit Multi-Core
100%
1 435 +
2308 Points (6%)
min: 3240     avg: 3291     median: 3290.5 (8%)     max: 3341 Points
Geekbench 3 - Geekbench 3 64 Bit Multi-Core
min: 2151     avg: 2453     median: 2452.5 (4%)     max: 2754 Points
Geekbench 3 - Geekbench 3 64 Bit Single-Core
min: 541     avg: 565     median: 564.5 (8%)     max: 588 Points
Linpack Android / IOS - Linpack Multi Thread
166 MFLOPS (6%)
Linpack Android / IOS - Linpack Single Thread
52 MFLOPS (5%)
Mozilla Kraken 1.1 - Kraken 1.1 Total Score *
100%
435 +
min: 11007     avg: 12667     median: 12750 (15%)     max: 13586 ms
min: 15866     avg: 17376     median: 17375.5 (20%)     max: 18885 ms
min: 8768     avg: 9071     median: 9070.5 (11%)     max: 9373 ms
Sunspider - Sunspider 1.0 Total Score *
100%
1 435 +
1979 ms (22%)
min: 1373     avg: 1680     median: 1679.5 (18%)     max: 1986 ms
Octane V2 - Octane V2 Total Score
100%
435 +
min: 2689     avg: 3112     median: 3209 (3%)     max: 3314 Points
min: 1857     avg: 2170     median: 2170 (2%)     max: 2483 Points
min: 4199     avg: 4415     median: 4414.5 (4%)     max: 4630 Points
WebXPRT 3 - WebXPRT 3 Score
100%
1 435 +
27 Points (6%)
Vellamo 3.x - Vellamo 3.x Metal
907 Points (24%)
Vellamo 3.x - Vellamo 3.x Multicore Beta
1104 Points (25%)
Vellamo 3.x - Vellamo 3.x Browser
1146 Points (15%)
AnTuTu v5 - AnTuTu v5 Total Score
min: 30558     avg: 32403     median: 32402.5 (33%)     max: 34247 Points
AnTuTu v6 - AnTuTu v6 Total Score
100%
1 435 +
min: 42643     avg: 44884     median: 45572 (16%)     max: 46814 Points
min: 56764     avg: 56781     median: 56781 (19%)     max: 56798 Points
AnTuTu v7 - AnTuTu v7 MEM
100%
1 435 +
min: 4213     avg: 4532     median: 4581.5 (14%)     max: 4750 Points
AnTuTu v7 - AnTuTu v7 UX
100%
1 435 +
min: 14261     avg: 15880     median: 16055.5 (20%)     max: 17146 Points
AnTuTu v7 - AnTuTu v7 GPU
100%
1 435 +
min: 9541     avg: 9568     median: 9563 (3%)     max: 9605 Points
AnTuTu v7 - AnTuTu v7 CPU
100%
1 435 +
min: 27075     avg: 27665     median: 27740 (17%)     max: 28105 Points
AnTuTu v7 - AnTuTu v7 Total Score
100%
1 435 +
min: 56672     avg: 57644     median: 57289 (10%)     max: 59326 Points
PassMark PerformanceTest Mobile V1 - PerformanceTest Mobile V1 CPU Tests
100%
1 435 +
81667 Points (11%)
162396 Points (21%)
PCMark for Android - PCM f. Android Computer Vision
100%
1 435 +
min: 1646     avg: 1876     median: 1875.5 (10%)     max: 2105 Points
PCMark for Android - PCM f. Android Storage
100%
1 435 +
min: 4303     avg: 6883     median: 6882.5 (15%)     max: 9462 Points
PCMark for Android - PCM f. Android Work Score 2.0
100%
1 435 +
min: 3538     avg: 3737     median: 3710 (24%)     max: 3928 Points
PCMark for Android - PCM f. Android Work Score
100%
435 +
min: 4316     avg: 4876     median: 4814.5 (24%)     max: 5438 Points
3717 Points (19%)
min: 4383     avg: 4401     median: 4401 (22%)     max: 4419 Points

Average Benchmarks Qualcomm Snapdragon 435 → 100% n=4

Average Benchmarks HiSilicon Kirin 620 → 81% n=4

Average Benchmarks HiSilicon Kirin 655 → 121% n=4

- Range of benchmark values for this graphics card
- Average benchmark values for this graphics card
* Smaller numbers mean a higher performance
1 This benchmark is not used for the average calculation

v1.26
log 18. 00:40:21

#0 checking url part for id 8506 +0s ... 0s

#1 checking url part for id 6667 +0s ... 0s

#2 checking url part for id 8478 +0s ... 0s

#3 not redirecting to Ajax server +0s ... 0s

#4 did not recreate cache, as it is less than 5 days old! Created at Fri, 17 May 2024 11:21:47 +0200 +0.001s ... 0.001s

#5 composed specs +0.101s ... 0.102s

#6 did output specs +0s ... 0.102s

#7 getting avg benchmarks for device 8506 +0.003s ... 0.104s

#8 got single benchmarks 8506 +0.038s ... 0.143s

#9 getting avg benchmarks for device 6667 +0.003s ... 0.146s

#10 got single benchmarks 6667 +0.01s ... 0.156s

#11 getting avg benchmarks for device 8478 +0.003s ... 0.159s

#12 got single benchmarks 8478 +0.011s ... 0.169s

#13 got avg benchmarks for devices +0s ... 0.169s

#14 min, max, avg, median took s +0.165s ... 0.334s

#15 return log +0s ... 0.335s

Please share our article, every link counts!
> Expert Reviews and News on Laptops, Smartphones and Tech Innovations > Benchmarks / Tech > Processor Comparison - Head 2 Head
Redaktion, 2017-09- 8 (Update: 2023-07- 1)