

Western Digital Blue SN550 NVMe 1 TB SSD Benchmarked
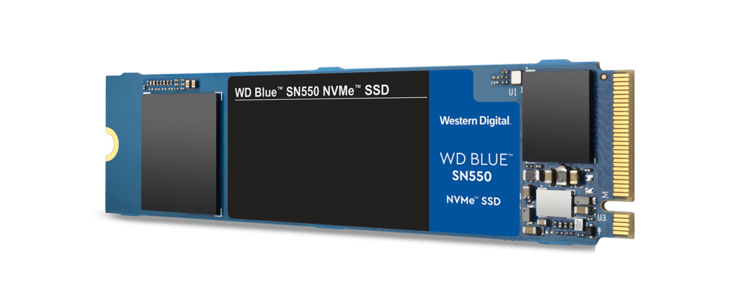
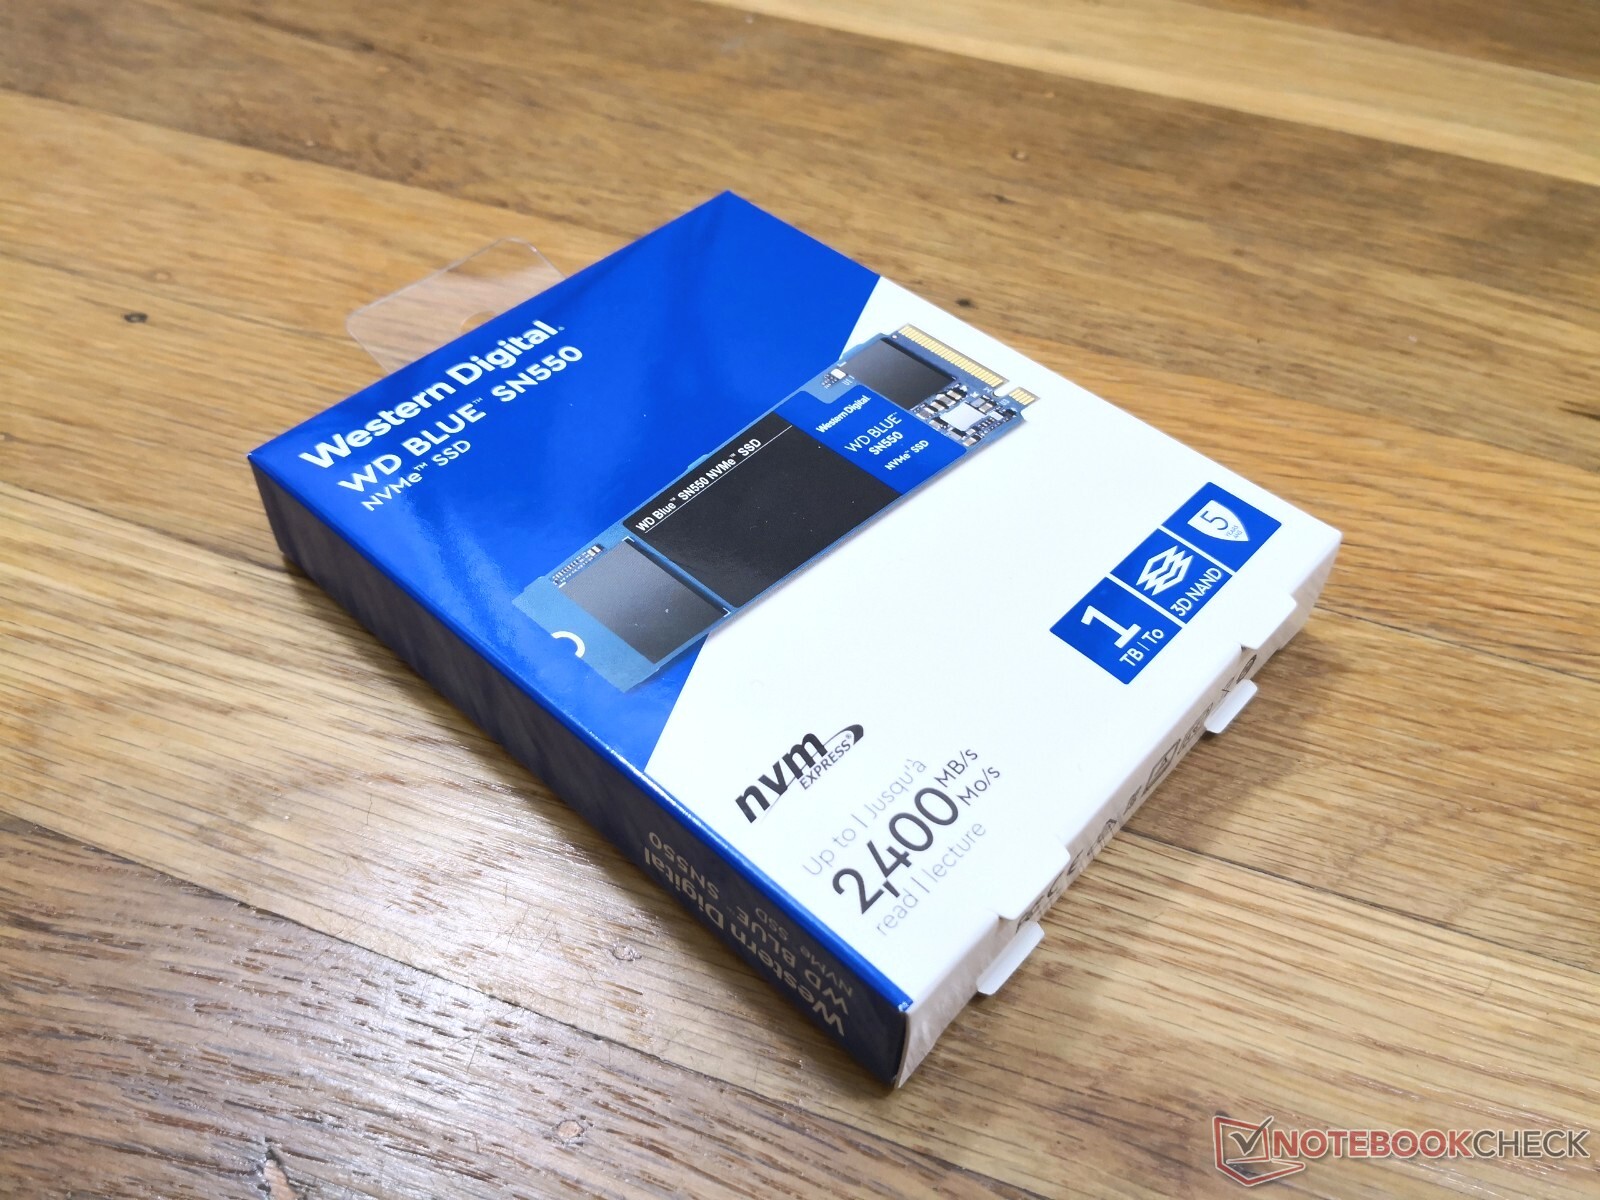
Western Digital announced the Blue SN550 earlier this month as a successor to the Blue SN500 and SN520. The most notable upgrade will be performance: Sequential read rates are now rated at up to 2400 MB/s compared to "only" 1700 MB/s on the SN500. The WD Blue series is aimed at consumers, gamers or content creators on a budget in contrast to the enthusiast WD Black series.
See the official data sheet for the Blue SN550 here. Prices start from $70 to $125 USD with capacities ranging from 250 GB to 1 TB and a 5-year limited warranty.
| Capacity | Max Sequential Read (MB/s) | Max Sequential Write (MB/s) | Read IOPS | Write IOPS | Endurance (TBW) |
| 250 GB | 2400 | 950 | 170K | 135K | 150 |
| 500 GB | 2400 | 1750 | 300K | 240K | 300 |
| 1 TB | 2400 | 1950 | 410K | 405K | 600 |
Test System
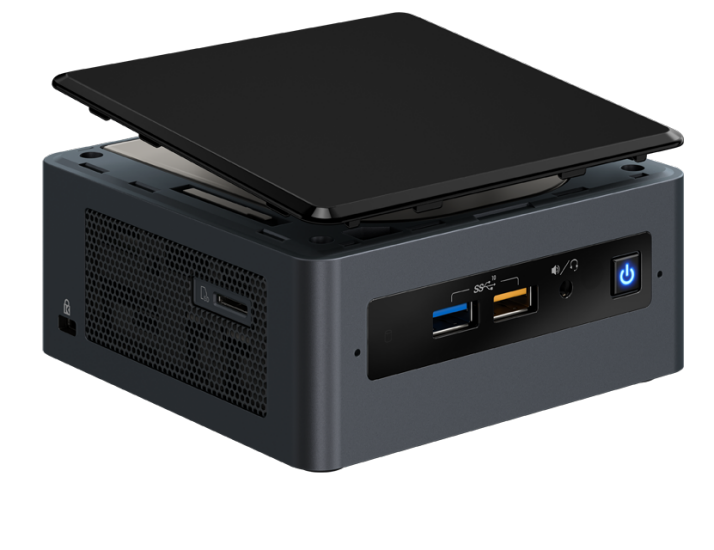
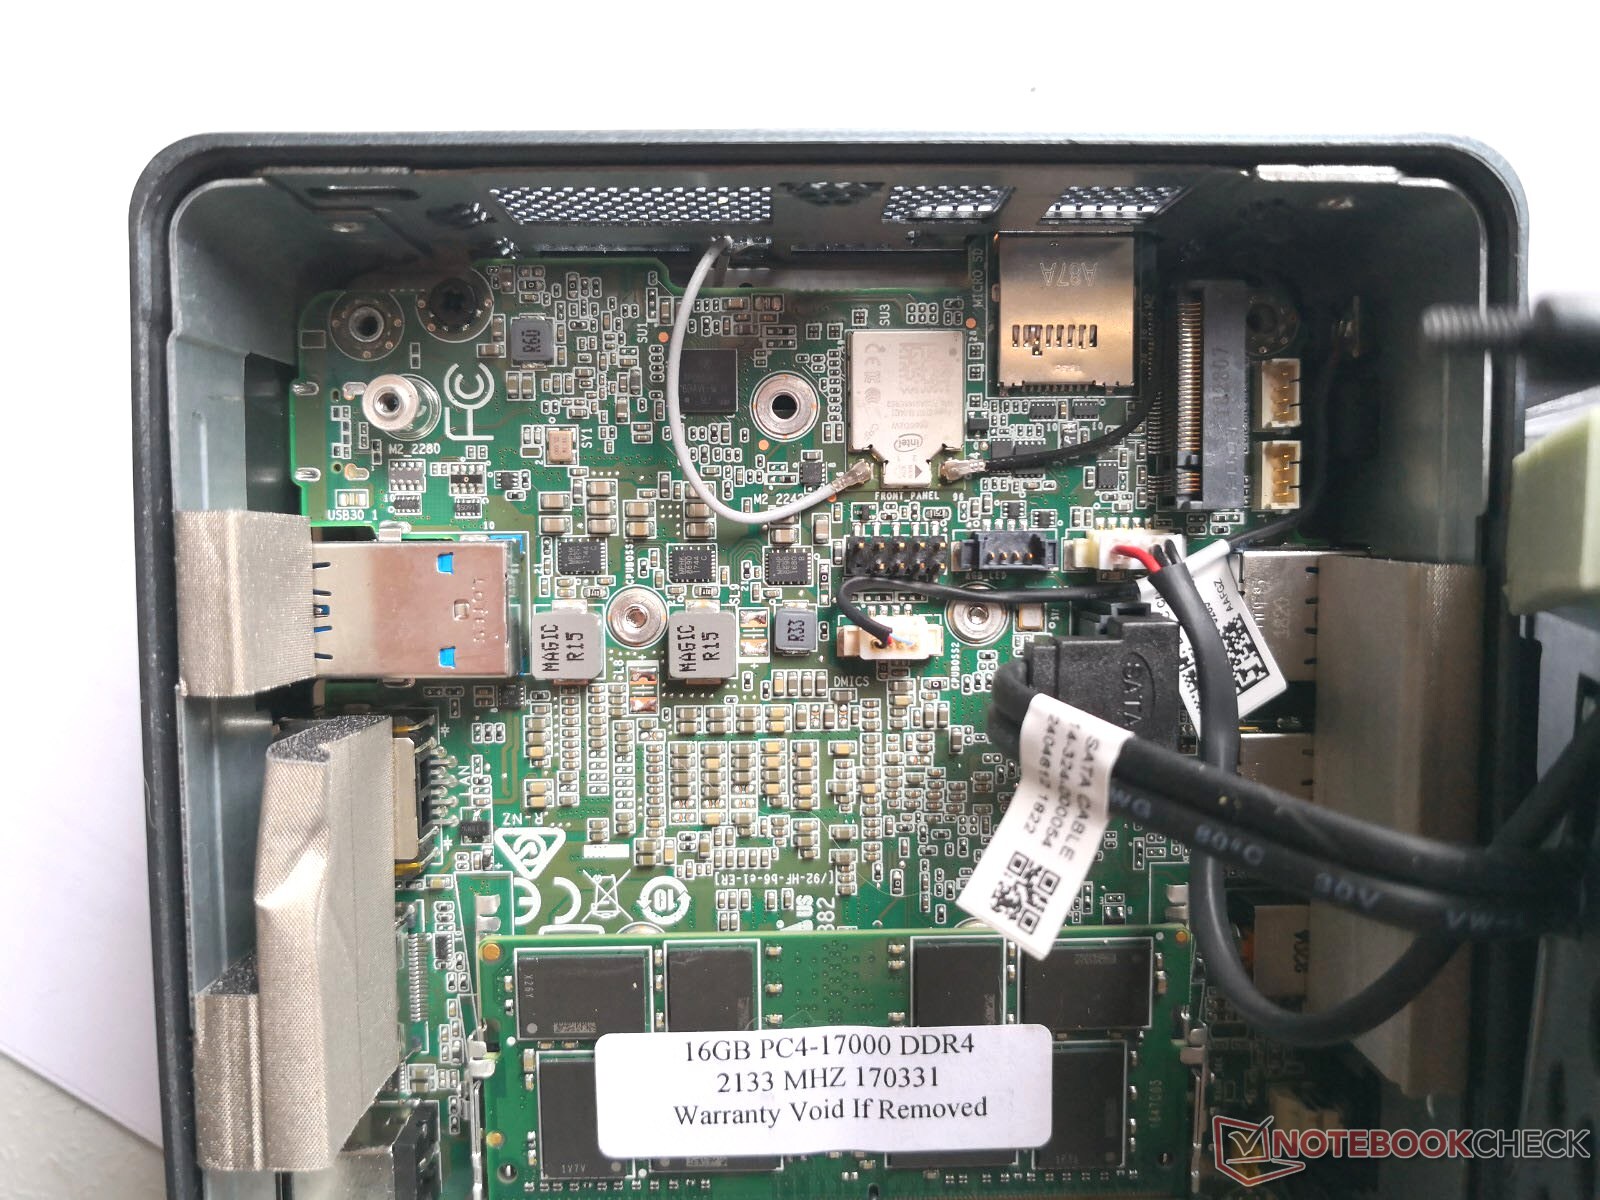
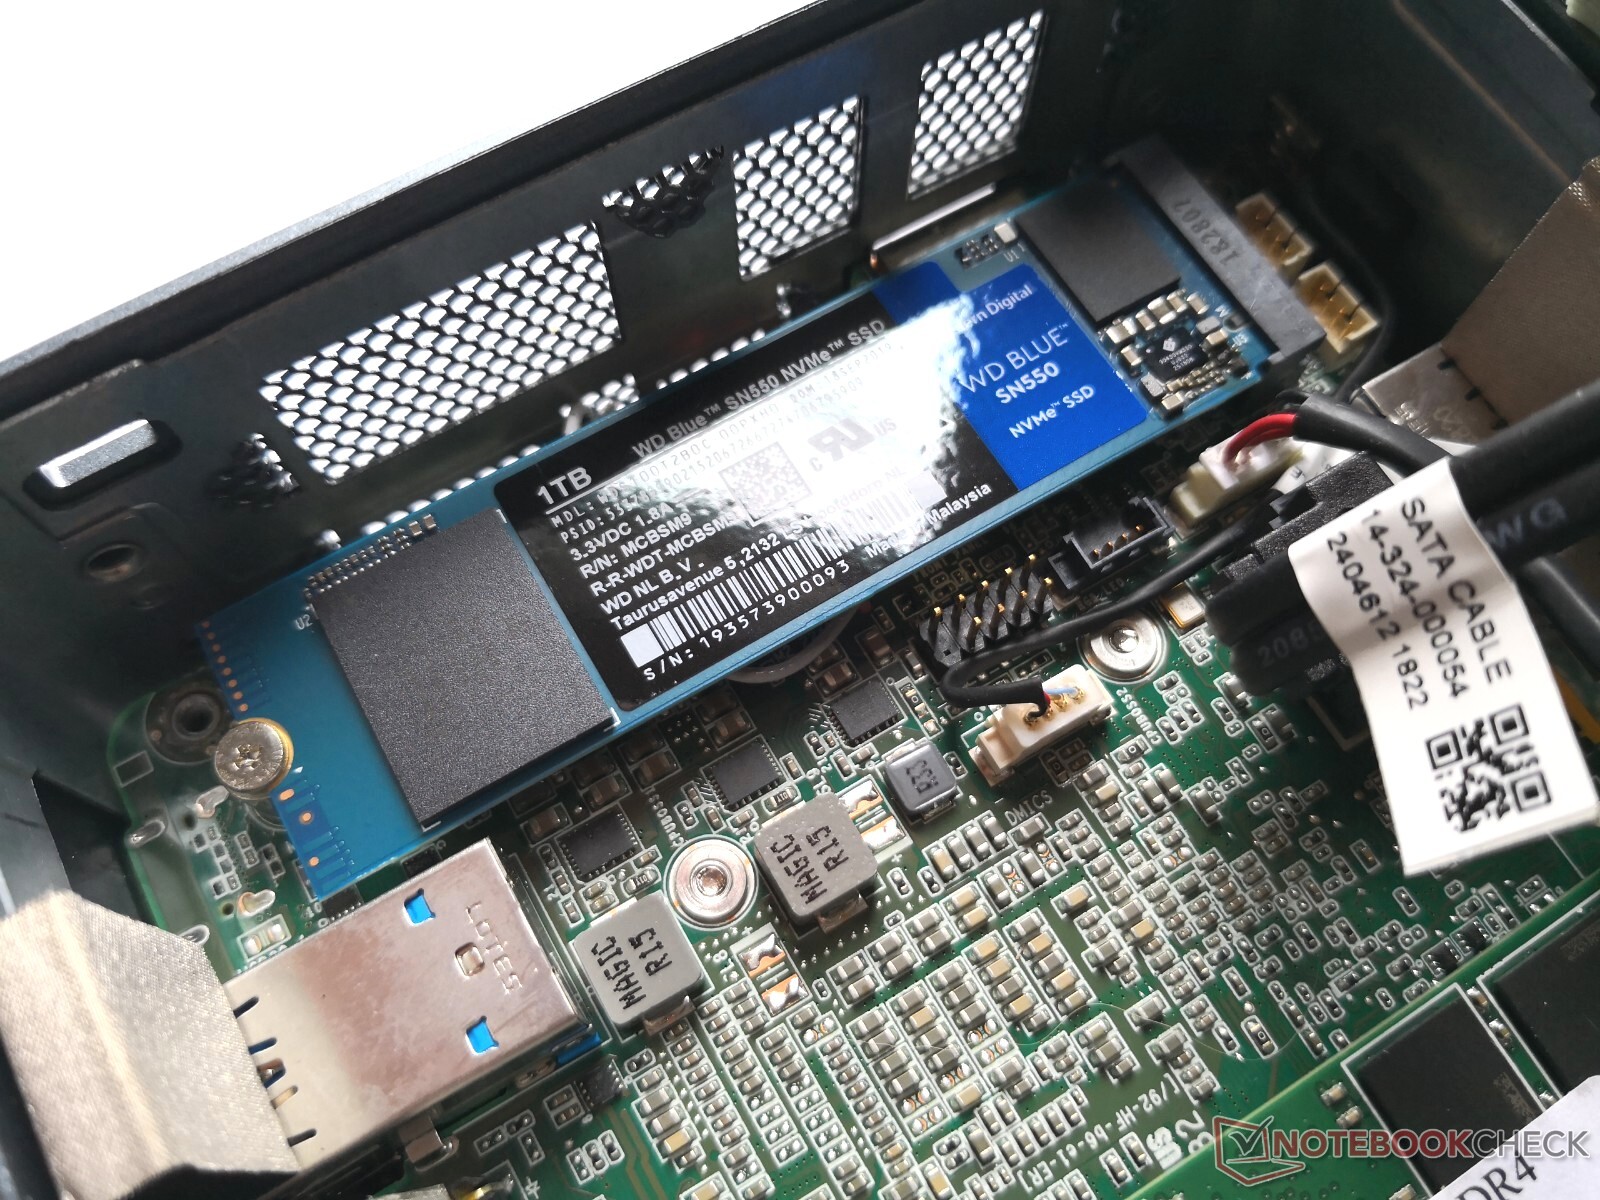
Our test PC will be the Intel NUC NUC8i7BEH. This particular system was chosen because it houses both an M.2 PCIe x4 slot and a 2.5-inch SATA III with easy servicing. Installing the drive is therefore a simple process, but keep in mind that most NVMe drives are not designed to be compatible with SATA III-based M.2 slots.
See our full review on the Intel NUC NUC8i7BEH here to learn more about the mini PC.
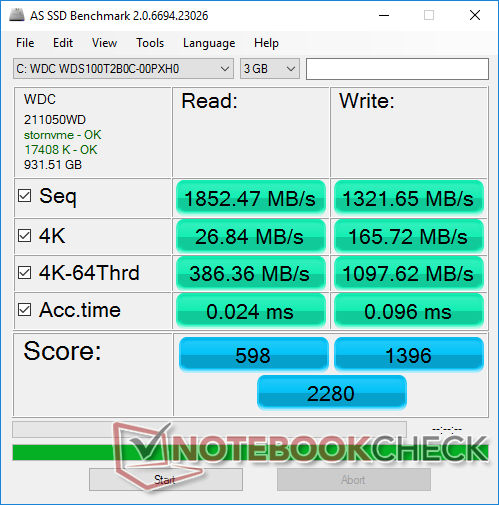
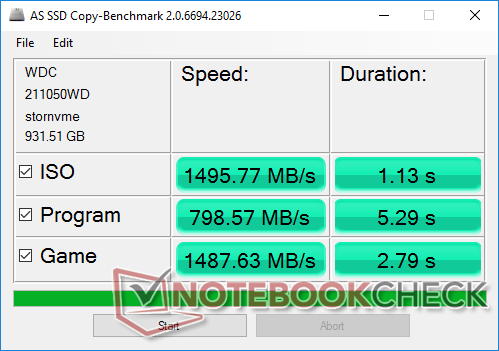
AS SSD & CrystalDiskMark
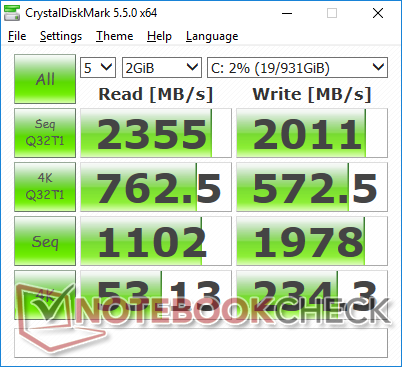
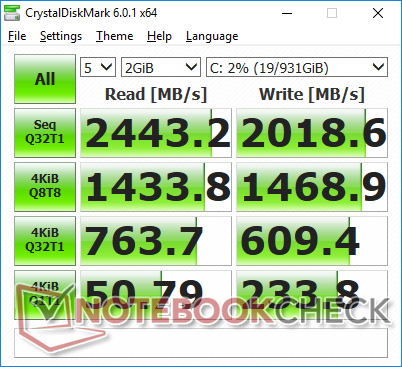
The OEM advertises sequential read rates of 2400 MB/s and we can indeed see those numbers when at a queue depth of 32 with 1 thread according to CrystalDiskMark. Pricier alternatives like the Samsung SSD PM981 can reach almost 3500 MB/s in this same benchmark.
| Western Digital Blue SN550 NVMe Western Digital Blue SN550 NVMe SSD 1 TB WDS100T2B0C | Kingston KC600 | Kingston A2000 Kingston SA2000M81000G | Intel NUC8i7BEH Asura NVMe SSD Asura Genesis Xtreme NVMe M.2 SSD 1 TB | Razer Blade Stealth i7-1065G7 Iris Plus Samsung SSD PM981 MZVLB256HAHQ | Dell XPS 15 7590 9980HK GTX 1650 Toshiba XG6 KXG60ZNV1T02 | |
|---|---|---|---|---|---|---|
| CrystalDiskMark 5.2 / 6 | -57% | 6% | 24% | -8% | -1% | |
| Write 4K (MB/s) | 234.3 | 132.8 -43% | 193.7 -17% | 272.4 16% | 176.8 -25% | 104.3 -55% |
| Read 4K (MB/s) | 53.1 | 49.62 -7% | 71 34% | 57.1 8% | 48.38 -9% | 45.23 -15% |
| Write Seq (MB/s) | 1978 | 416.1 -79% | 2044 3% | 2019 2% | 1332 -33% | 1729 -13% |
| Read Seq (MB/s) | 1102 | 550 -50% | 1992 81% | 1701 54% | 1644 49% | 1861 69% |
| Write 4K Q32T1 (MB/s) | 573 | 339.2 -41% | 623 9% | 844 47% | 440.6 -23% | 509 -11% |
| Read 4K Q32T1 (MB/s) | 763 | 378.1 -50% | 704 -8% | 884 16% | 559 -27% | 388.5 -49% |
| Write Seq Q32T1 (MB/s) | 2011 | 483.9 -76% | 2173 8% | 2110 5% | 1104 -45% | 2813 40% |
| Read Seq Q32T1 (MB/s) | 2355 | 563 -76% | 2279 -3% | 3463 47% | 3481 48% | 2906 23% |
| Write 4K Q8T8 (MB/s) | 1469 | 343.4 -77% | 1072 -27% | |||
| Read 4K Q8T8 (MB/s) | 1434 | 372.1 -74% | 1167 -19% | |||
| AS SSD | -32% | 37% | 53% | -34% | 38% | |
| Seq Read (MB/s) | 1852 | 447.3 -76% | 1622 -12% | 2288 24% | 1989 7% | 1723 -7% |
| Seq Write (MB/s) | 1322 | 452.1 -66% | 1936 46% | 1908 44% | 827 -37% | 1386 5% |
| 4K Read (MB/s) | 26.84 | 41.69 55% | 61 127% | 51.9 93% | 40.12 49% | 43.25 61% |
| 4K Write (MB/s) | 165.7 | 96.5 -42% | 150.6 -9% | 173.3 5% | 135.1 -18% | 98.3 -41% |
| 4K-64 Read (MB/s) | 386.4 | 358.1 -7% | 1098 184% | 1222 216% | 531 37% | 1078 179% |
| 4K-64 Write (MB/s) | 1098 | 315.1 -71% | 1041 -5% | 1829 67% | 309.9 -72% | 1456 33% |
| Access Time Read * (ms) | 0.024 | 0.037 -54% | 0.024 -0% | 0.031 -29% | 0.085 -254% | 0.05 -108% |
| Access Time Write * (ms) | 0.096 | 0.034 65% | 0.075 22% | 0.083 14% | 0.09 6% | 0.039 59% |
| Score Read (Points) | 598 | 444 -26% | 1321 121% | 1502 151% | 770 29% | 1294 116% |
| Score Write (Points) | 1396 | 457 -67% | 1385 -1% | 2193 57% | 528 -62% | 1693 21% |
| Score Total (Points) | 2280 | 1144 -50% | 3413 50% | 4454 95% | 1644 -28% | 3638 60% |
| Copy ISO MB/s (MB/s) | 1496 | 1062 -29% | 1612 8% | 1542 3% | 1418 -5% | 3182 113% |
| Copy Program MB/s (MB/s) | 799 | 621 -22% | 703 -12% | 747 -7% | 382.7 -52% | 984 23% |
| Copy Game MB/s (MB/s) | 1488 | 717 -52% | 1425 -4% | 1577 6% | 334.2 -78% | 1824 23% |
| Total Average (Program / Settings) | -45% /
-42% | 22% /
24% | 39% /
42% | -21% /
-25% | 19% /
24% |
* ... smaller is better

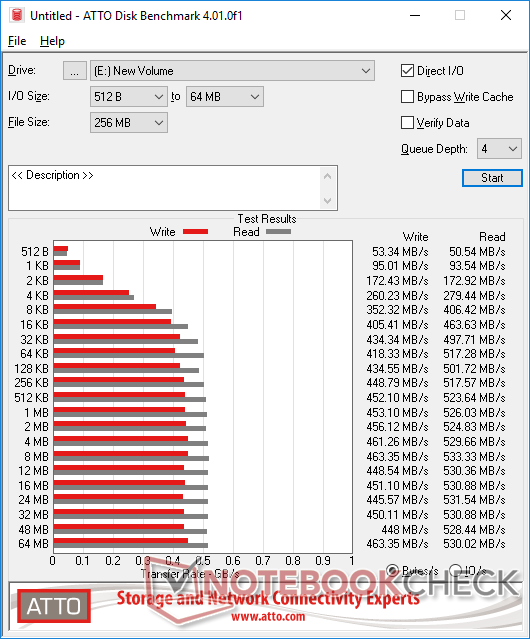
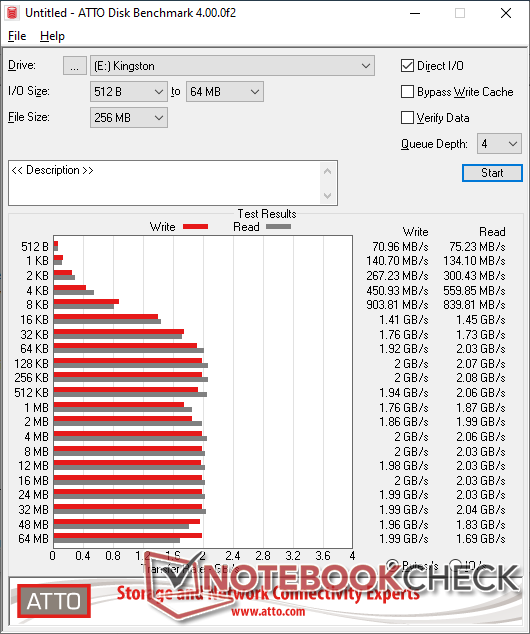
ATTO
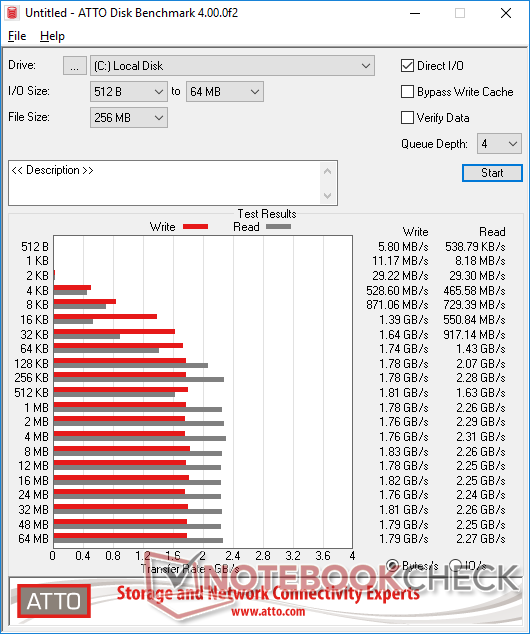
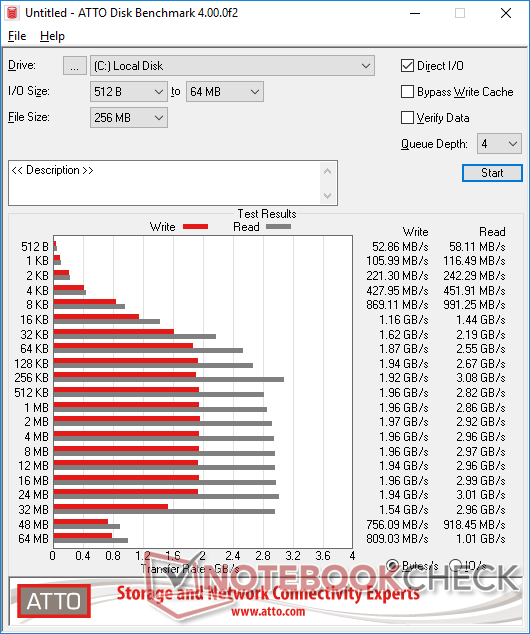
ATTO tests read and write speeds at a wider range of block sizes to paint a bigger picture of overall performance. It is here where we can see cutbacks; read and write rates of very small blocks (512 B, 1 KB, 2 KB) are much slower than expected. The competing Kingston A2000, for example, is able to outperform our WD drive by over 10x in this particular category.
| Western Digital Blue SN550 NVMe | Kingston KC600 | Kingston A2000 | Intel NUC8i7BEH Asura NVMe SSD | Samsung 960 Pro 1TB | |
|---|---|---|---|---|---|
| ATTO Disk Benchmark | -70% | 17% | 34% | 41% | |
| 16KB write (KB/s) | 1390000 | 405410 -71% | 1410000 1% | 1160000 -17% | 1102410 -21% |
| 32KB write (KB/s) | 1640000 | 434340 -74% | 1760000 7% | 1620000 -1% | 2054220 25% |
| 64KB write (KB/s) | 1740000 | 418330 -76% | 1920000 10% | 1870000 7% | 2073620 19% |
| 128KB write (KB/s) | 1780000 | 434550 -76% | 2000000 12% | 1940000 9% | 2078800 17% |
| 256KB write (KB/s) | 1780000 | 448790 -75% | 2000000 12% | 1920000 8% | 2098690 18% |
| 512KB write (KB/s) | 1810000 | 452100 -75% | 1940000 7% | 1960000 8% | 2090010 15% |
| 1024KB write (KB/s) | 1780000 | 453100 -75% | 1760000 -1% | 1960000 10% | 2100230 18% |
| 2048KB write (KB/s) | 1760000 | 456120 -74% | 1860000 6% | 1970000 12% | 2090010 19% |
| 4096KB write (KB/s) | 1760000 | 461260 -74% | 2000000 14% | 1960000 11% | 2090010 19% |
| 8192KB write (KB/s) | 1830000 | 463350 -75% | 2000000 9% | 1960000 7% | 2079890 14% |
| 16KB read (KB/s) | 550840 | 463630 -16% | 1450000 163% | 1440000 161% | 1257110 128% |
| 32KB read (KB/s) | 917140 | 497710 -46% | 1730000 89% | 2190000 139% | 2432300 165% |
| 64KB read (KB/s) | 1430000 | 517280 -64% | 2030000 42% | 2550000 78% | 2458920 72% |
| 128KB read (KB/s) | 2070000 | 501720 -76% | 2070000 0% | 2670000 29% | 3003310 45% |
| 256KB read (KB/s) | 2280000 | 517570 -77% | 2080000 -9% | 3080000 35% | 3230230 42% |
| 512KB read (KB/s) | 1630000 | 523640 -68% | 2060000 26% | 2820000 73% | 3197250 96% |
| 1024KB read (KB/s) | 2260000 | 526030 -77% | 1870000 -17% | 2860000 27% | 3263860 44% |
| 2048KB read (KB/s) | 2290000 | 524830 -77% | 1990000 -13% | 2920000 28% | 3026480 32% |
| 4096KB read (KB/s) | 2310000 | 529660 -77% | 2060000 -11% | 2960000 28% | 3019900 31% |
| 8192KB read (KB/s) | 2260000 | 533330 -76% | 2030000 -10% | 2970000 31% | 2960680 31% |
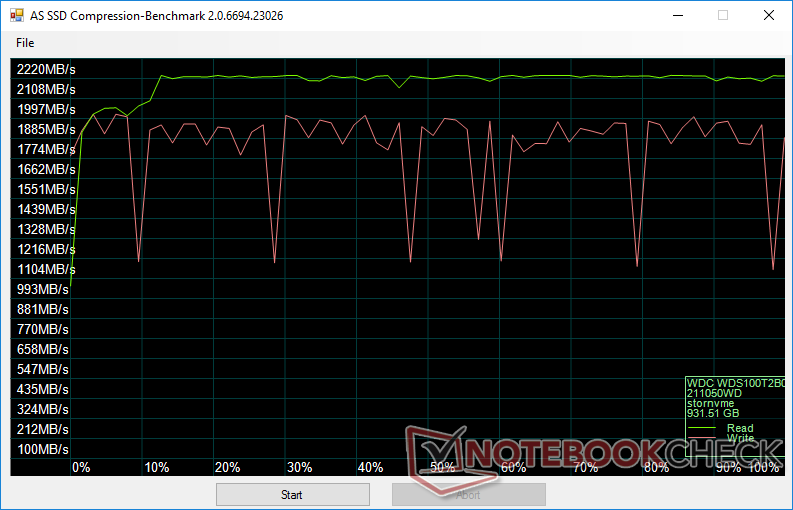
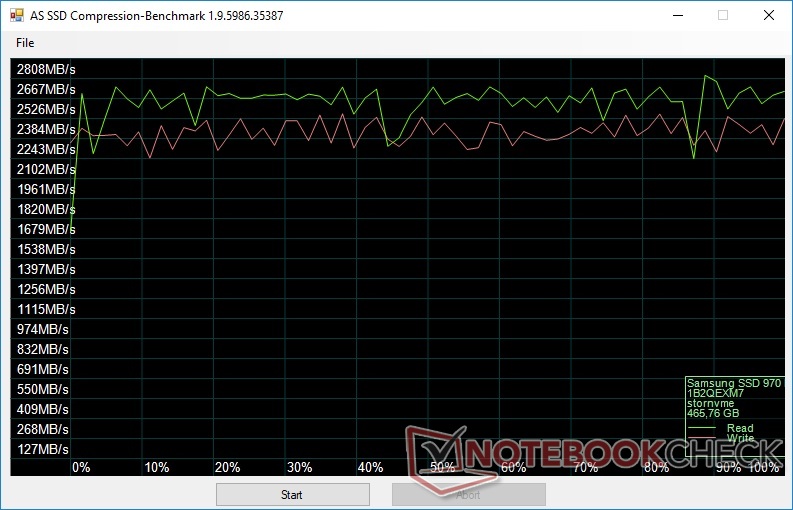
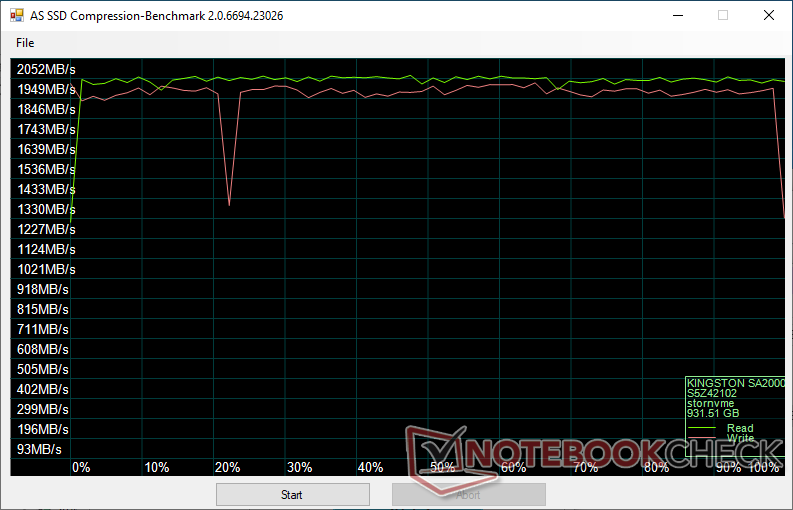
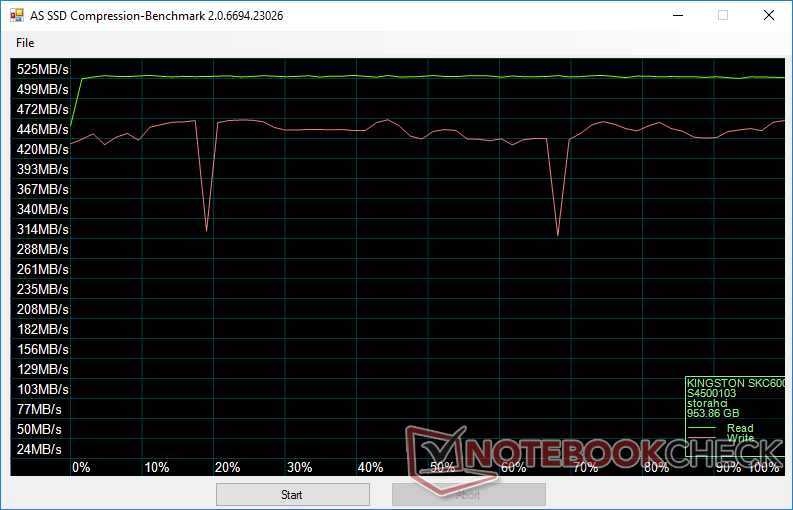
Data Compression
Write rates could have been more stable when compressing data. As shown by our graph below, speeds drop to as low 1200 MB/s more frequently when compared to drives from Kingston or Samsung.
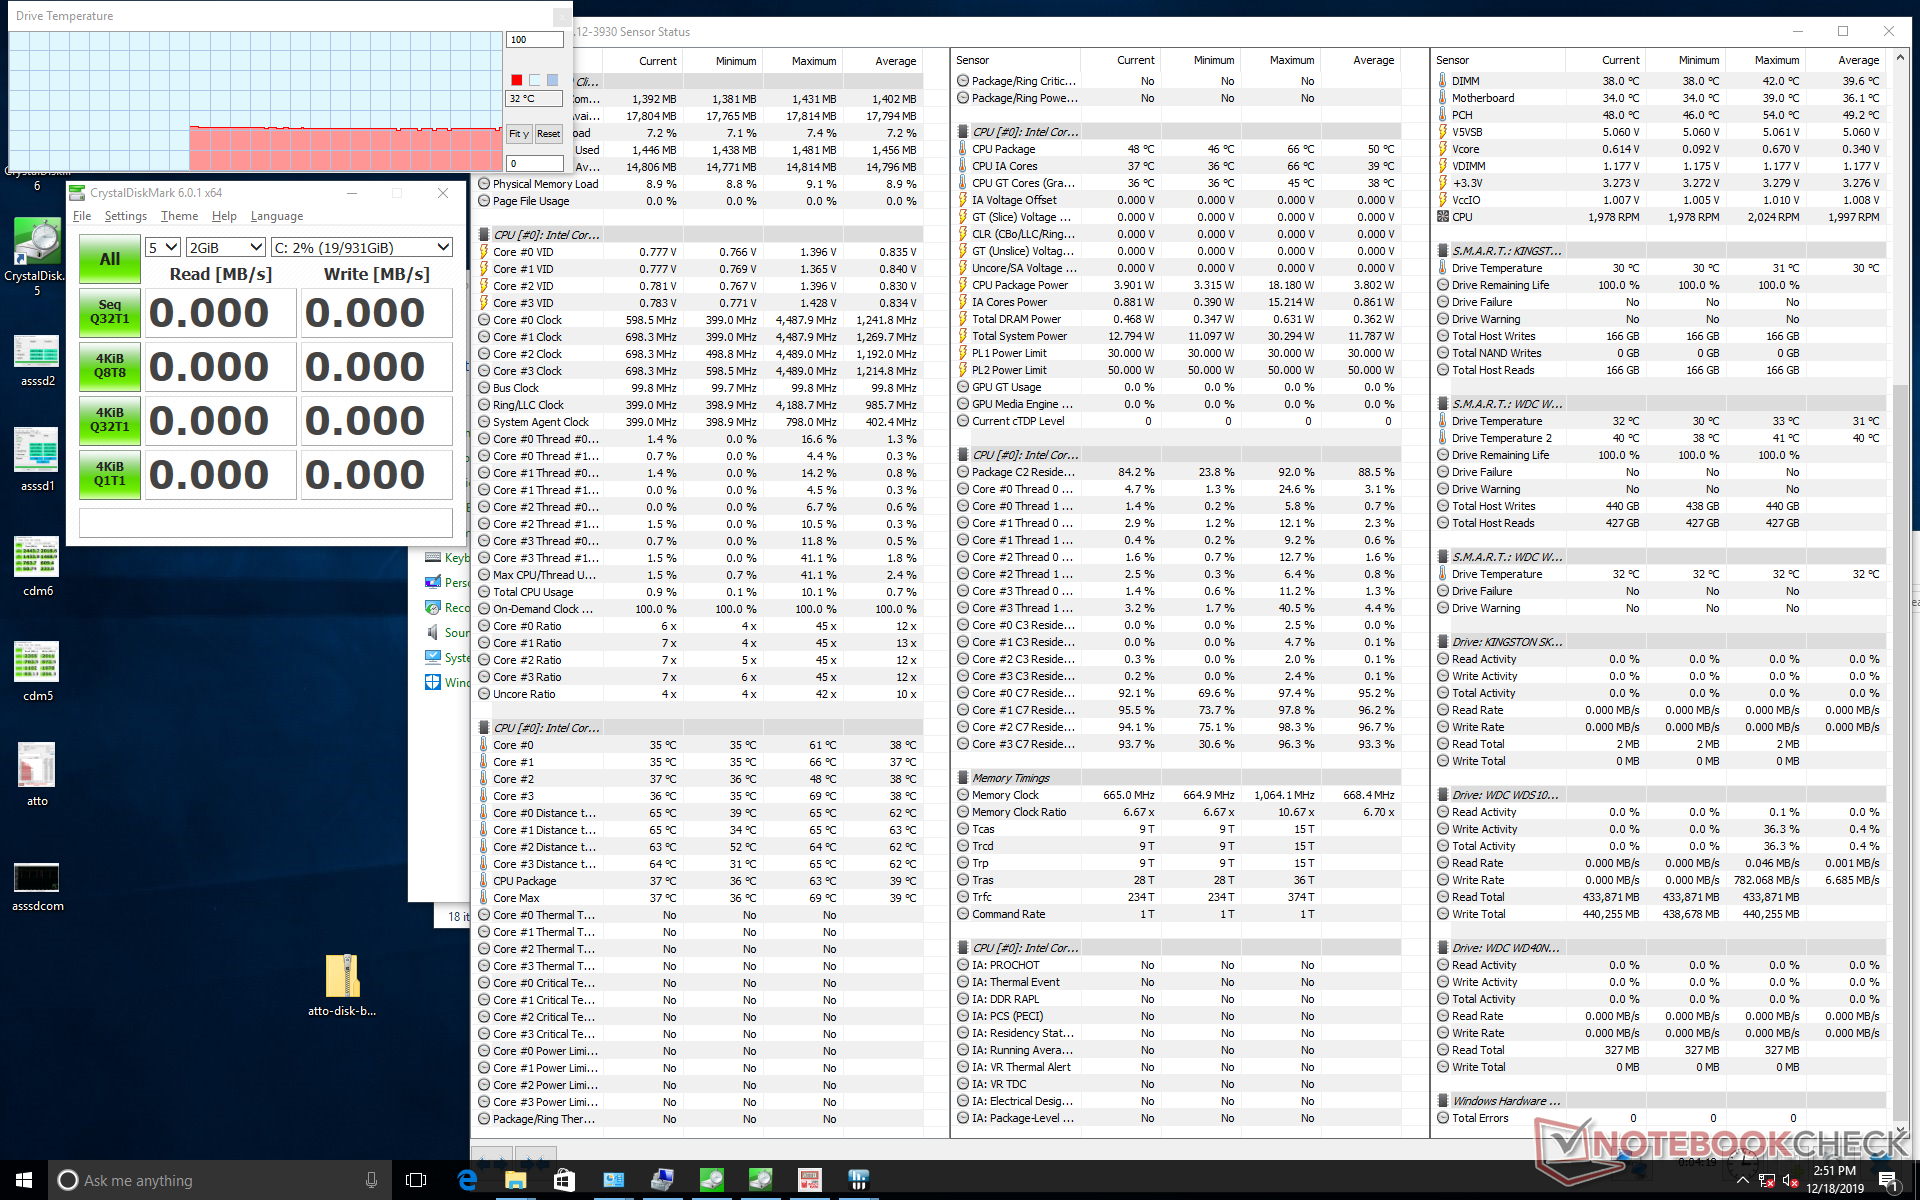
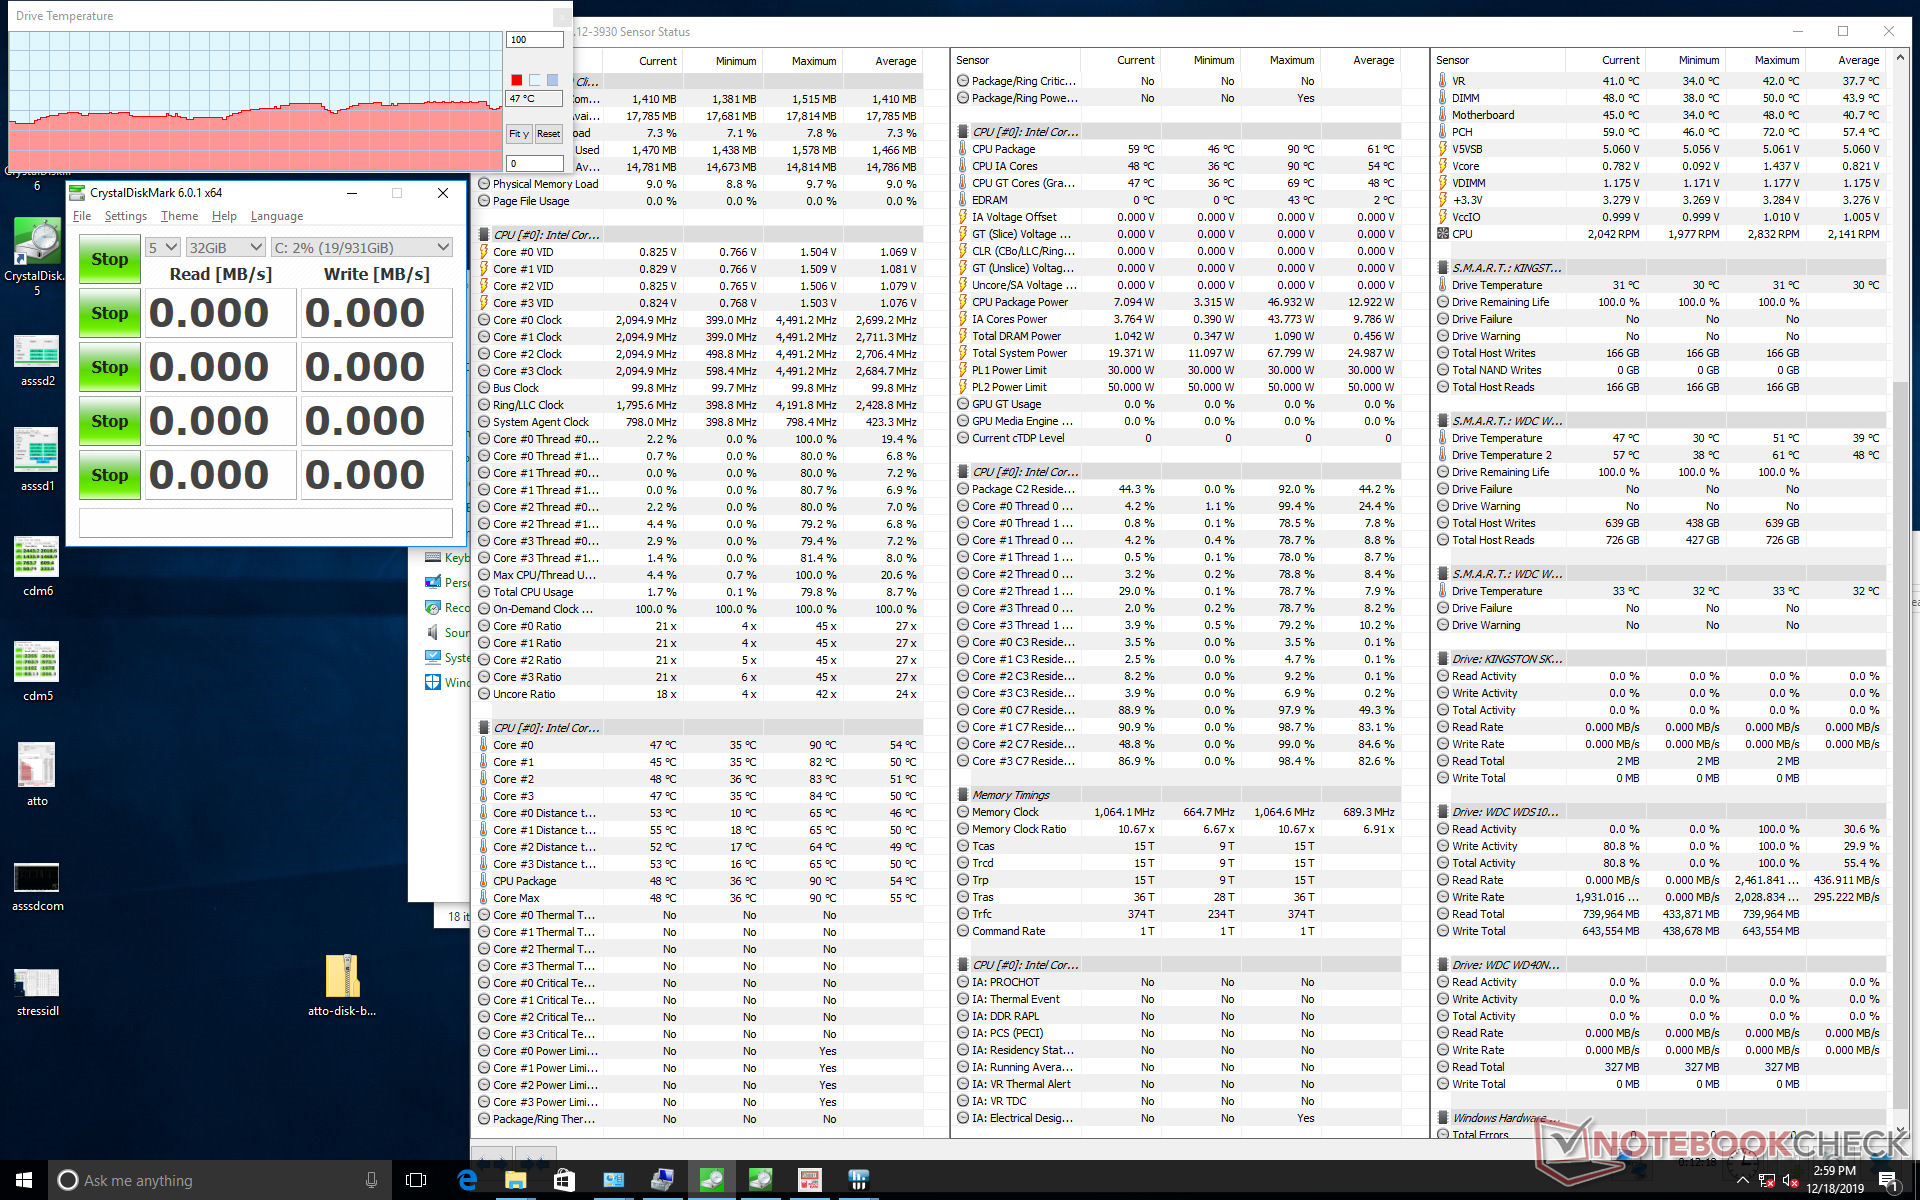
Temperature
Temperatures reach up to 51 C after two successive runs of CDM 6. WD says performance will be throttled should the junction temperature 'exceed the maximum temperature allowable for the product' without actually stating what that temperature ceiling is.
Verdict
The Blue SN550 is at its weakest when reading and writing very small block sizes of 4 KB or smaller. If your work involves moving gigabytes of these small files, then the SN550 might not be the best choice. Fortunately, most applications like gaming or editing involve much larger files where the WD SSD is at its best.
The SN550 series will begin shipping on January 2020. Note that the base $70 250 GB option will have less than half the write speeds of the top-end 1 TB option.


Price comparison
