HP Envy 13-d000ng Notebook Review
For the original German review, see here.
Our last review of a 13.3-inch device from HP’s multimedia-oriented Envy series was actually three years ago. Larger devices (like the recent HP Envy 17-n107ng) on the other hand are regular guests in our editorial offices and can usually manage good, but rarely excellent overall scores. We were therefore eager to review the new Envy 13, and HP sent us a configuration with the Intel Core i5-6200U, 4 GB RAM and a glossy QHD-IPS panel. The retail price of 1,000 Euros (~$1092) was particularly surprising, since it is rather inexpensive compared to the rivals.
HP’s pricing certainly challenges Dell and Apple: The brand-new XPS 13-9350 (FHD version) as well as the MacBook Pro Retina 13, which is still excellent, are our current leaders in the subnotebook segment. The QHD-version of the XPS 13-9350 just missed our Top 10 ranking at 87 percent, but we still use it as a reference in this article due to the similar display. Another interesting competitor actually comes from HP: The HP EliteBook 820 G2-J8R58EA is currently third in our subnotebook Top 10.
Case
If a manufacturer of a premium subnotebook wants to be on the safe side in terms of the design, they just copy the design from Apple. HP does not make any experiments with the Envy 13 and follows the role model pretty closely – and the result is appealing. The chassis is primarily made of brushed aluminum, which not only looks great, but it also hardly flexes under pressure. The bottom cover and the lid on the other hand are much more flexible (and feel more like plastic). There are no artifacts on the screen when you apply pressure at the back, but this Envy is not very torsion-resistant. Otherwise, there is not a lot to criticize about the build quality: The hinges are taut and only allow a slight wobbling of the screen, which can be opened up to 135 degrees. Small gaps support the generally decent build quality.
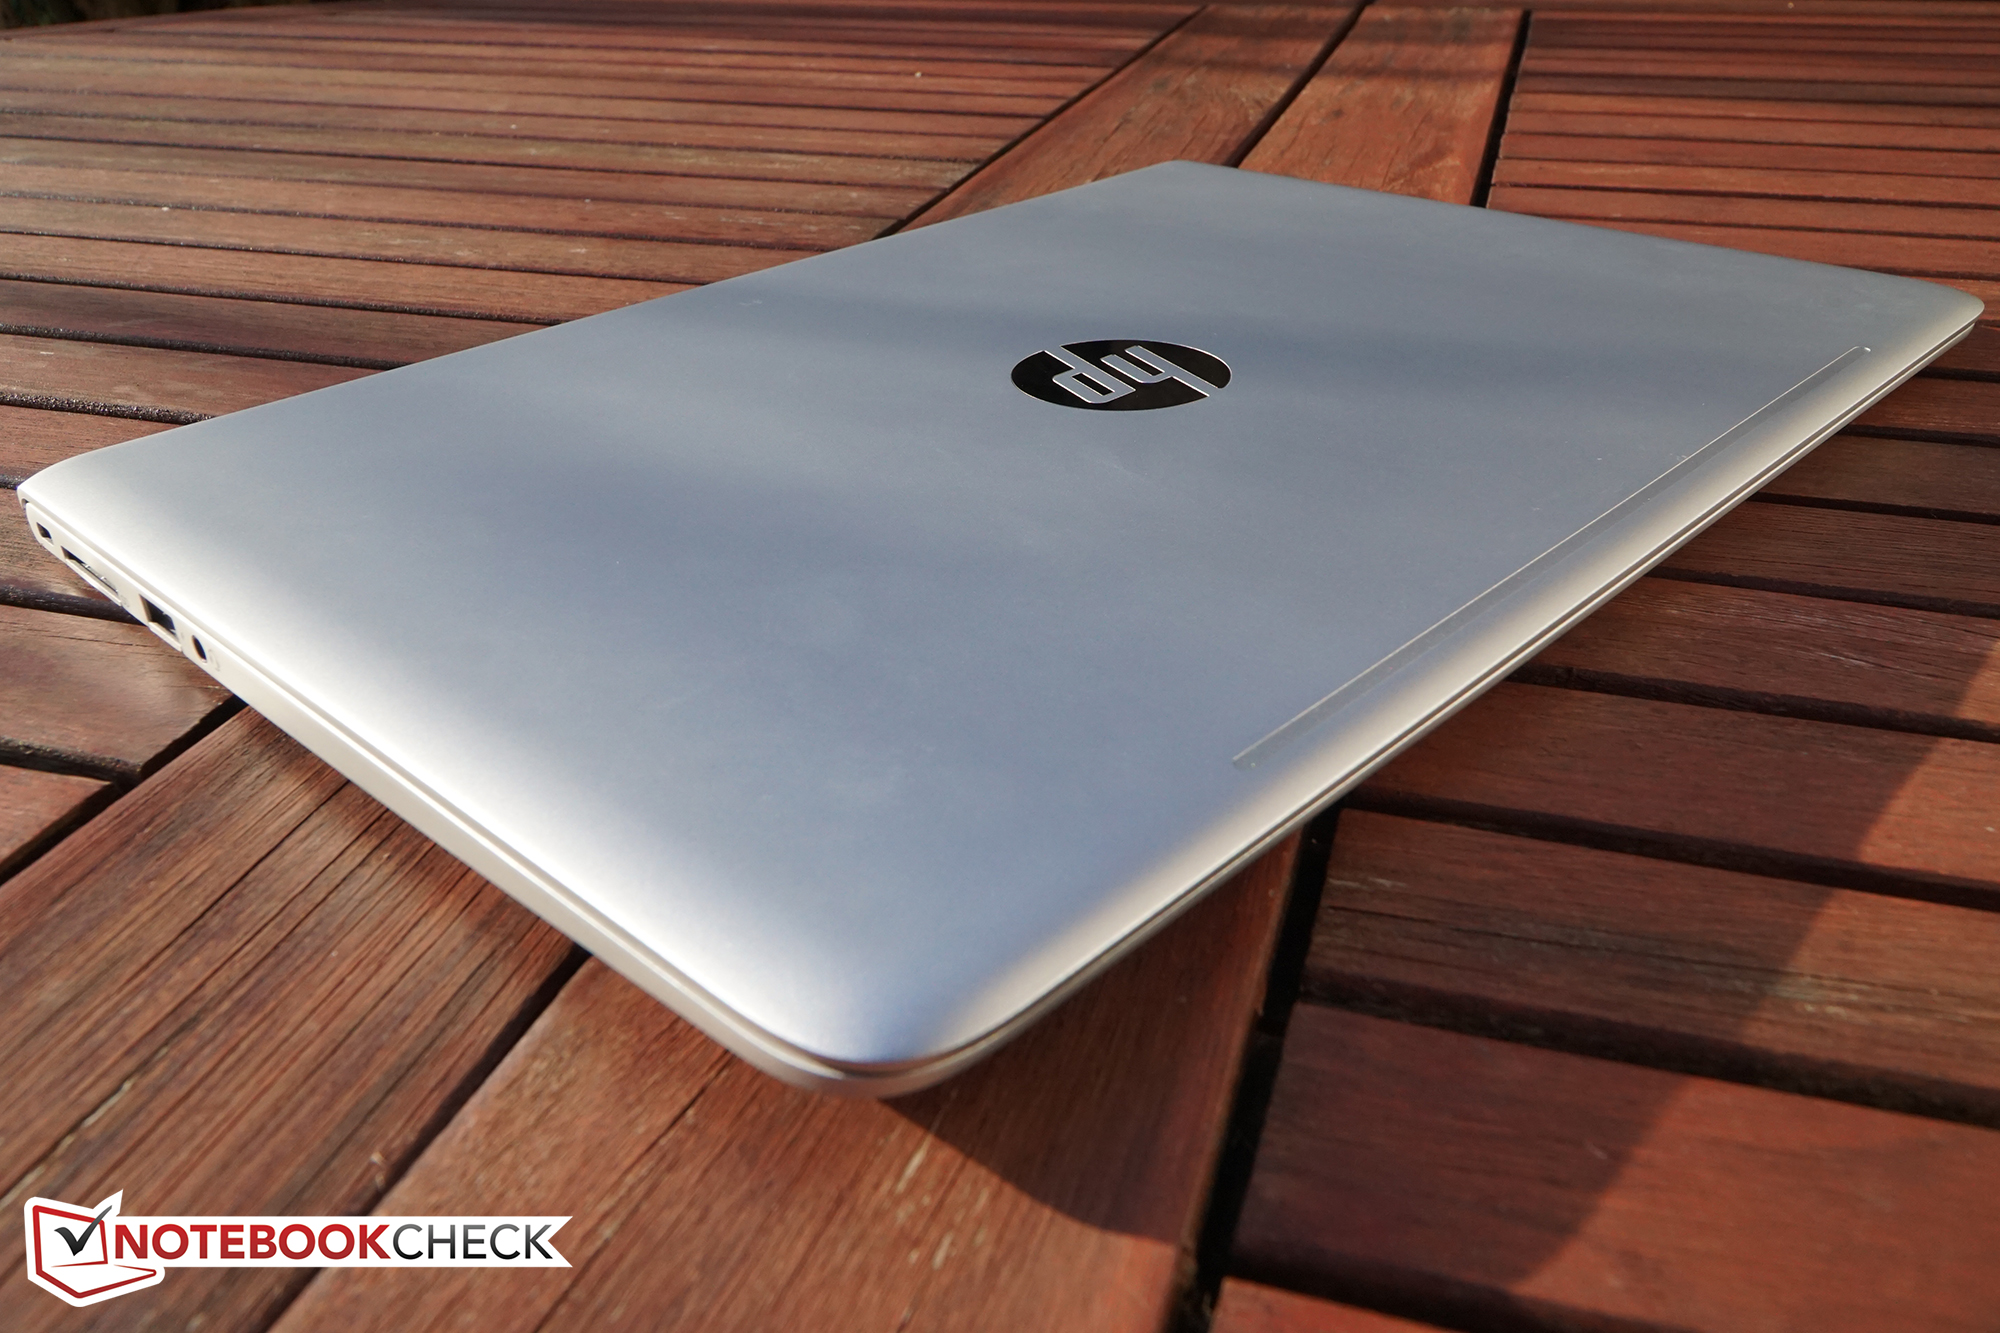
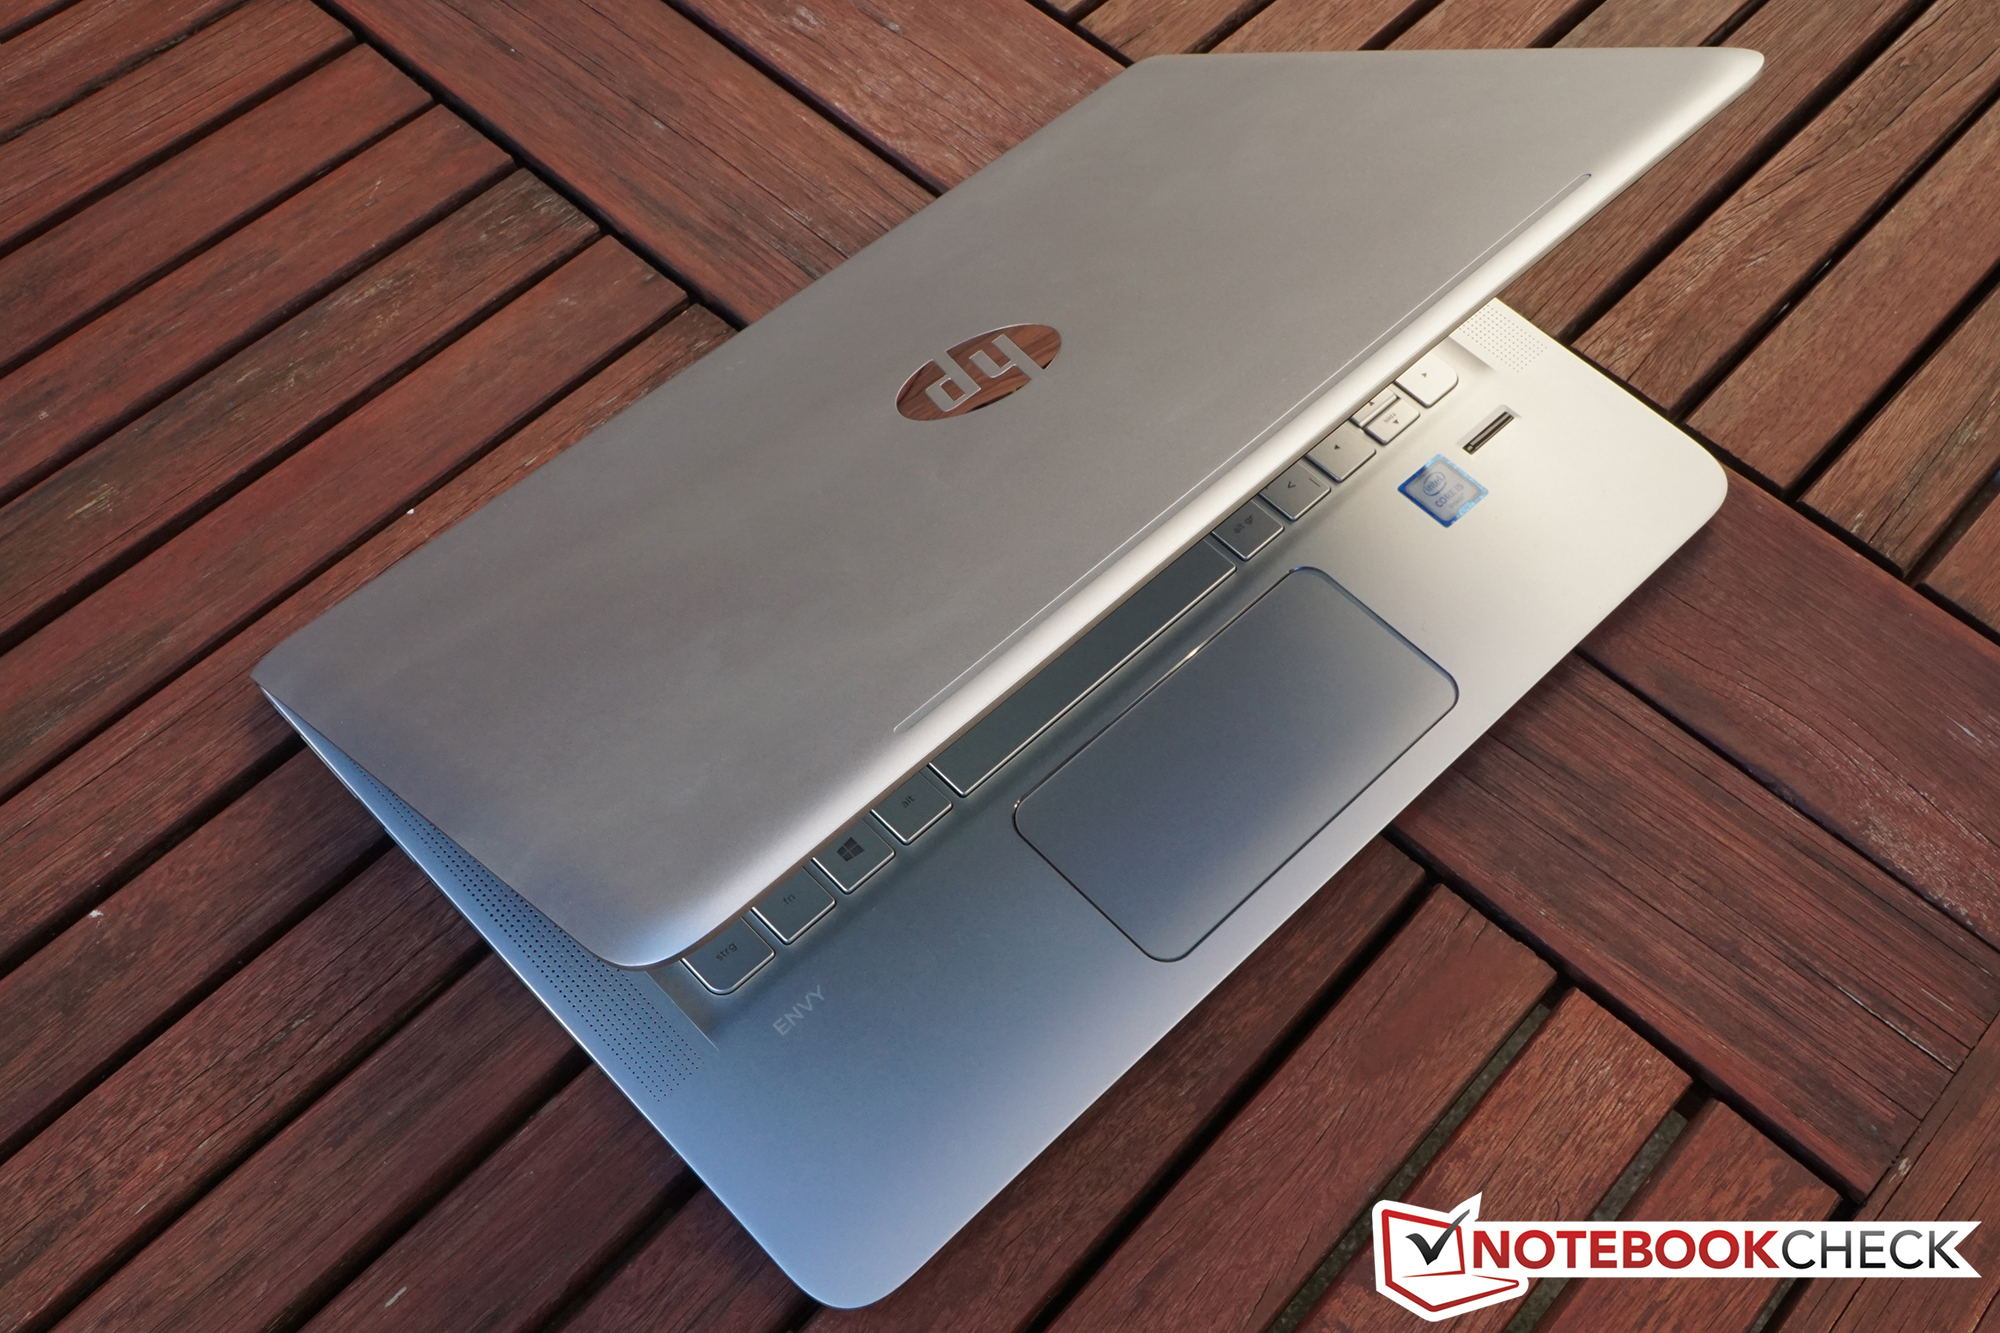
HP extensively advertises the low height of the Envy 13 – it seems like the marketing department was focused on the terms "thin" and "flat". Well, the device is flat (or thin) at just 13 millimeters (~0.5 in) – no competitor can beat our review unit. That does change, however, when we have a look at the other dimensions, where the Envy 13 actually has the largest footprint within our comparison. Moreover, even though it certainly does not look dull it is not as delicate as the slightly lighter (by 100 grams/~3.5 oz) XPS 13 with its thin InfinityEdge display. It seems that "thin" is a very subjective term after all.
Connectivity
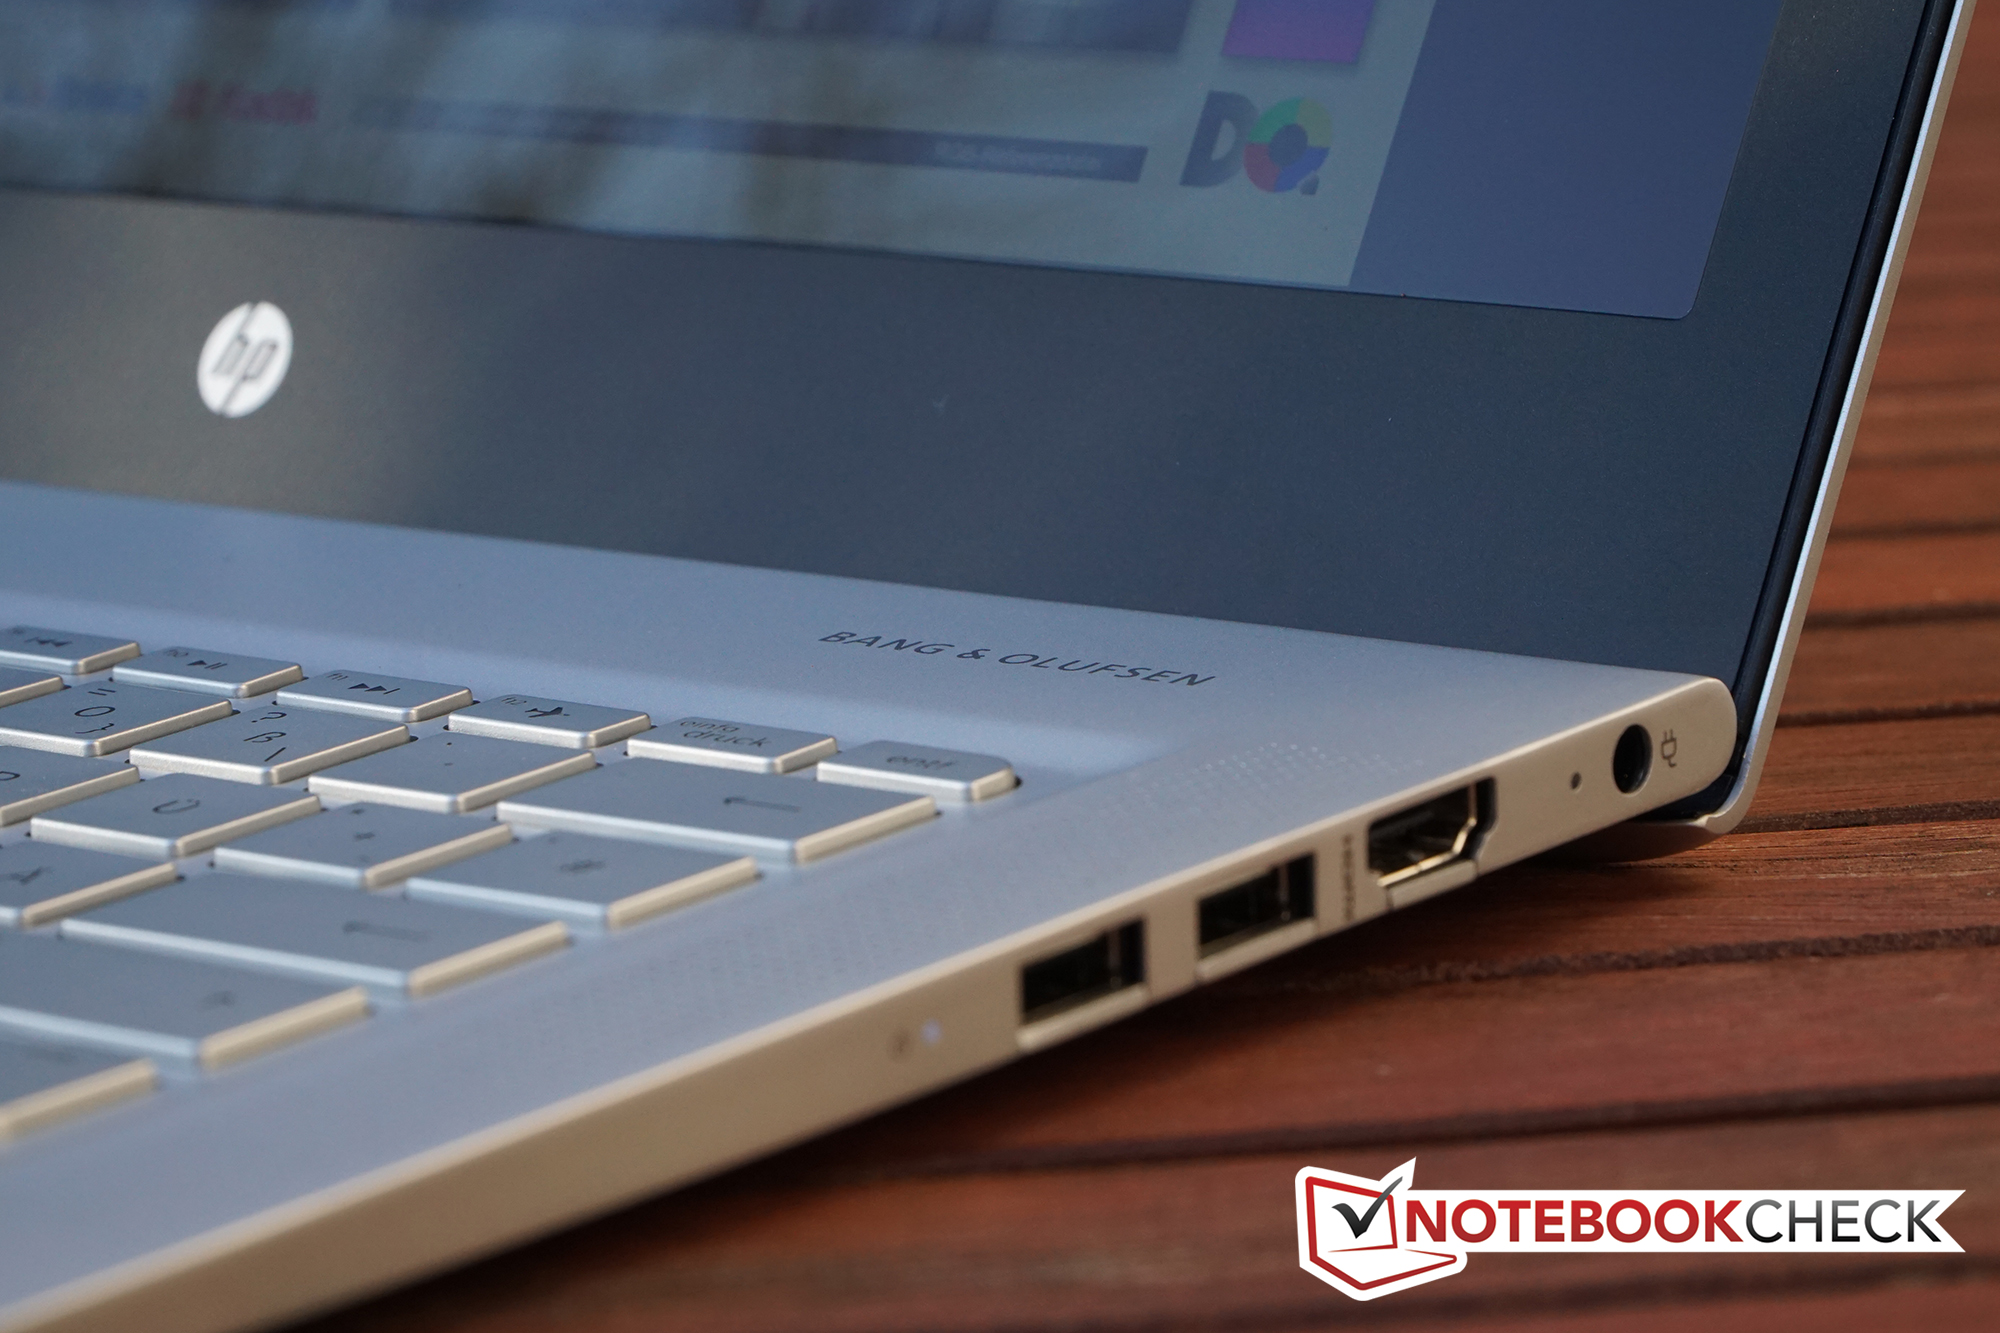
HP offers the essential port selection, but you will not find any special ports. Three USB ports are available for external file transfers; one of them is always powered, so you can also use the Envy 13 as an external battery. An SD-card reader, one HDMI-out (1.4) and a combined stereo jack: That's it. All the ports are located at the rear areas of the sides, so there should not be any problems when you use an external mouse.
HP also offers a special USB-Gigabit-LAN cable, so you can at least compensate the missing RJ45 port. However, it is not a simple adaptor, but a USB network card (the Envy does not even have an Ethernet adaptor according to the System Control). Third-party solutions are often much cheaper, though. The rival Dell XPS 13-9350 shows that there is a better solution, despite the limited space: A Thunderbolt/USB 3.1 Gen 2 port, for example, in combination with a combo adaptor for HDMI, VGA and RJ45.


Card Reader
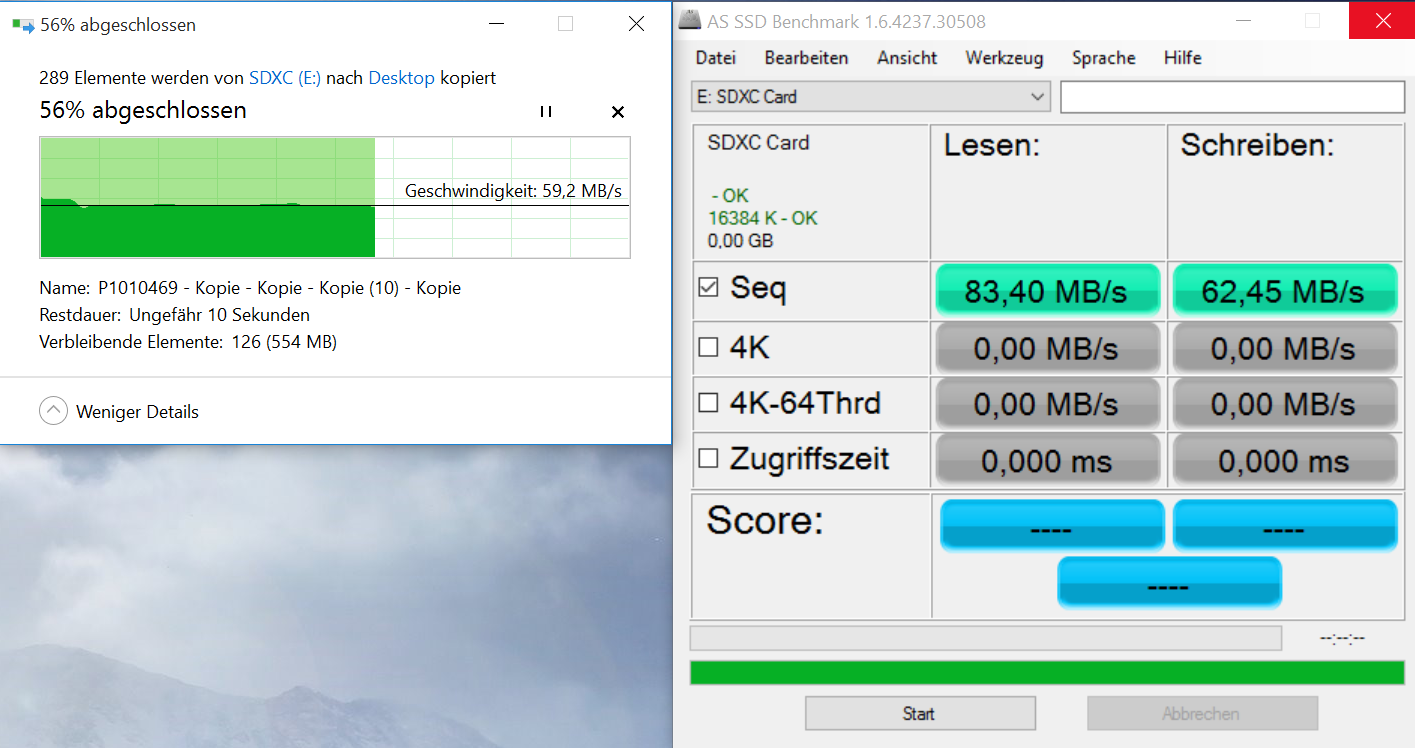
We check the transfer rates of the SD-card reader with our fast reference card Toshiba Exceria Pro 64 GB UHS-II. It manages 83.4 MB/s (read) and 62.5 MB/s (write) on average. The transfer of our picture folder (1,090 MB) from the card to the local hard drive takes about 20 seconds, which is an average result. The Envy is far away from the best as well as the worst devices (compare around 72 seconds for the Acer Aspire V 15 Nitro VN7-572G vs. 10 seconds for the Dell XPS 13-9350).
Webcam
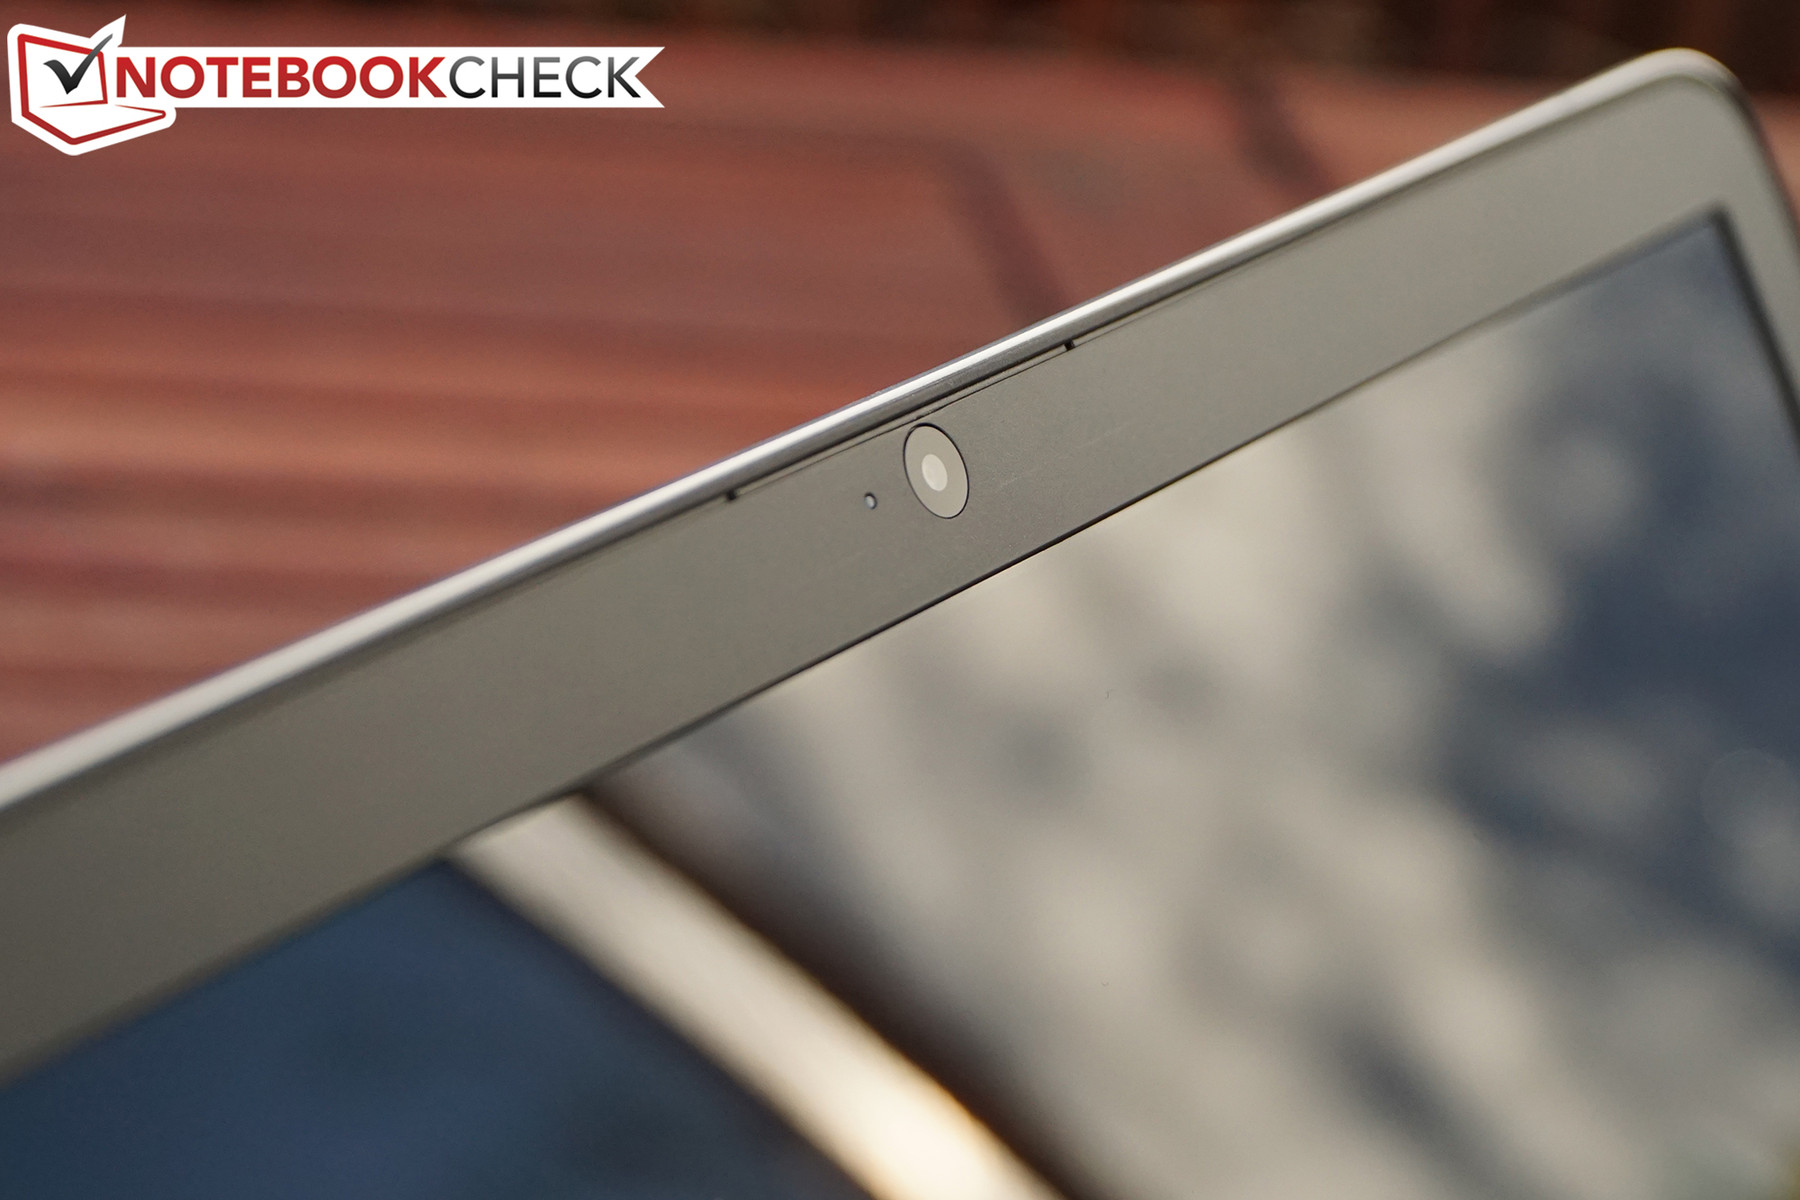
"Catch all the details with brilliant clarity – even in low-light-situations." This is at least the marketing slogan from HP for the TrueVision HD Webcam of the Envy. Okay, you might already guess that "all details with brilliant clarity" do not really suit the 720p resolution. The blurry quality of the first picture (taken under normal illumination) is not so surprising though. A comparison with the same object in twilight is disappointing as well. You could at least recognize some surface structures in the first picture, but now there are only blurry areas. At least the dual-array microphone can convince with the promised transparent voice during chats or recordings.


Communication
Intel's Dual Band Wireless-AC 7265 handles wireless network connections, both via Wi-Fi with the 802.11ac standard and transfer rates of up to 867 Mbps and Bluetooth 4.0. The signal quality was very good in both 2.4 and 5 GHz networks, and the connection was subjectively fast and stable over two floors. We already mentioned that the Envy does not feature an Ethernet adaptor for even faster network connections – potentially an issue when you want to use the device productively.
Security
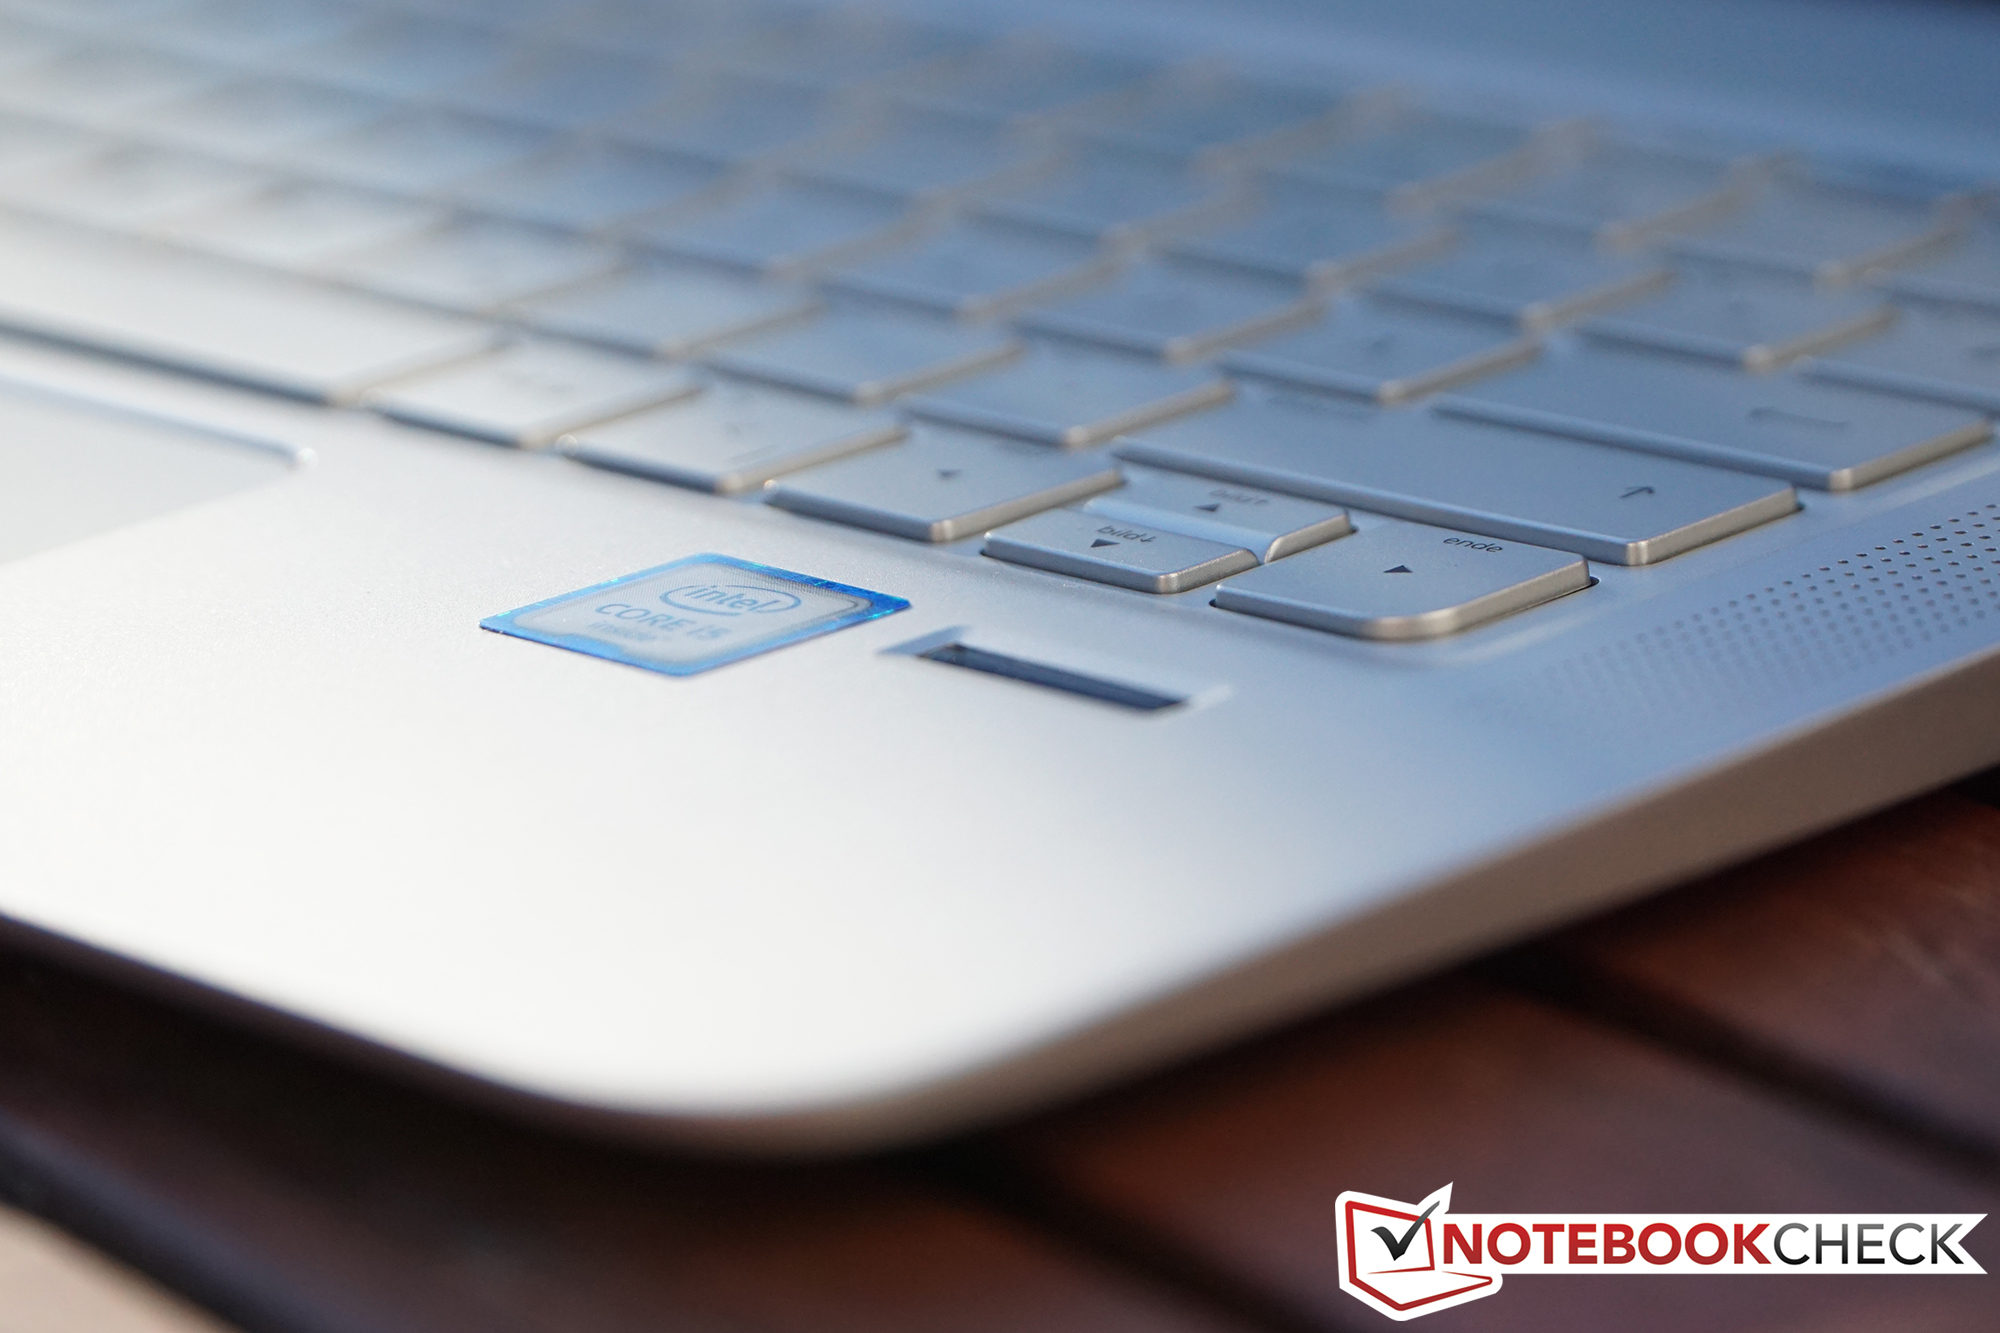
The Envy 13 has one important advantage over the rivals from Dell and Apple, for example, in an office environment: The fingerprint reader including its handy software to manage passwords – so web log-ins are also possible via fingerprint. A Trusted Platform module (2.0) is integrated as well to improve the security. Compared to the rival HP EliteBook 820 G2 you will have to waive a SmartCard reader, but it is also a real business notebook and almost twice as expensive.
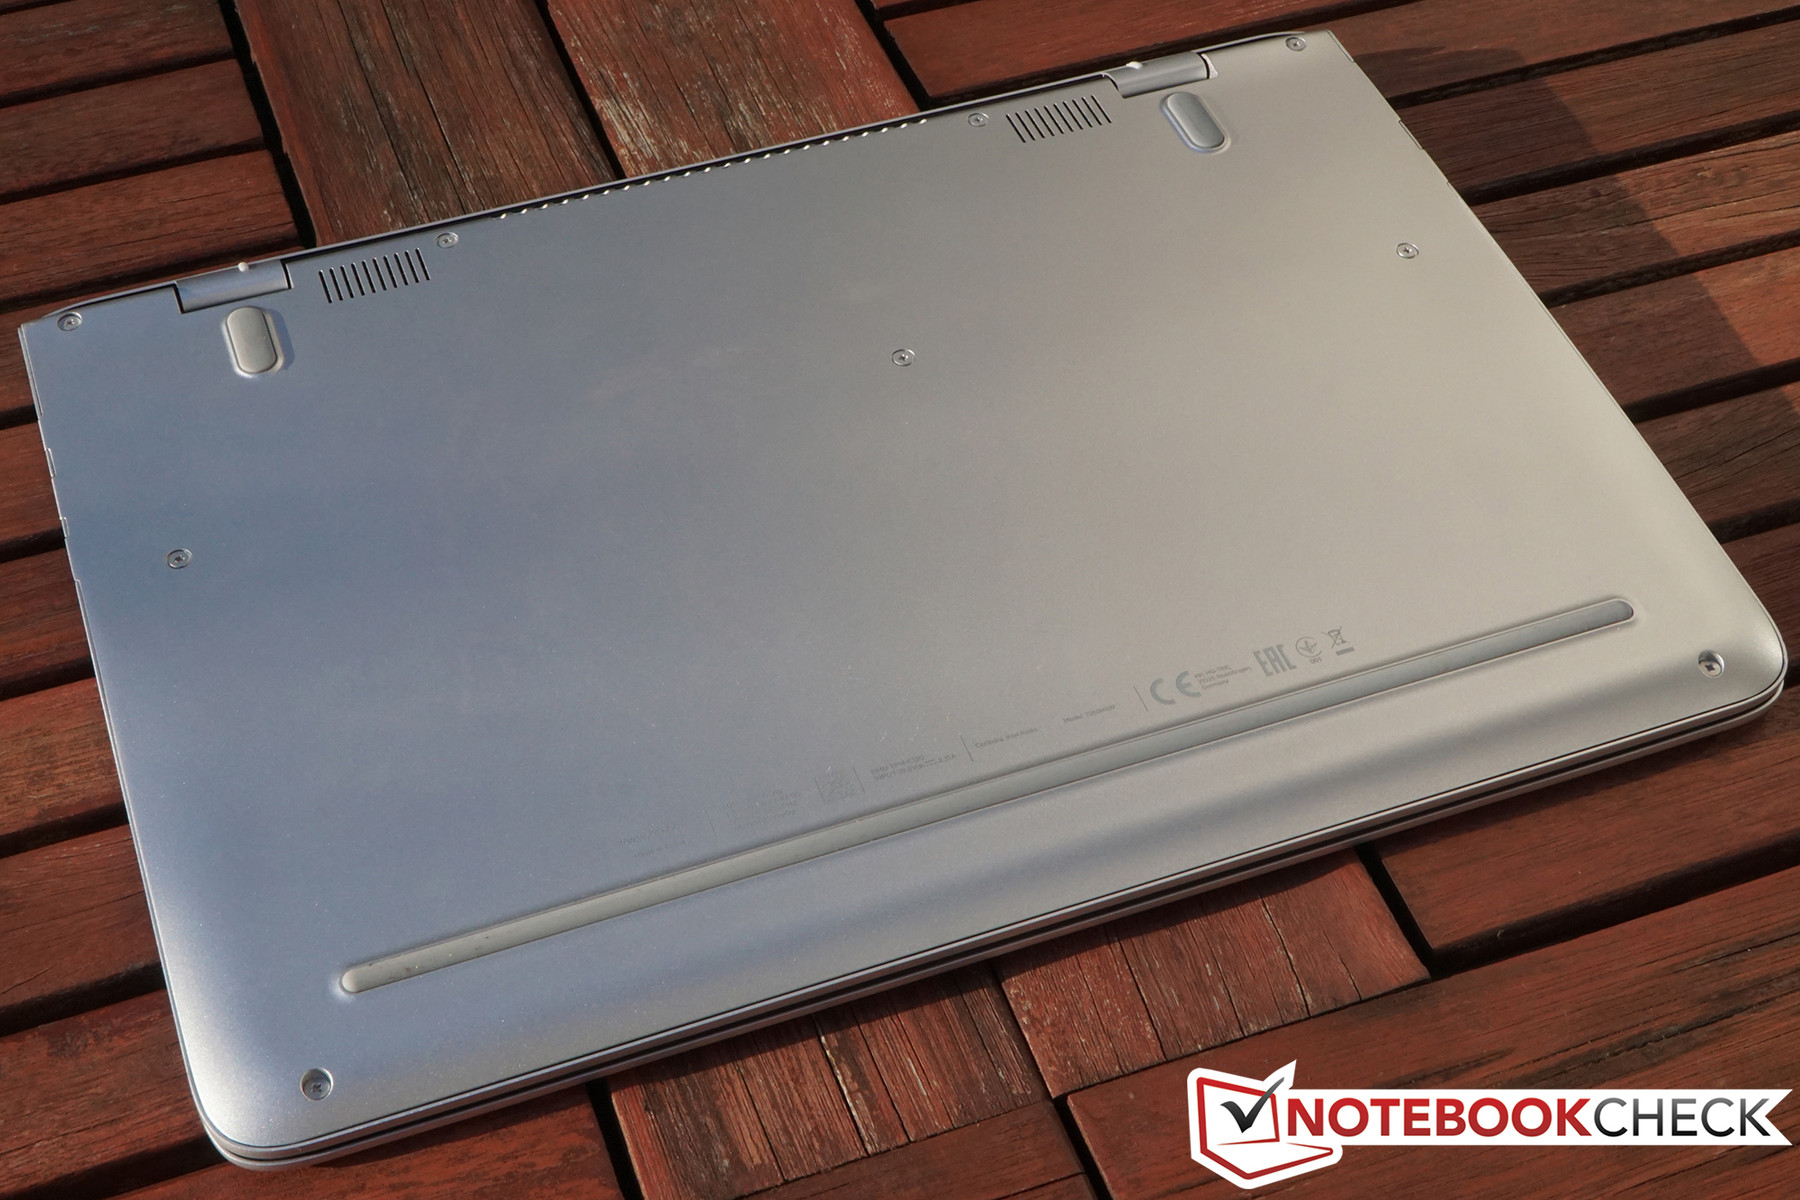
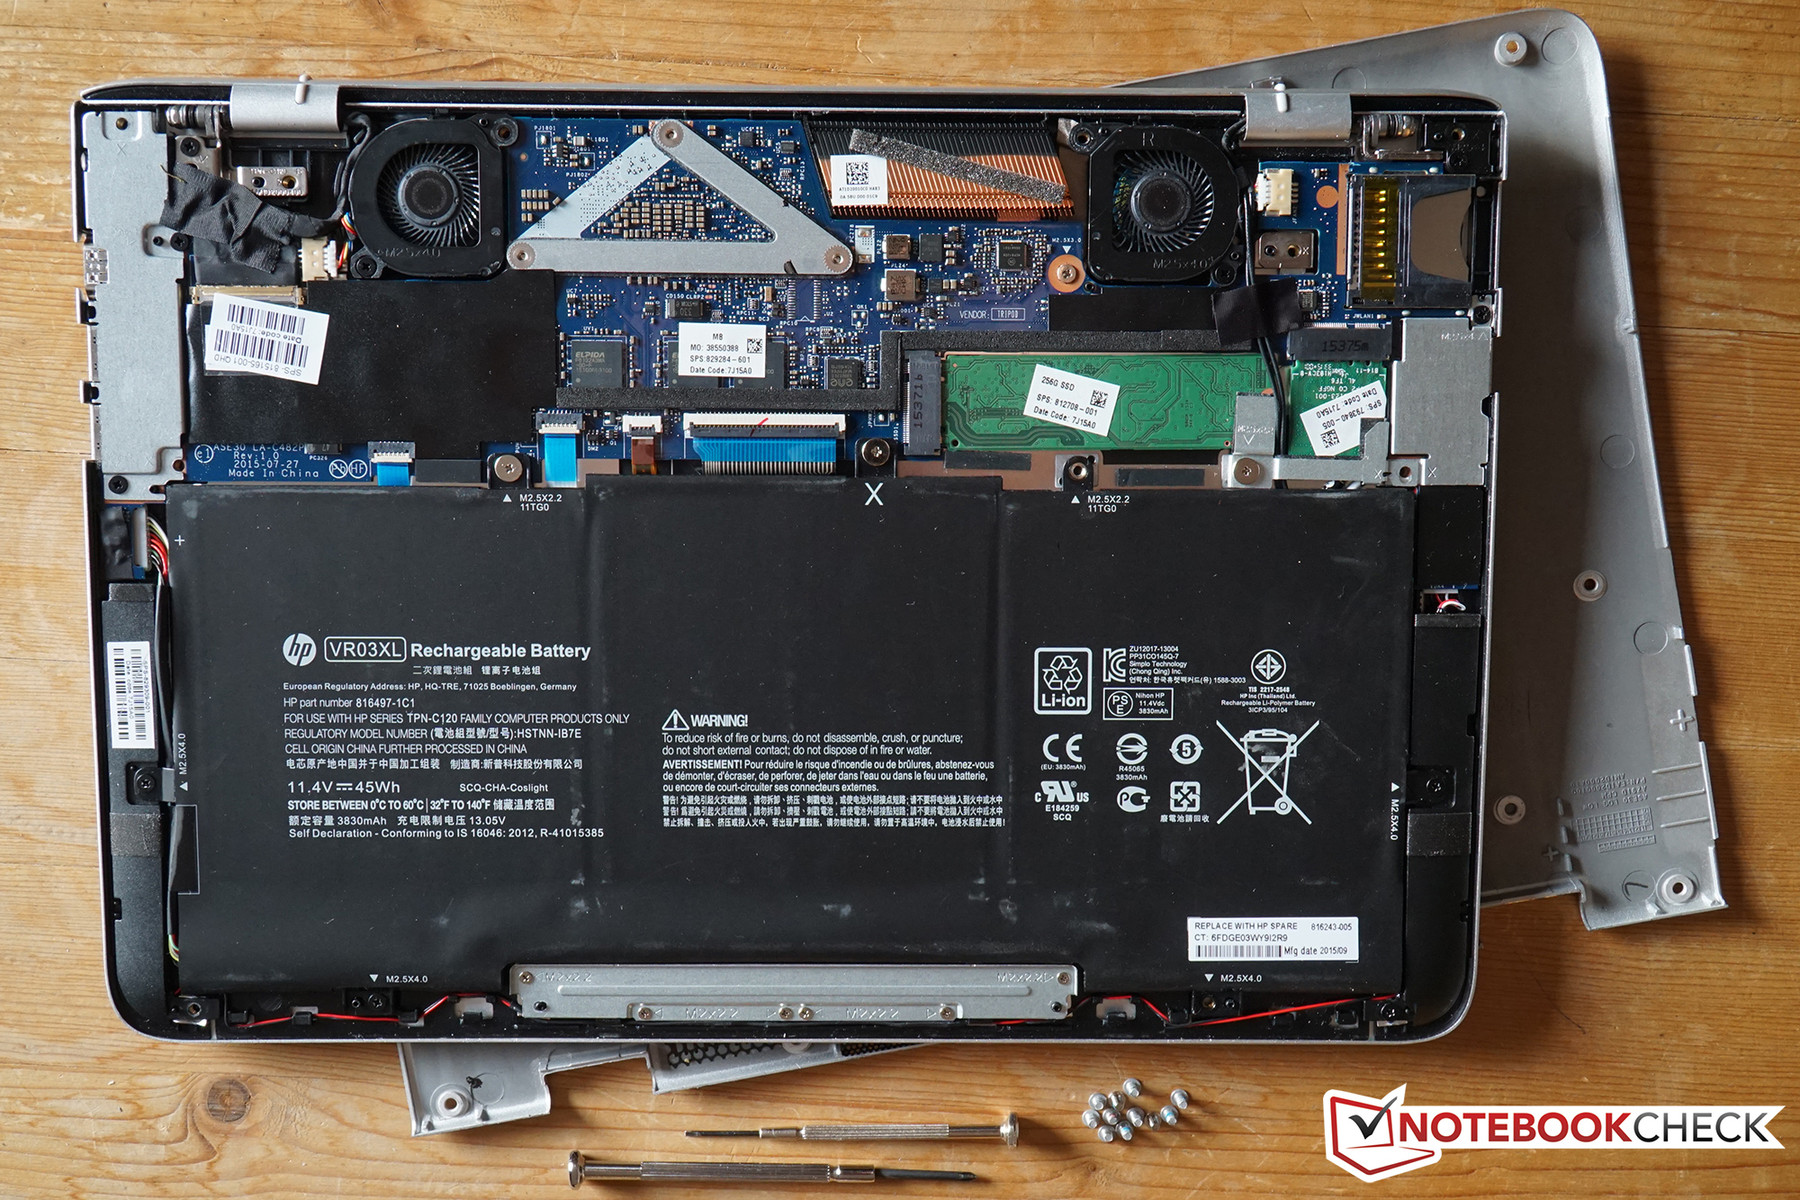
Maintenance
To access the internals of the Envy 13, you have to loosen around a dozen small Philips screws at the bottom (two are hidden underneath the support feet). After that, you can remove the cover with a sharp object – the small gaps are helpful in this case. There are, however, not many reasons to open the device and possibly even damage the nice aluminum chassis except for the necessary cleaning of the fan. You can only replace the wireless module, the M.2 SSD as well as the battery; all the other components including the memory are soldered onto the mainboard.
Accessories
The preloaded Windows 10 x64 in the Home Edition is also available on a recovery partition (not hidden). Otherwise, there is nothing in the box except for some warranty information.
Warranty
The standard warranty period is two years including a Pick-up & Return service – another indication of the business orientation of the Envy 13 and a real additional value for potential buyers. The service can also be extended by another year for around 80 Euros (~$87); you will even get an additional three-year insurance against damages for 130 Euros (~$142).
Input Devices
Keyboard
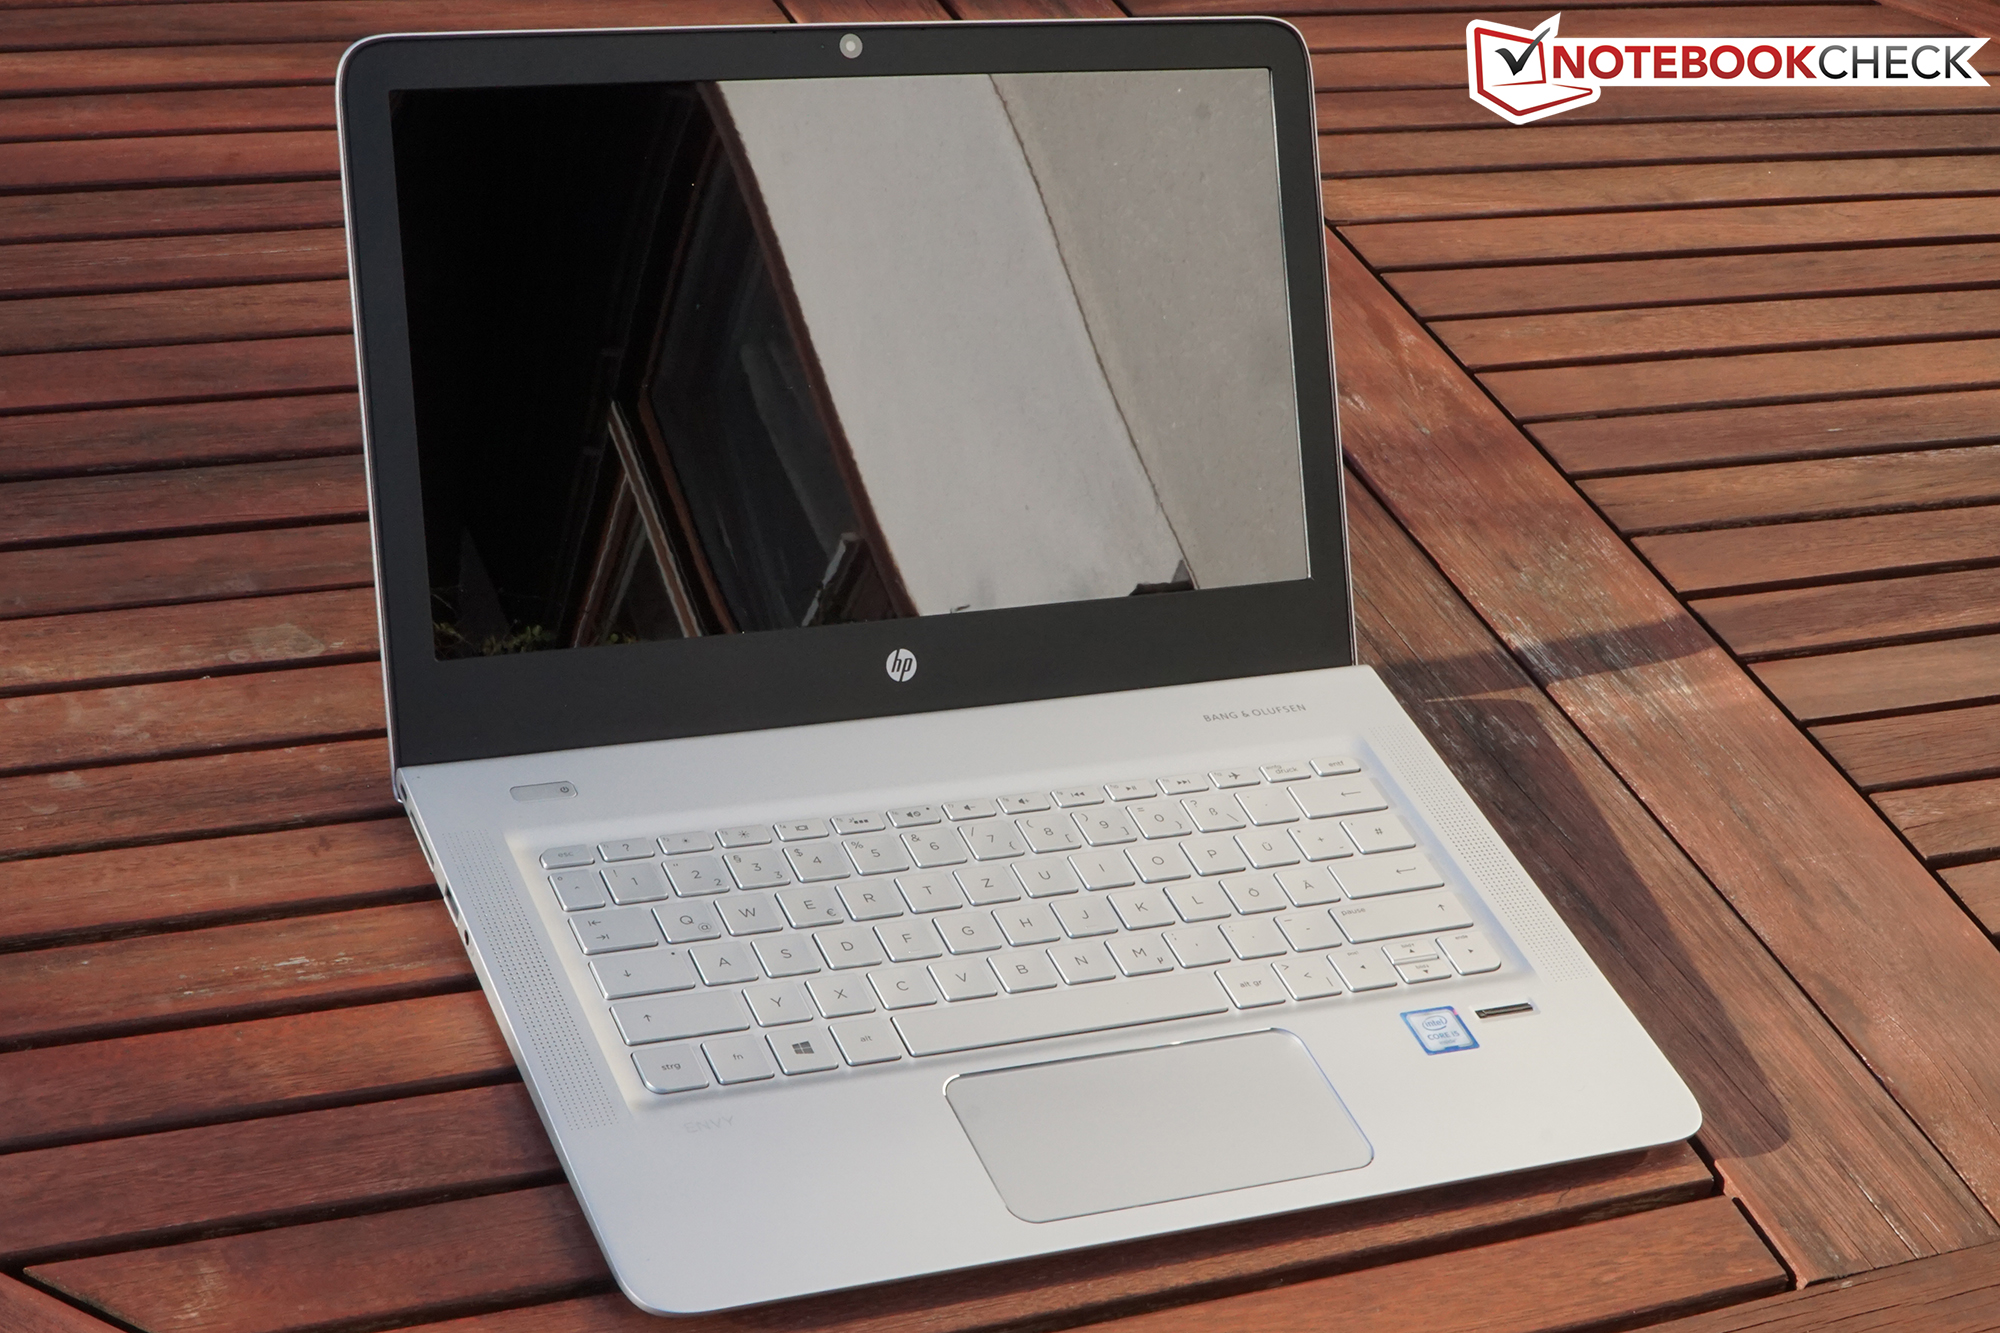
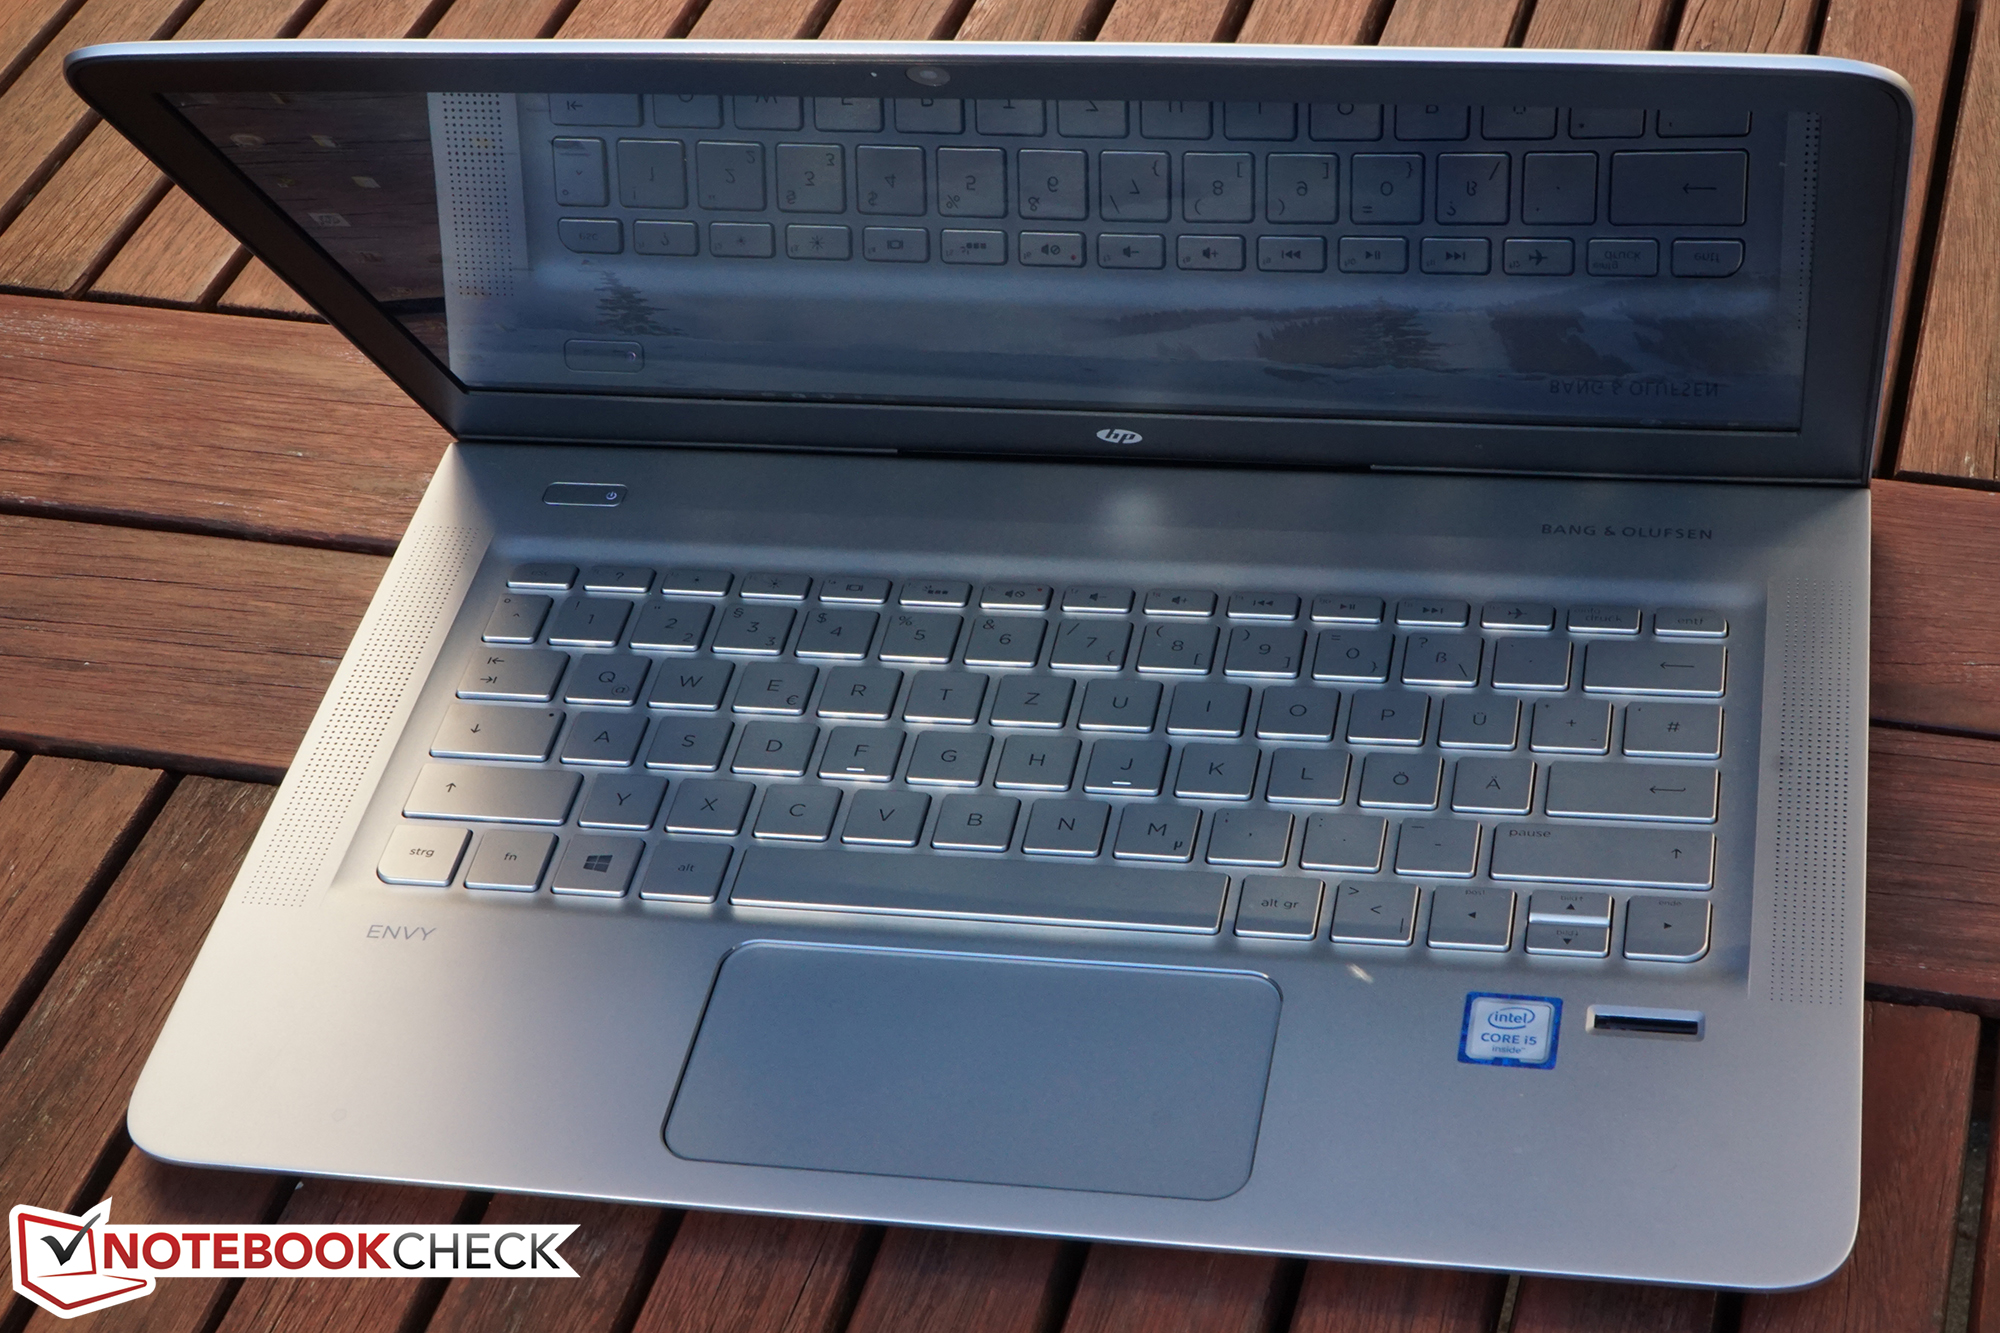
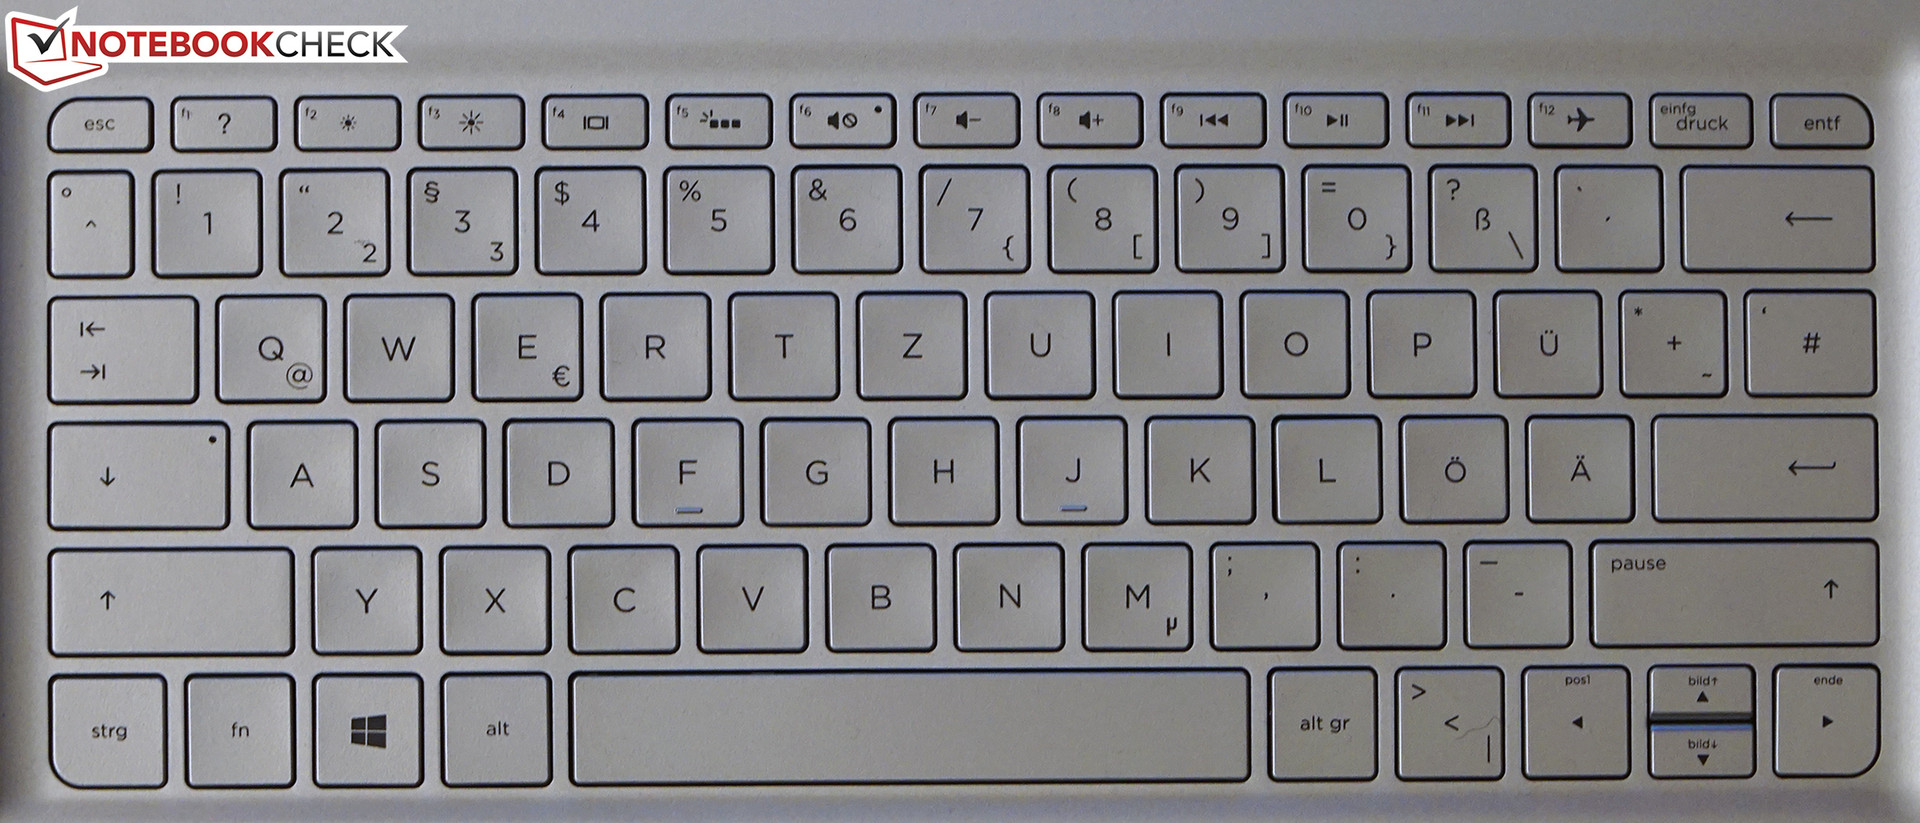
The keyboard is a compact chiclet model with additional background illumination. The key travel is short, which is typical for a subnotebook. The pressure points of the sufficiently sized keys are well defined, but there is flexing when you press a bit harder. All in all, this results in a rather spongy typing experience.
Touchpad
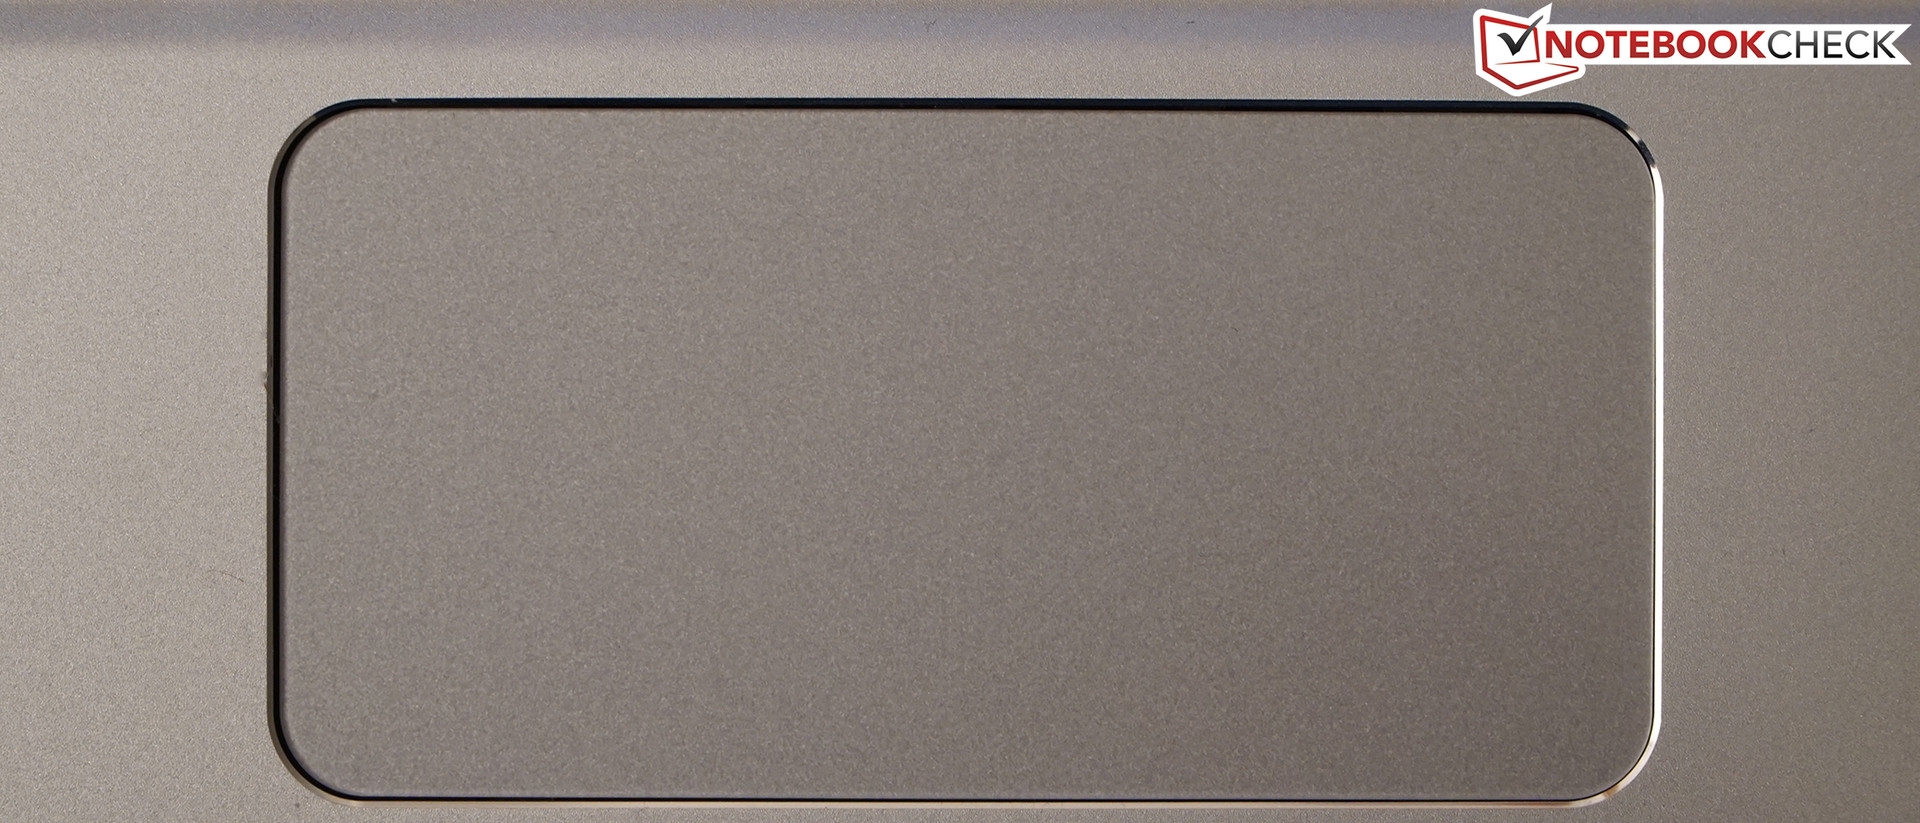
The trackpad with multi-touch support is generously sized and responsive up into the peripheral areas. Inputs are precise thanks to the smooth surface and multi-touch gestures are well executed. Less convenient is the fact that more pressure in the upper third of the pad will have an impact on the (not dedicated) buttons and triggers a left click. Perhaps this is a feature, but the author cannot really make sense of it; it resulted in some accidental inputs during our review period.
Display
One highlight of the HP Envy 13-d000ng is certainly its (glossy) quad-HD display. 3200x1800 pixels result in a pixel density of 269 PPI. Icons and fonts scale well in Windows 10, so the picture is easily visible and razor-sharp on the 13.3-inch screen. The Envy 13 is also available with a matte FHD panel (as well as 8 instead of 4 GB RAM); HP charges 1,000 Euros (~$1092) for both configurations.
We can see another specialty of the display under the microscope. The majority of panels only have red, green and blue sub pixels; all three colors combined result in the color white. This classic color arrangement does also result in a dampening of the light and therefore a lower luminance for white contents. This phenomenon can be reduced by adding an additional white subpixel in the display matrix – as we can see in the macro shot of the Envy display. The reward of this measure is a brilliant white as well as a good (even though not overwhelming) display brightness. The brightness distribution of the panel is unfortunately not very even; it drops significantly towards the left side, even though it is not a big deal in practice.
| |||||||||||||||||||||||||
Brightness Distribution: 82 %
Center on Battery: 292 cd/m²
Contrast: 462:1 (Black: 0.63 cd/m²)
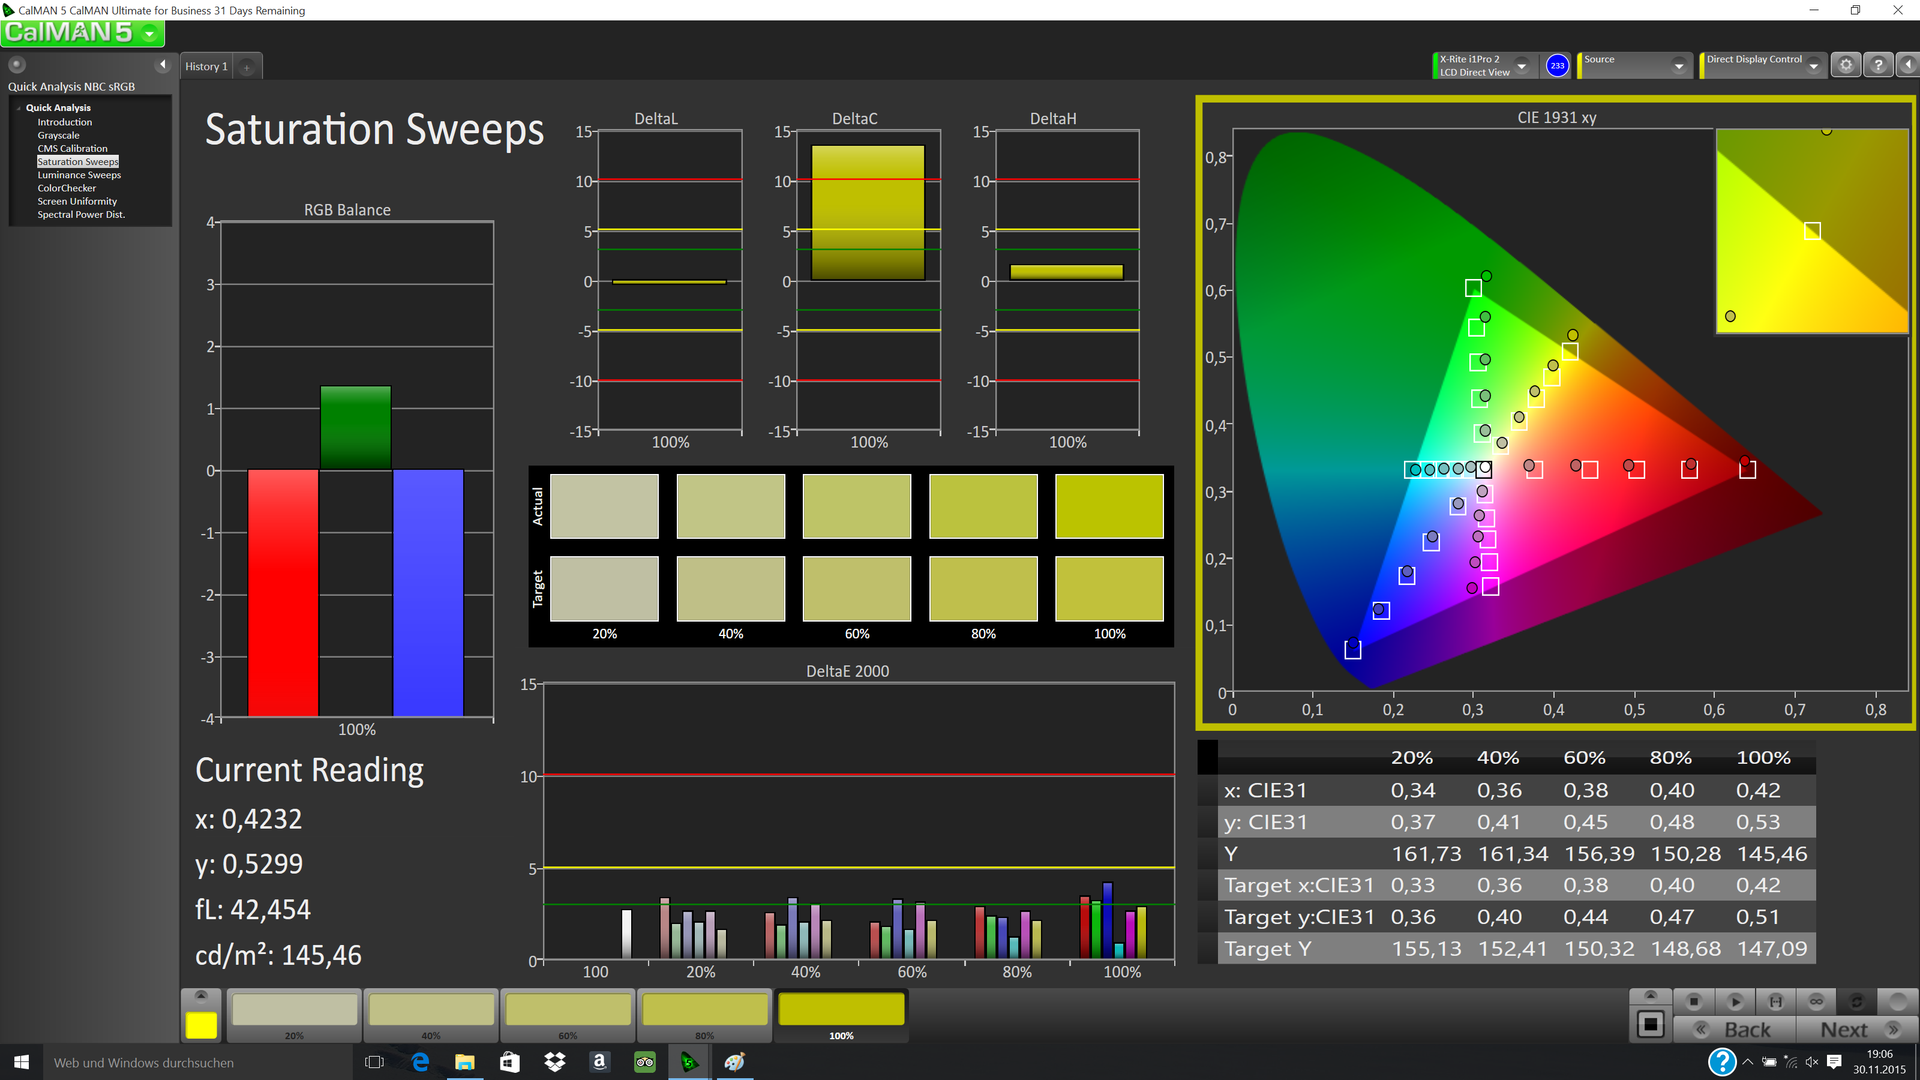
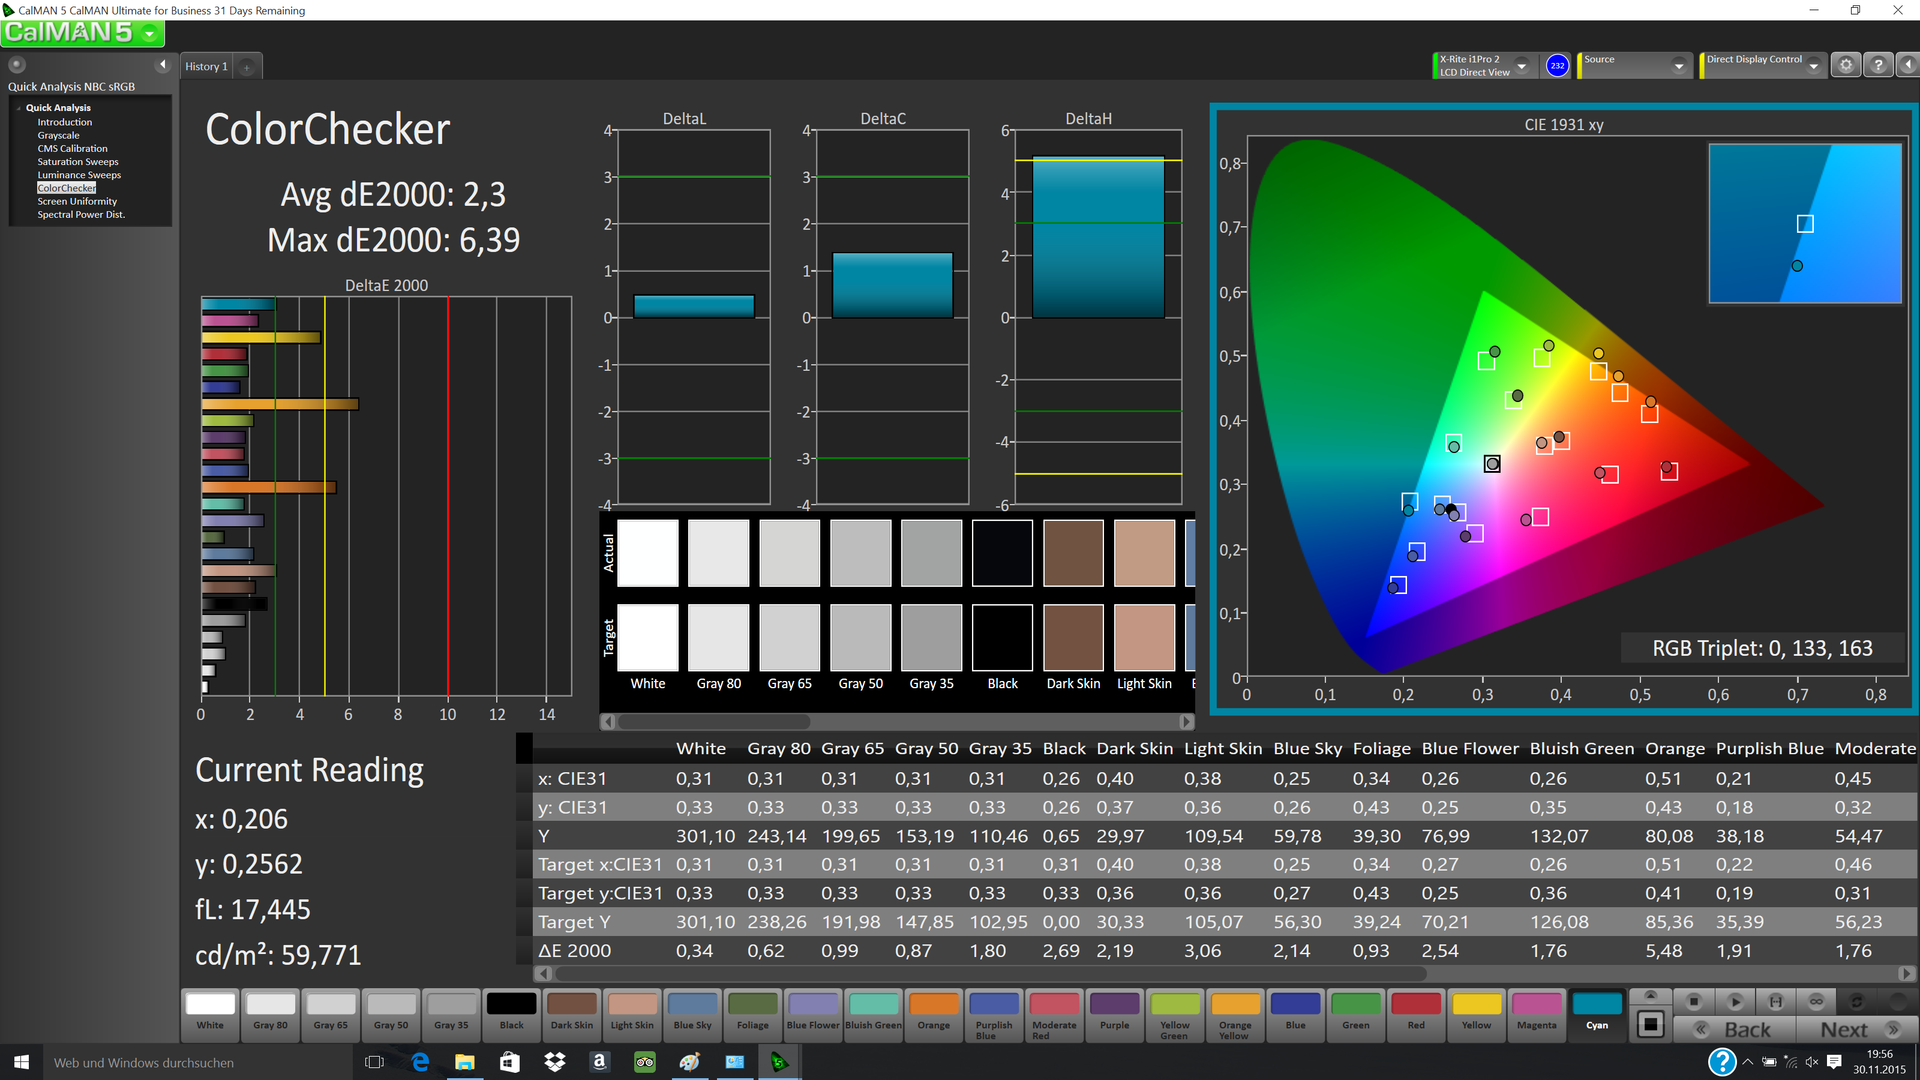
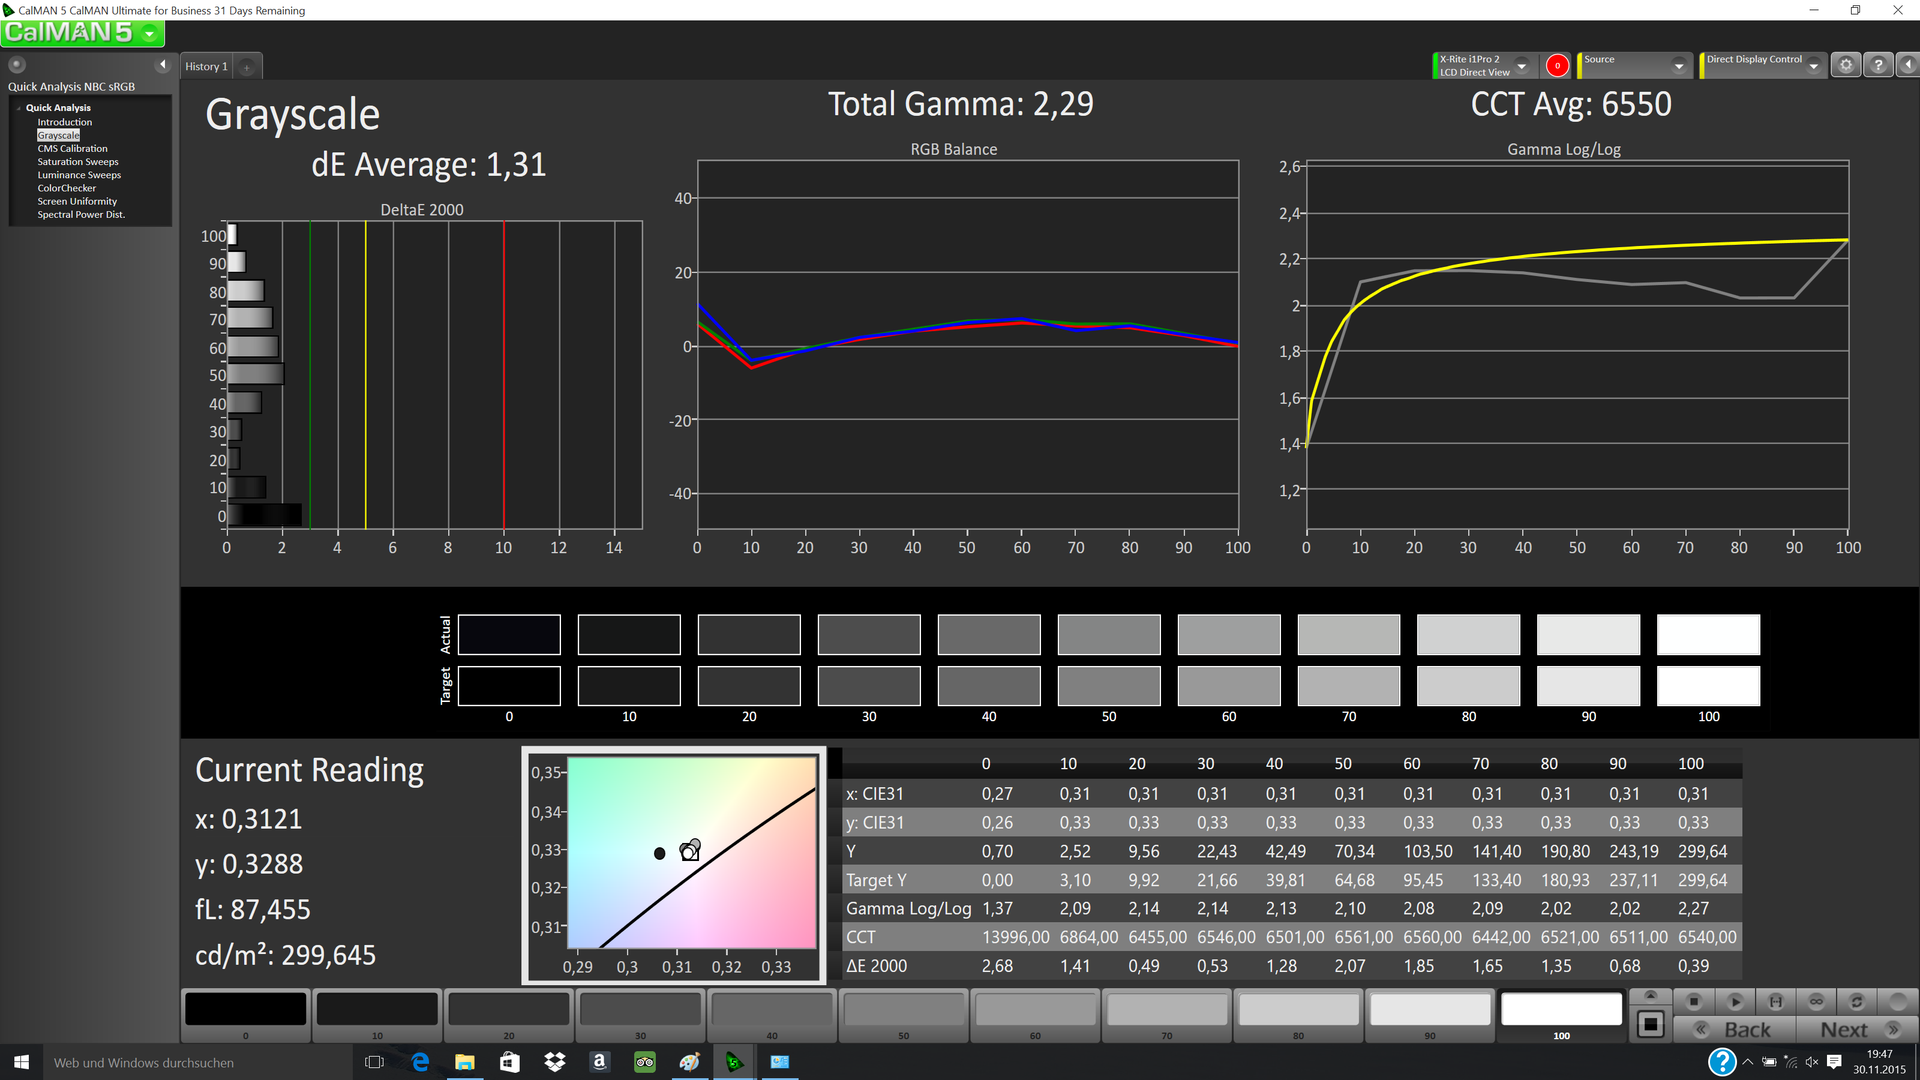
ΔE ColorChecker Calman: 2.76 | ∀{0.5-29.43 Ø4.72}
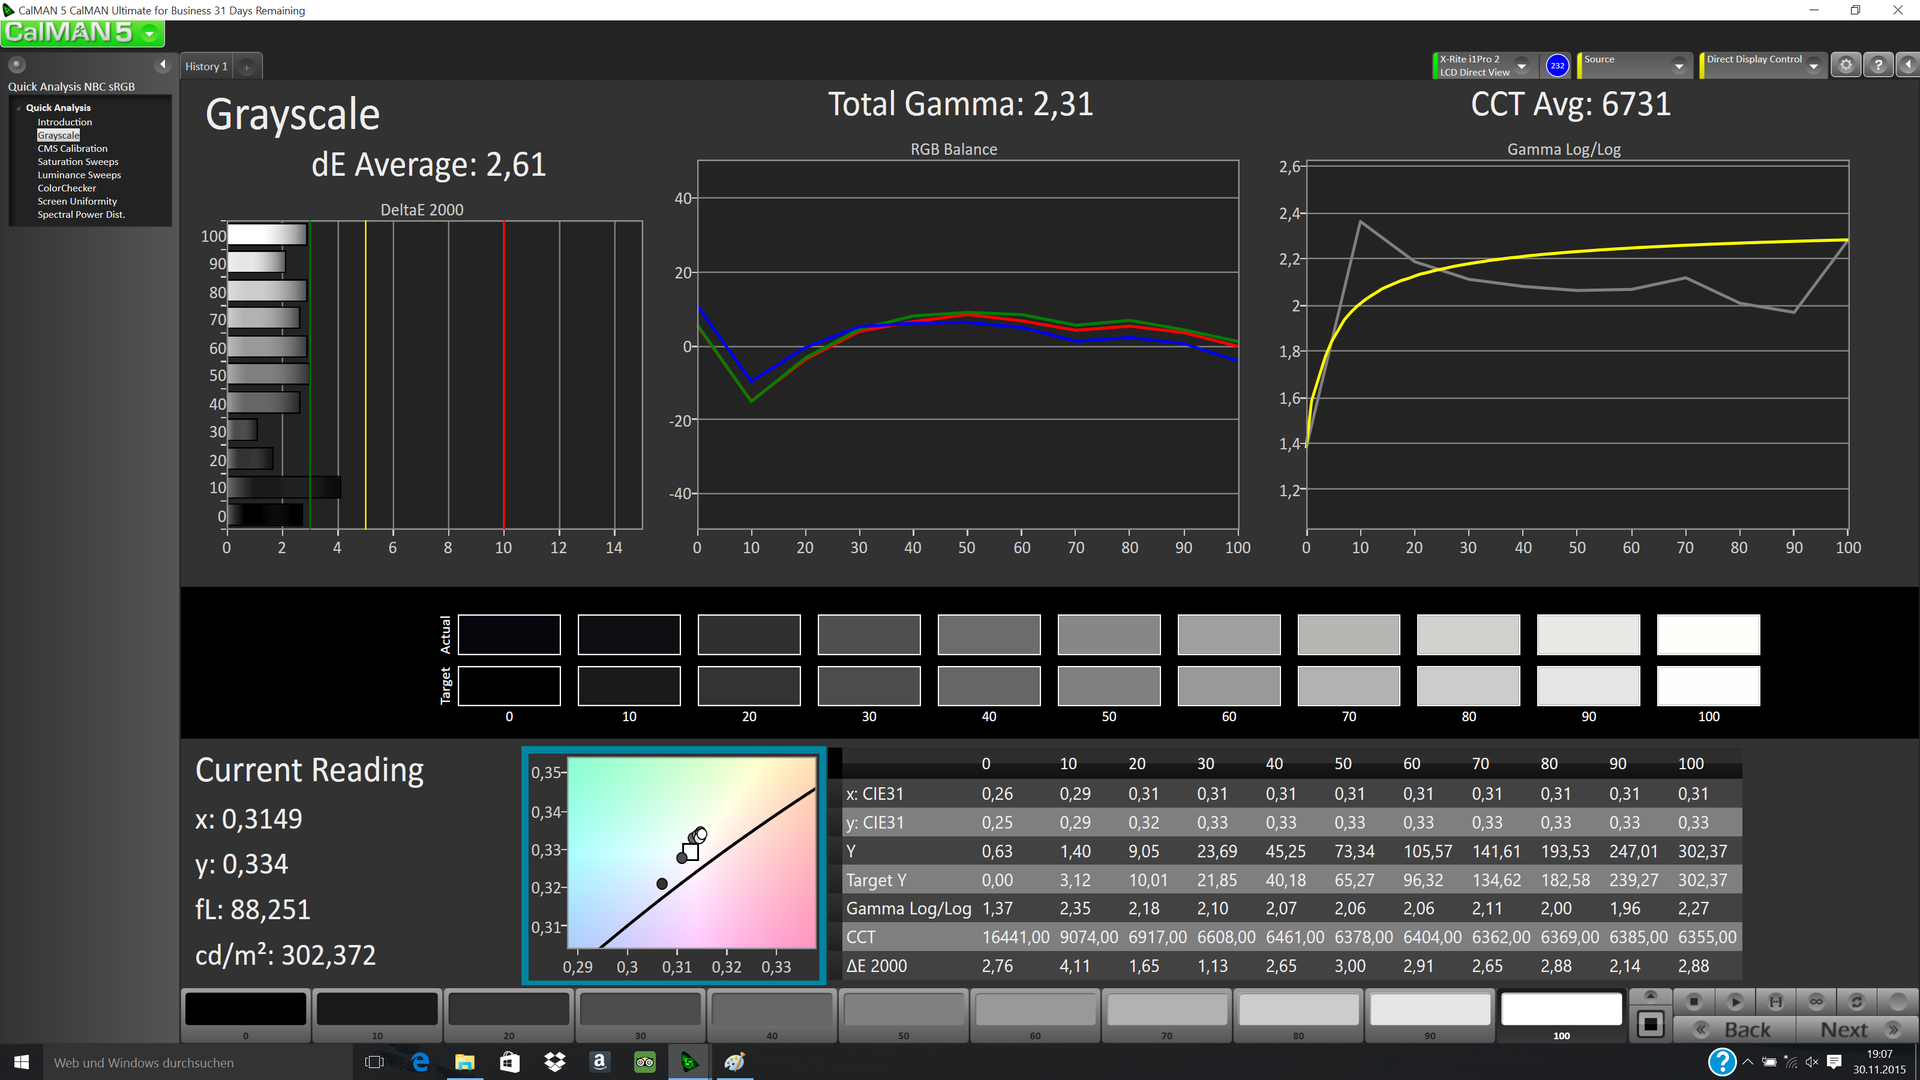
ΔE Greyscale Calman: 2.61 | ∀{0.09-98 Ø4.97}
88.7% sRGB (Argyll 1.6.3 3D)
57.5% AdobeRGB 1998 (Argyll 1.6.3 3D)
65% AdobeRGB 1998 (Argyll 3D)
88.8% sRGB (Argyll 3D)
64% Display P3 (Argyll 3D)
Gamma: 2.31
CCT: 6731 K
| HP Envy 13-d000ng 13.3", IPS, 3200x1800 | Dell XPS 13 2016 i7 256GB QHD 13.3", IGZO , 3200x1800 | Dell XPS 13-9350 13.3", IPS, 1920x1080 | HP Elitebook 820 G2-J8R58EA 12.5", IPS, 1920x1080 | Apple MacBook Pro Retina 13 inch 2015-03 13.3", IPS-Panel, 2560x1600 | |
|---|---|---|---|---|---|
| Display | 2% | -28% | -29% | 5% | |
| Display P3 Coverage (%) | 64 | 63.6 -1% | 44.53 -30% | 43.72 -32% | 65.9 3% |
| sRGB Coverage (%) | 88.8 | 93.6 5% | 66.8 -25% | 65.3 -26% | 97 9% |
| AdobeRGB 1998 Coverage (%) | 65 | 65.5 1% | 45.97 -29% | 45.24 -30% | 67.4 4% |
| Response Times | -11% | ||||
| Response Time Grey 50% / Grey 80% * (ms) | 37.6 ? | 40 ? -6% | |||
| Response Time Black / White * (ms) | 26 ? | 30 ? -15% | |||
| PWM Frequency (Hz) | 1316 ? | 4900 ? | |||
| Screen | 17% | 10% | 8% | 32% | |
| Brightness middle (cd/m²) | 291 | 285 -2% | 277.5 -5% | 300 3% | 361 24% |
| Brightness (cd/m²) | 276 | 281 2% | 276 0% | 298 8% | 342 24% |
| Brightness Distribution (%) | 82 | 90 10% | 88 7% | 83 1% | 81 -1% |
| Black Level * (cd/m²) | 0.63 | 0.18 71% | 0.191 70% | 0.33 48% | 0.361 43% |
| Contrast (:1) | 462 | 1583 243% | 1453 215% | 909 97% | 1000 116% |
| Colorchecker dE 2000 * | 2.76 | 4.89 -77% | 4.88 -77% | 3.68 -33% | 1.82 34% |
| Greyscale dE 2000 * | 2.61 | 5.16 -98% | 4.26 -63% | 2.47 5% | 1.8 31% |
| Gamma | 2.31 95% | 2.15 102% | 2.59 85% | 2.4 92% | 2.49 88% |
| CCT | 6731 97% | 7106 91% | 6562 99% | 6310 103% | 6417 101% |
| Color Space (Percent of AdobeRGB 1998) (%) | 57.5 | 59 3% | 41.6 -28% | 41.6 -28% | 61.9 8% |
| Color Space (Percent of sRGB) (%) | 88.7 | 93 5% | 65.79 -26% | 64.9 -27% | 96.9 9% |
| Colorchecker dE 2000 max. * | 3.26 | ||||
| Total Average (Program / Settings) | 3% /
10% | -9% /
1% | -11% /
-1% | 19% /
25% |
* ... smaller is better
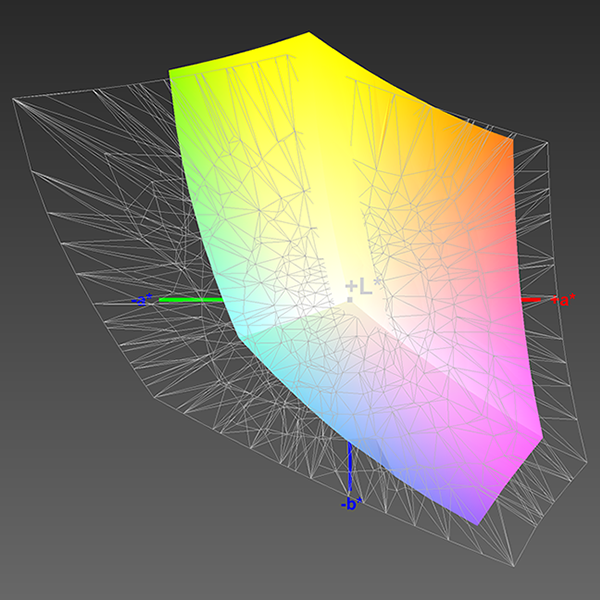
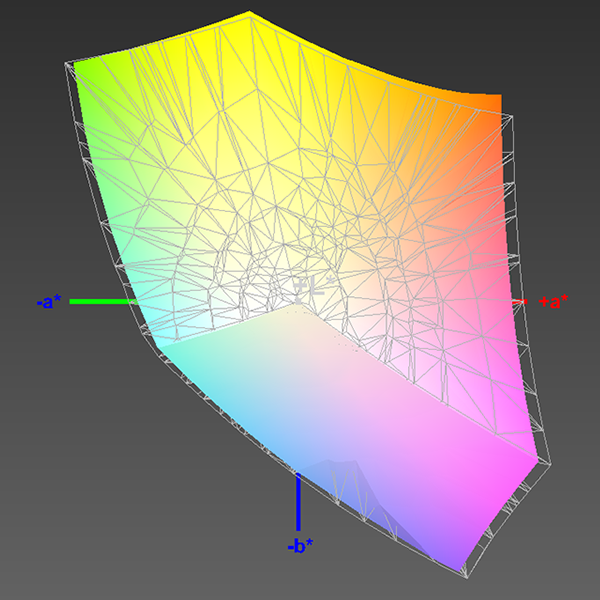
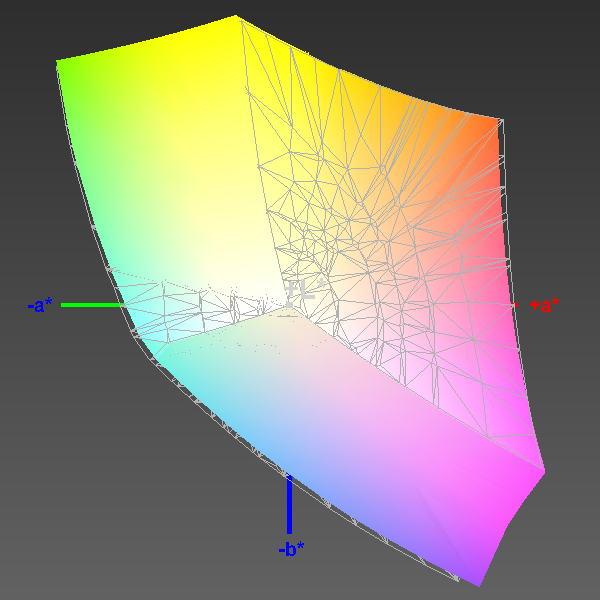
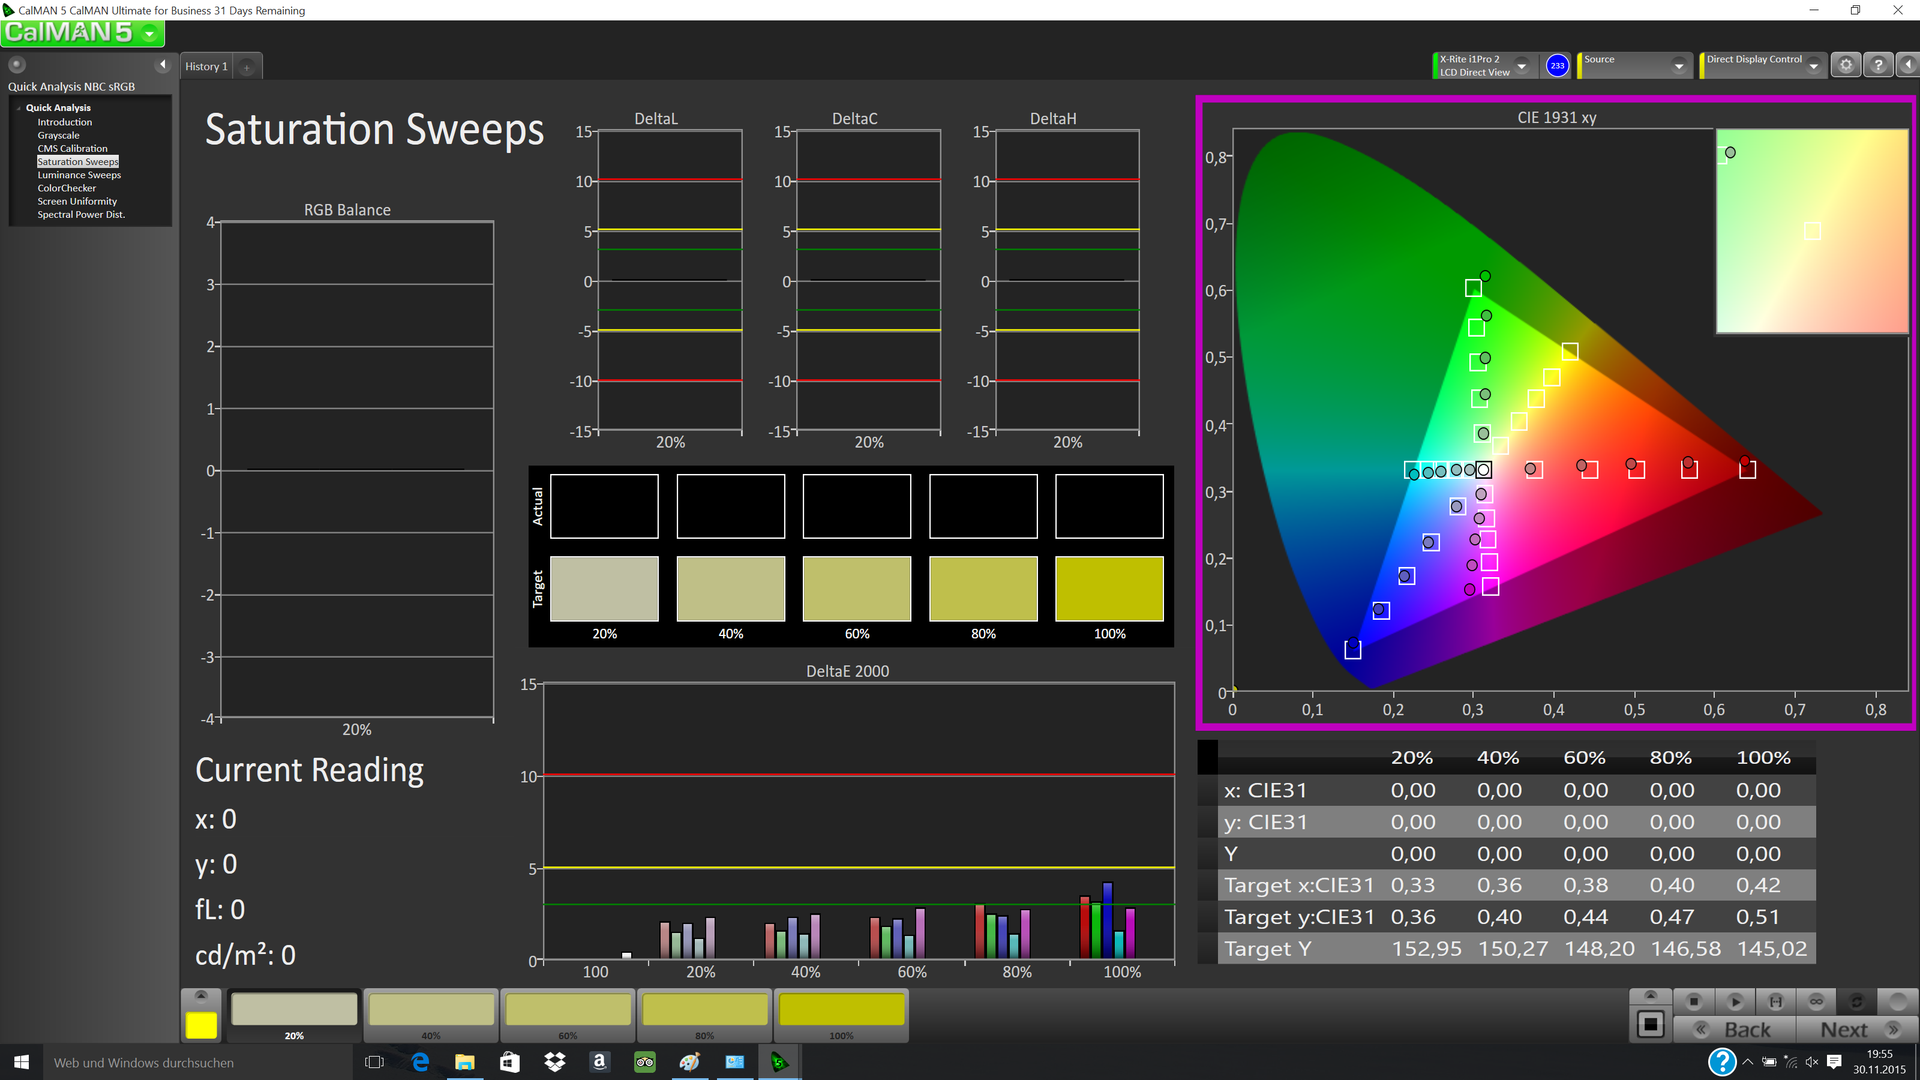
The sRGB color space coverage is good at 88.7%, so the Envy 13 QHD can also be used for (semi) professional picture and video editing: It might also be suited for the presentation of design drafts for customers on the road thanks to the compact dimensions. This is, however, not the case for pre-print stages or if you need the highest color accuracy – the AdobeRGB color space is only covered by 57.5%.
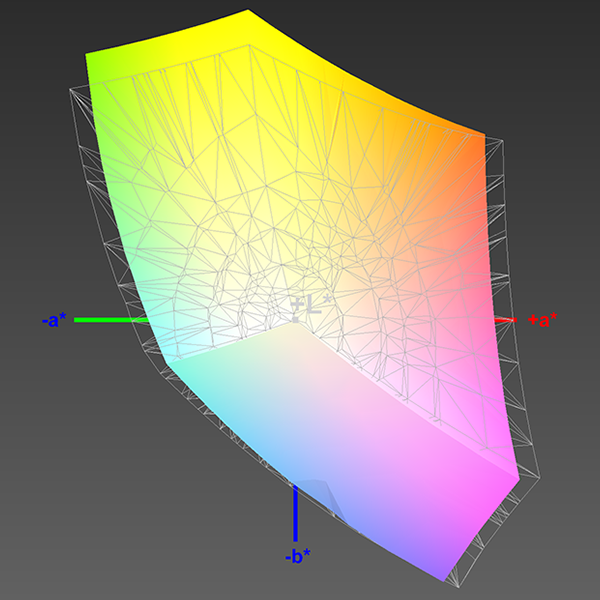
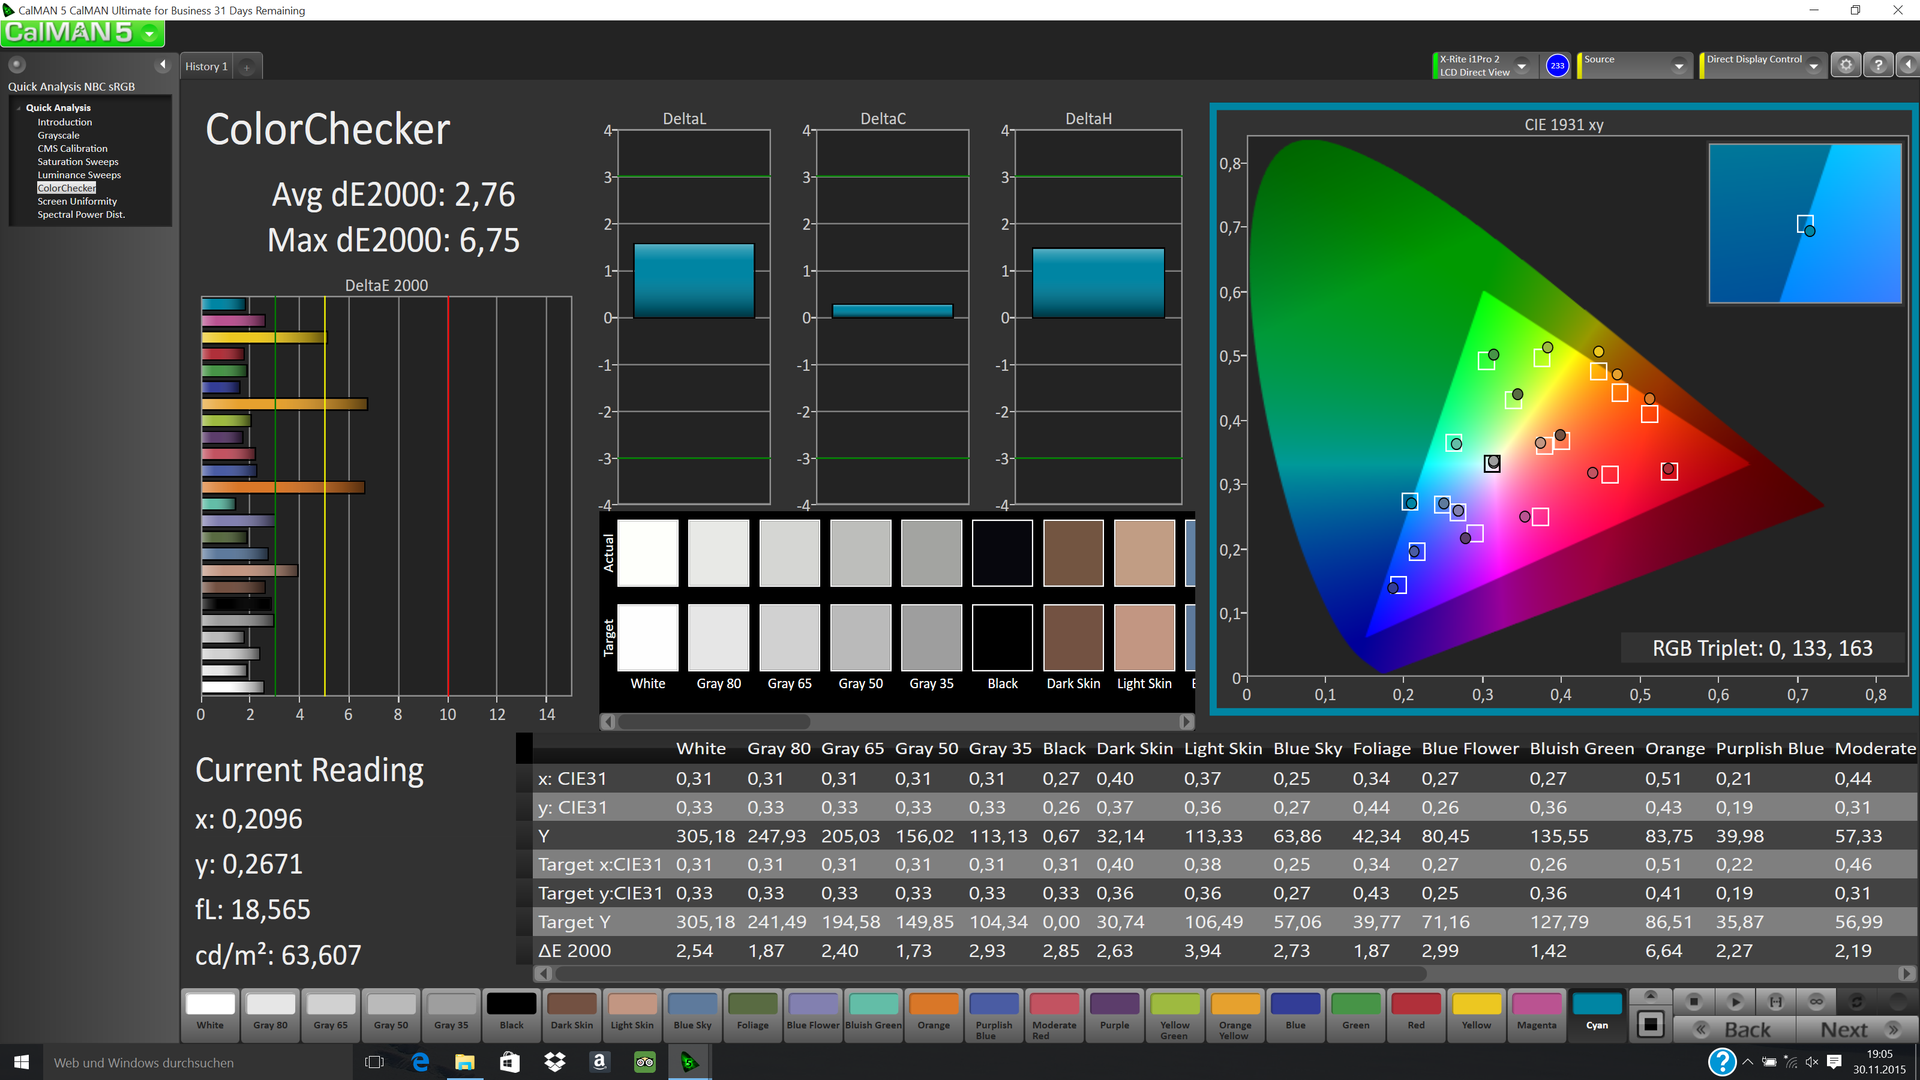
Both the black value and the contrast are worse compared to the direct rivals. That this is not a typical issue of QHD panels is proven by the Dell XPS 13 with such a display, because it is at the top of the comparison in this respect. Our review unit can, however, convince with very low color deviations ex-works – ColorChecker determines a DeltaE deviation of 2.76 (values under 3 are good). The value even drops to 2.38 after the manual calibration.
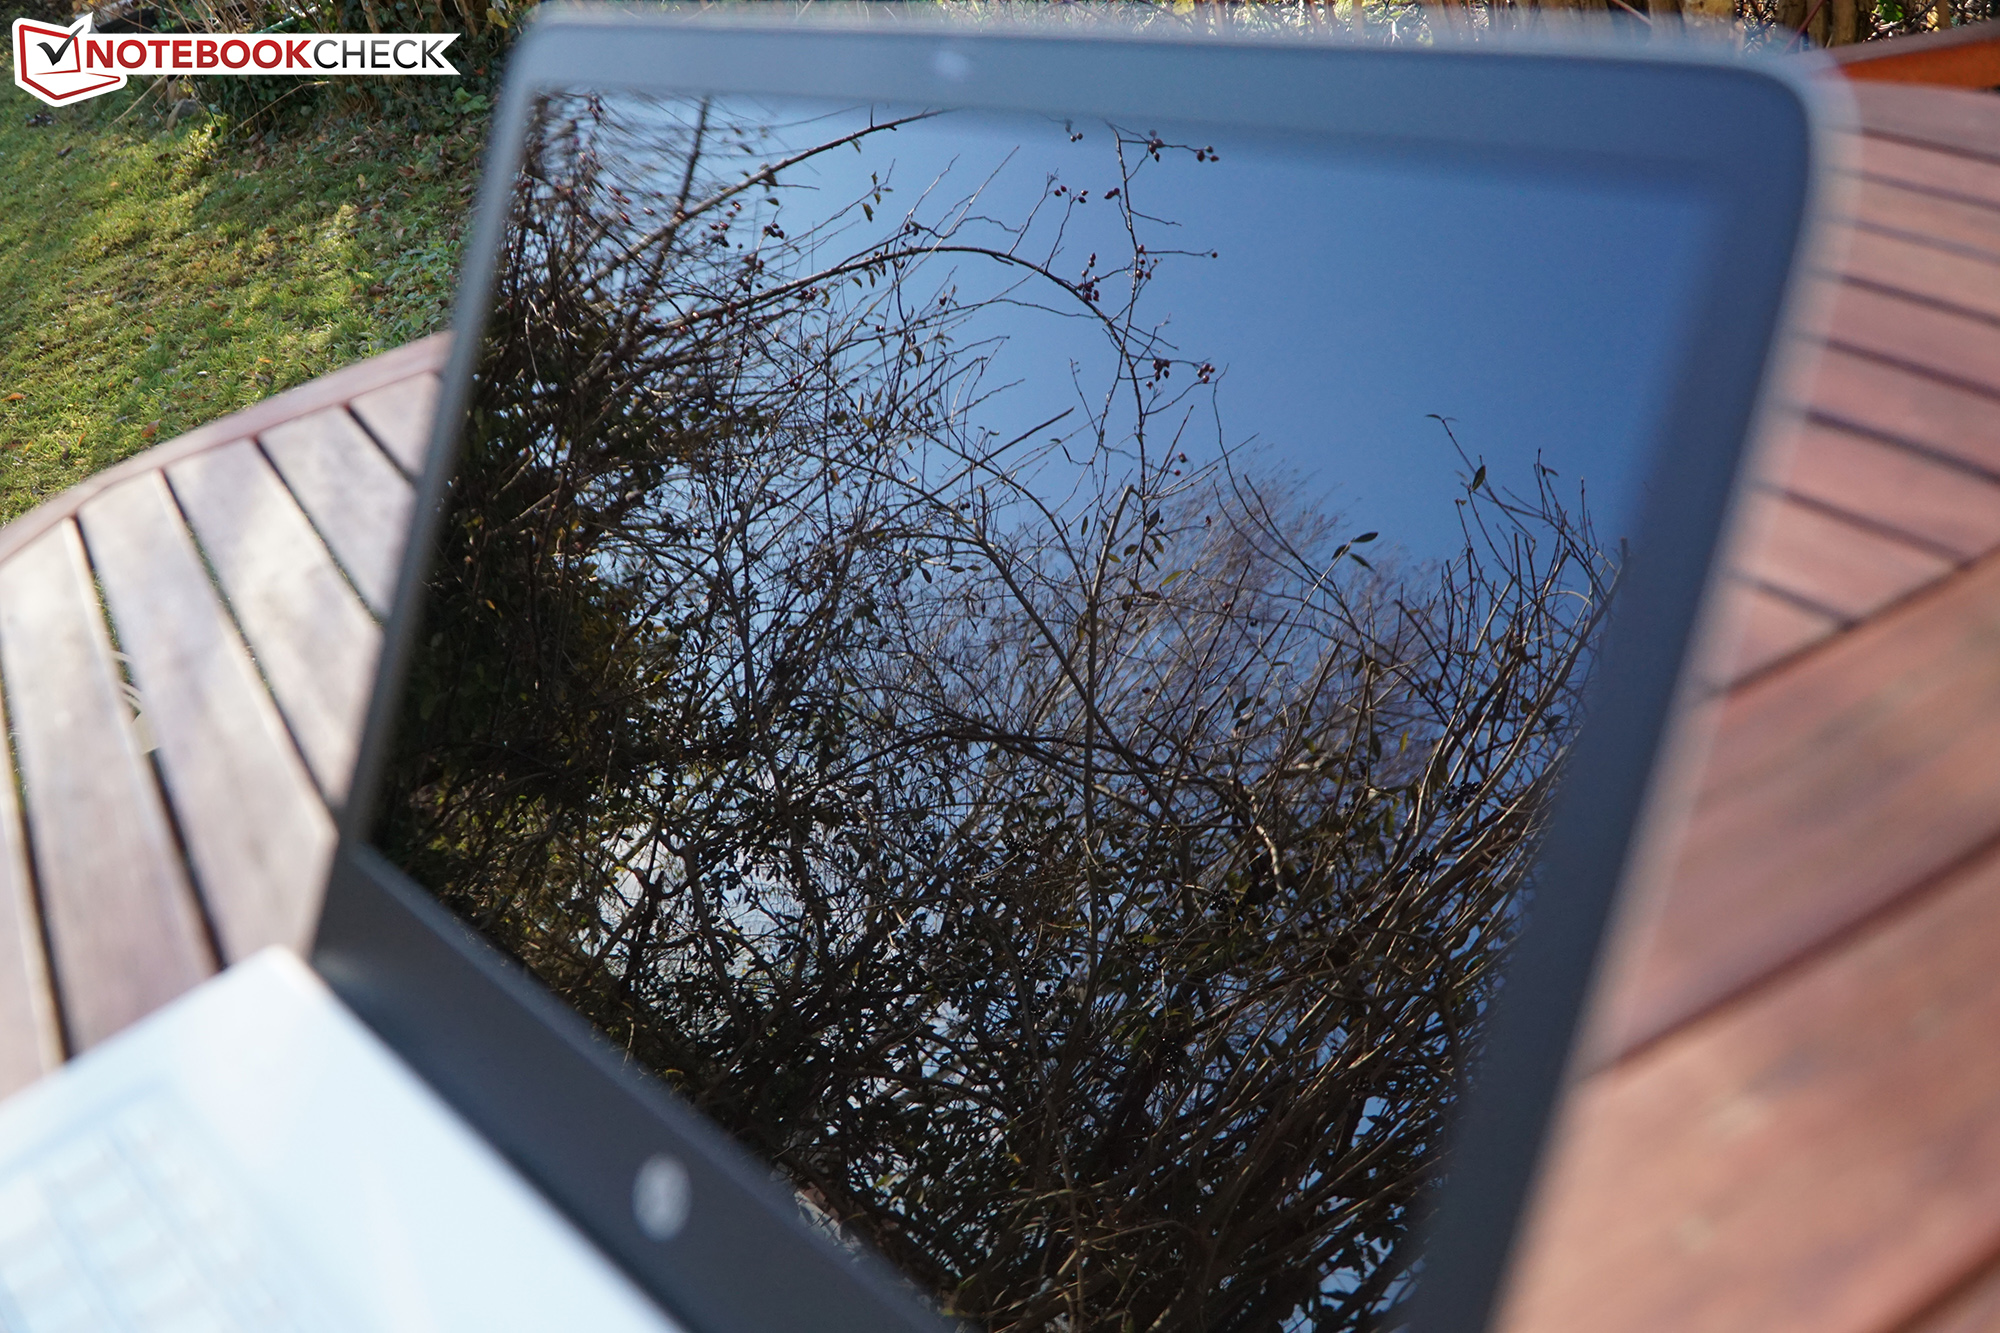
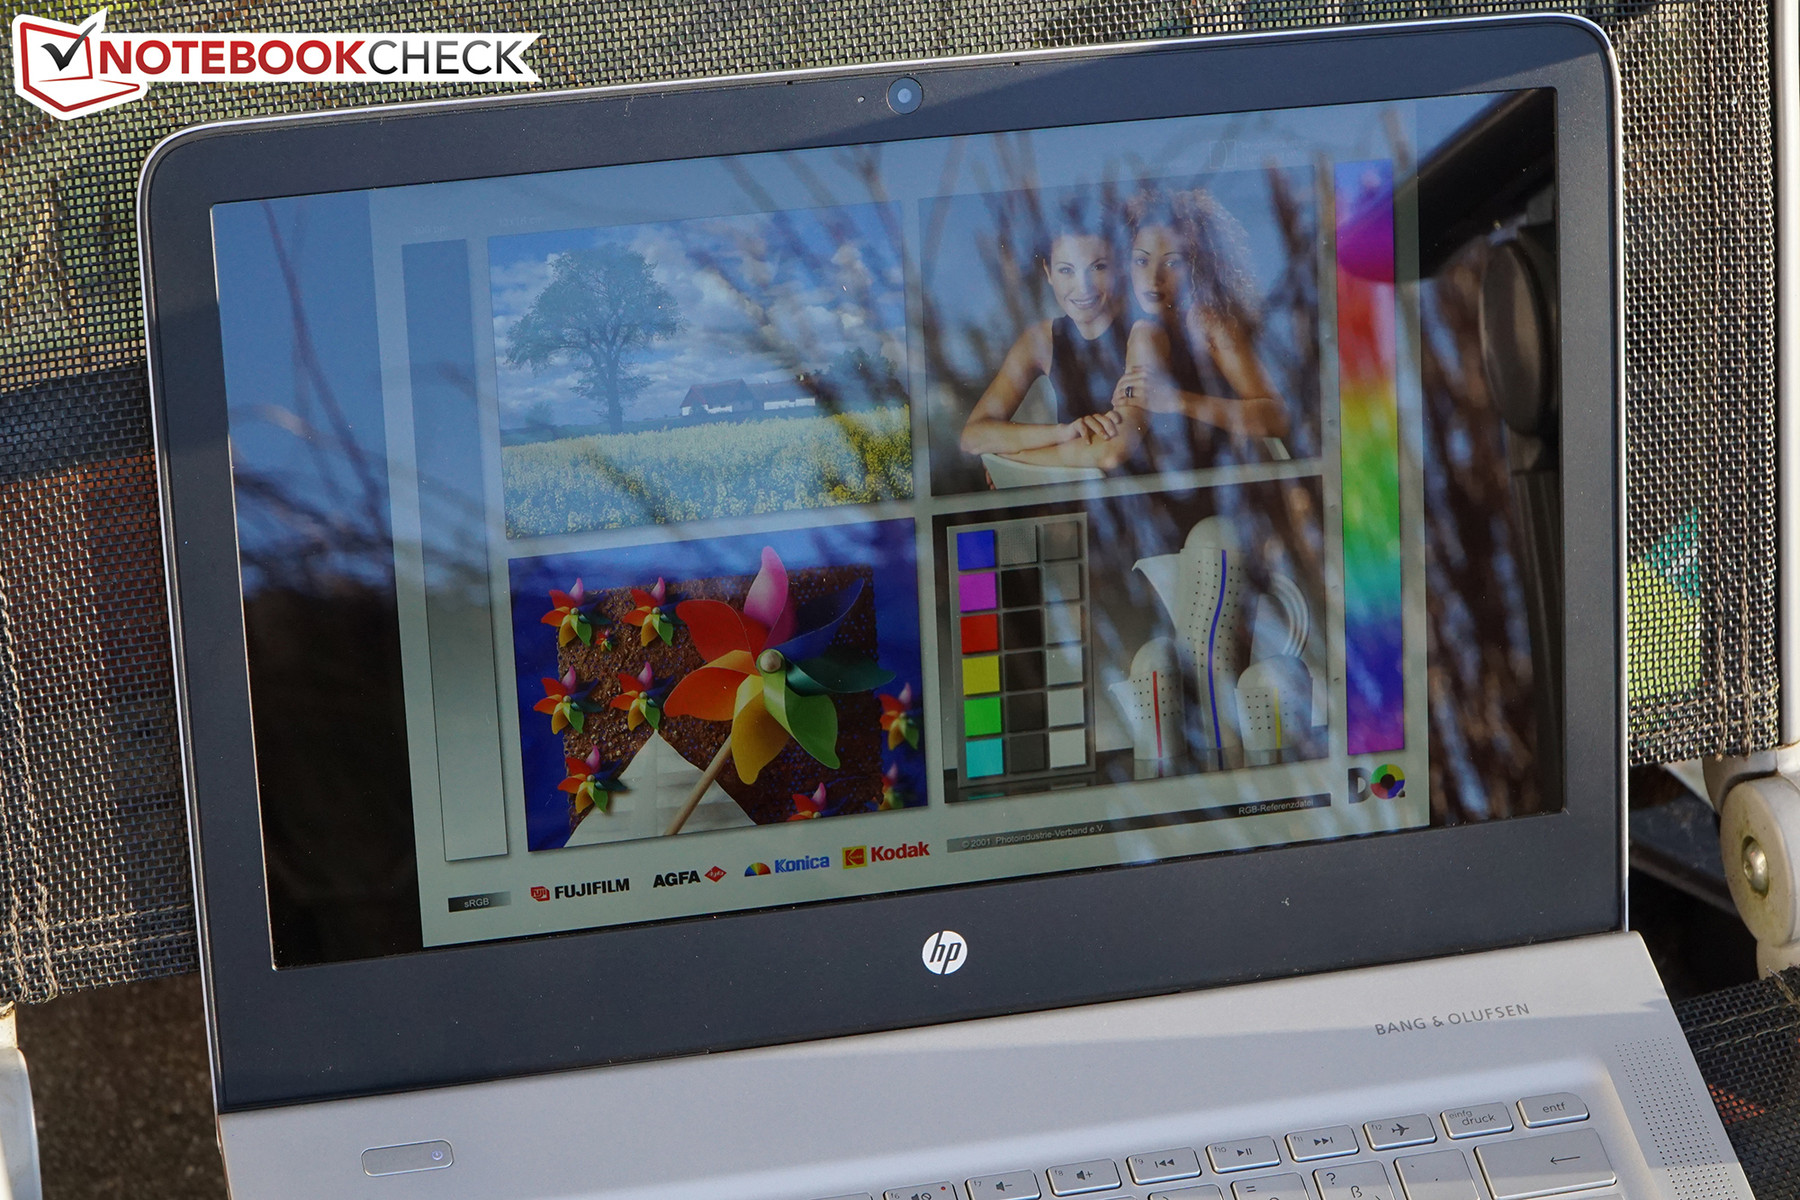
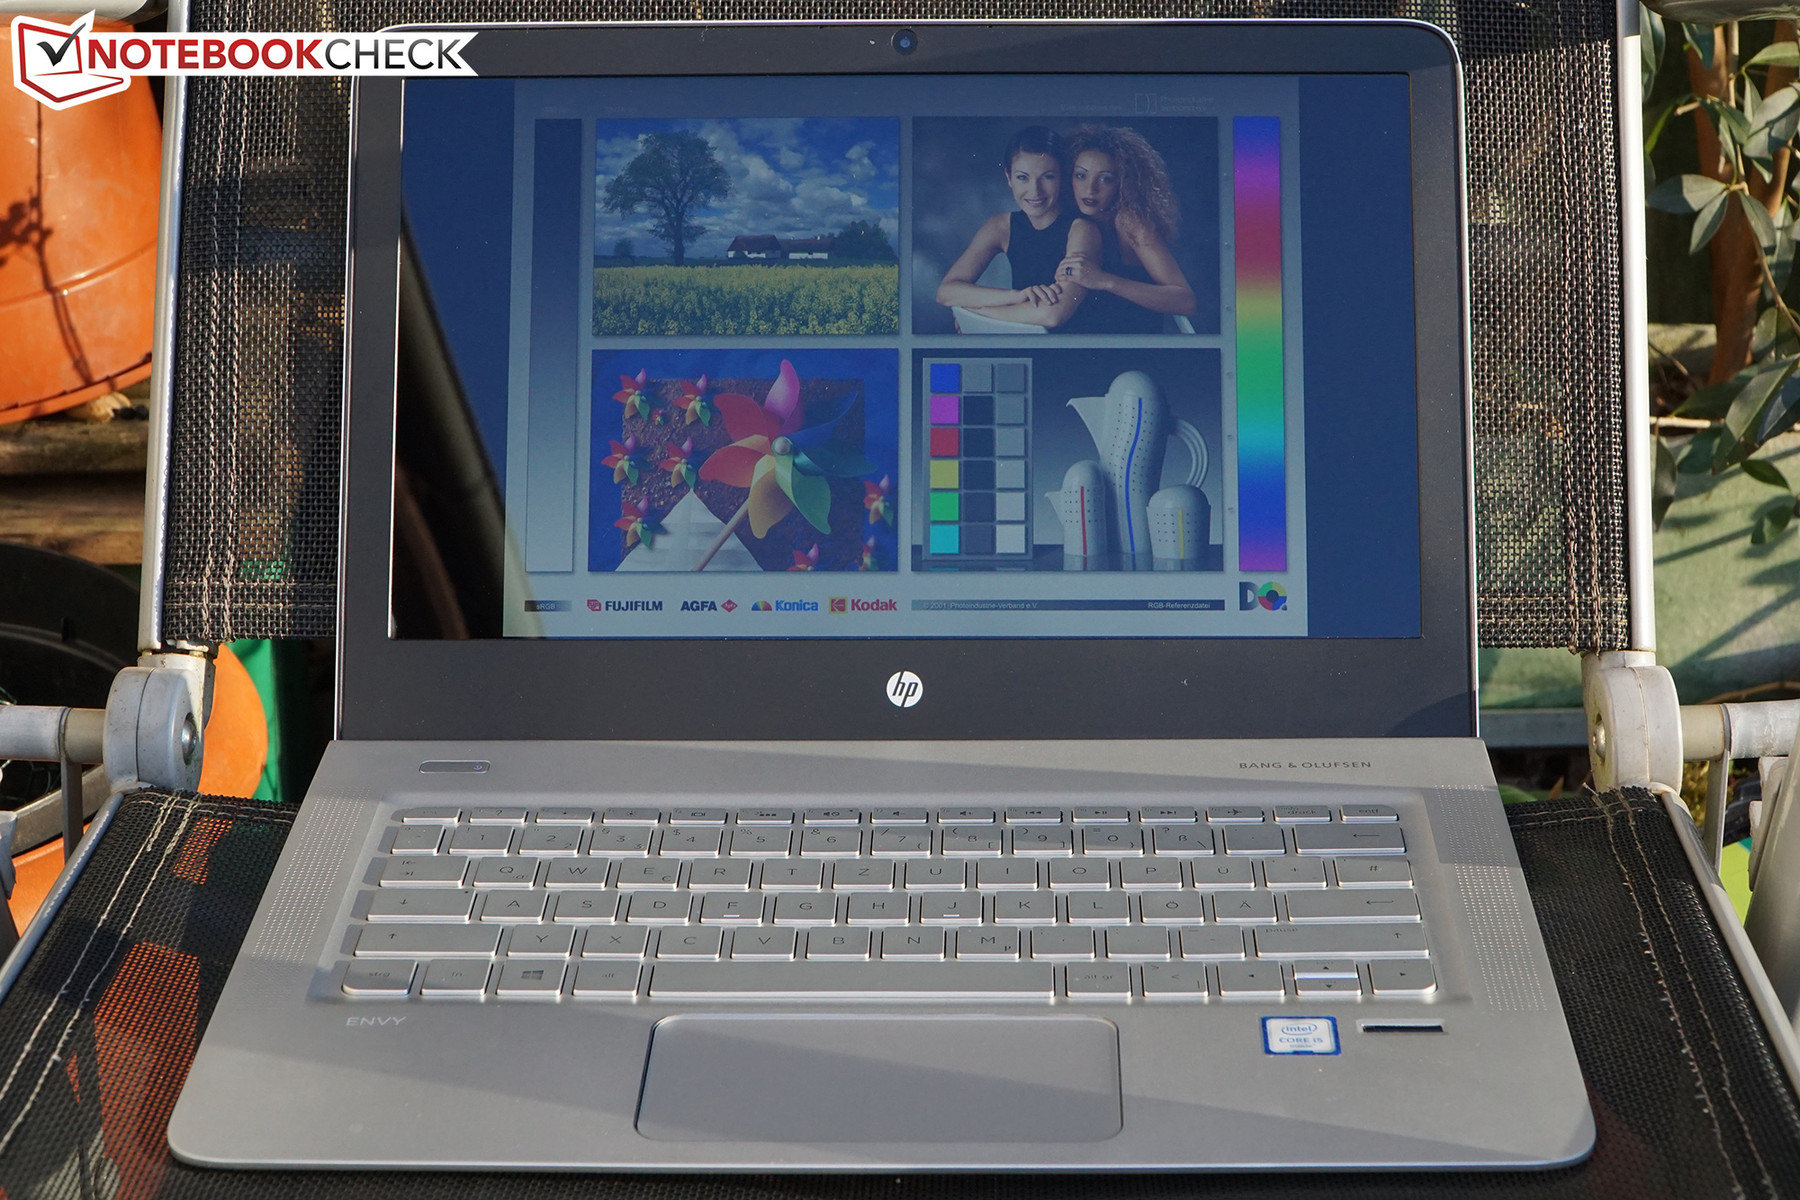
Due to heavy reflections, the display is not the best outdoors. Not even a place in the shade is sufficient to prevent reflections when the sun is shining – you will have to adjust the viewing angle accordingly. The maximum luminance is at least not reduced on battery power; it is sufficient for a clear sky.
Display Response Times
| ↔ Response Time Black to White | ||
|---|---|---|
| 26 ms ... rise ↗ and fall ↘ combined | ↗ 8.8 ms rise | 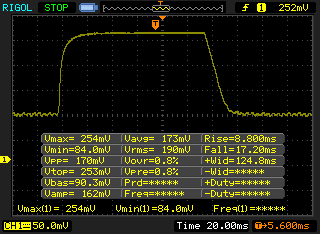 |
| ↘ 17.2 ms fall | ||
| The screen shows relatively slow response rates in our tests and may be too slow for gamers. In comparison, all tested devices range from 0.1 (minimum) to 240 (maximum) ms. » 62 % of all devices are better. This means that the measured response time is worse than the average of all tested devices (19.8 ms). | ||
| ↔ Response Time 50% Grey to 80% Grey | ||
| 37.6 ms ... rise ↗ and fall ↘ combined | ↗ 14.8 ms rise | 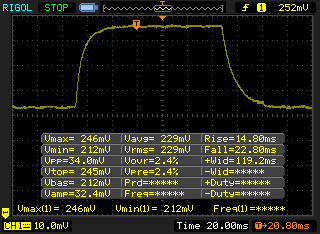 |
| ↘ 22.8 ms fall | ||
| The screen shows slow response rates in our tests and will be unsatisfactory for gamers. In comparison, all tested devices range from 0.165 (minimum) to 636 (maximum) ms. » 55 % of all devices are better. This means that the measured response time is worse than the average of all tested devices (31 ms). | ||
Screen Flickering / PWM (Pulse-Width Modulation)
| Screen flickering / PWM detected | 1316 Hz | ≤ 50 % brightness setting | 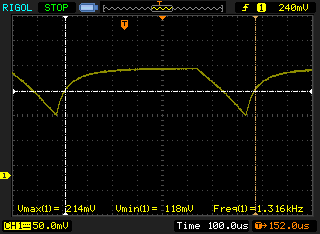 |
| ≤ 78 cd/m² brightness | |||
The display backlight flickers at 1316 Hz (worst case, e.g., utilizing PWM) Flickering detected at a brightness setting of 50 % (78 cd/m²) and below. There should be no flickering or PWM above this brightness setting. The frequency of 1316 Hz is quite high, so most users sensitive to PWM should not notice any flickering. As the flickering occurs only on very low brightness settings, it should not be an issue in typical office settings. Nonetheless, use in low light conditions may be straining to the eyes. In comparison: 52 % of all tested devices do not use PWM to dim the display. If PWM was detected, an average of 7775 (minimum: 5 - maximum: 343500) Hz was measured. | |||
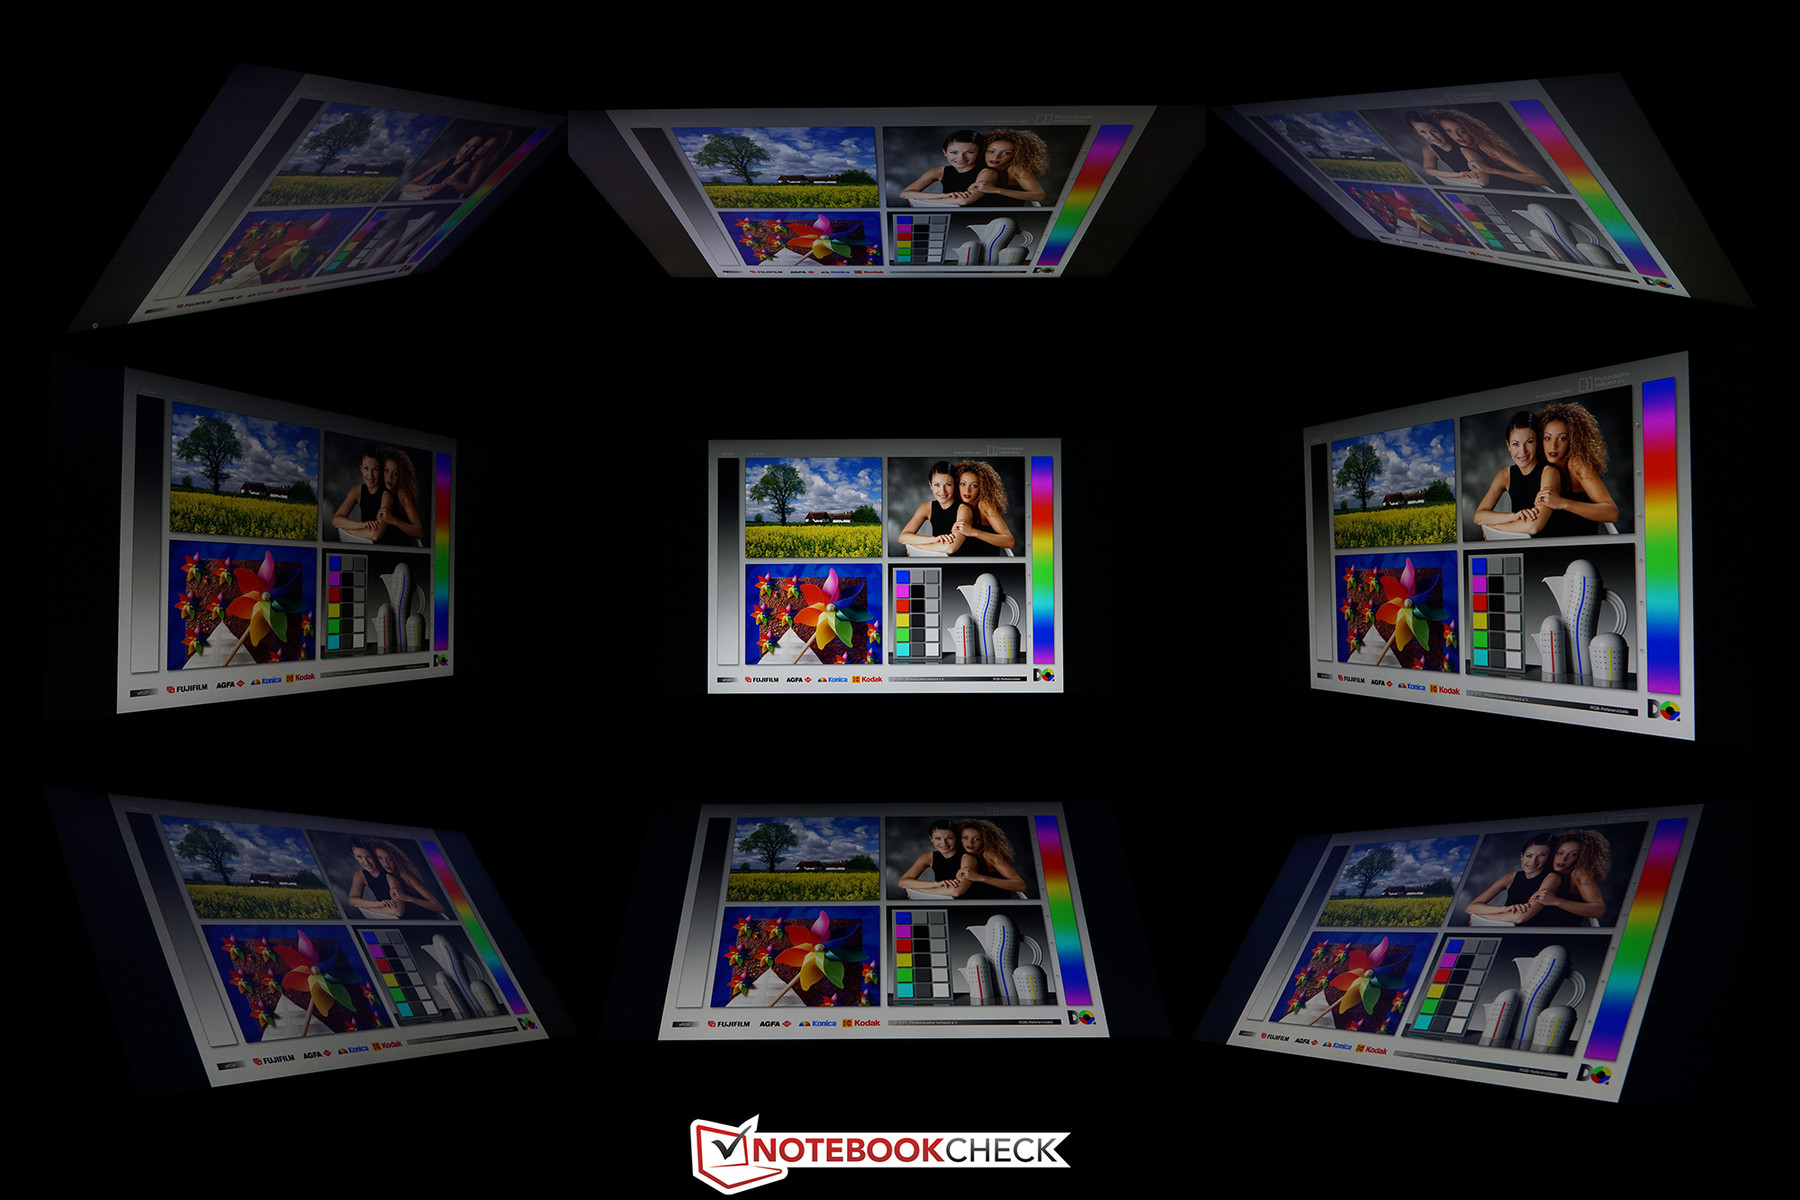
The IPS panel from Samsung with the designation SDC415A leaves a good impression in respect of the viewing angle stability. The visibility is always very good, even from wide angles. The color brilliance does suffer noticeably the further you shift from the center though. The panel from Sharp in the XPS 13 QHD does not show this behavior.
Performance
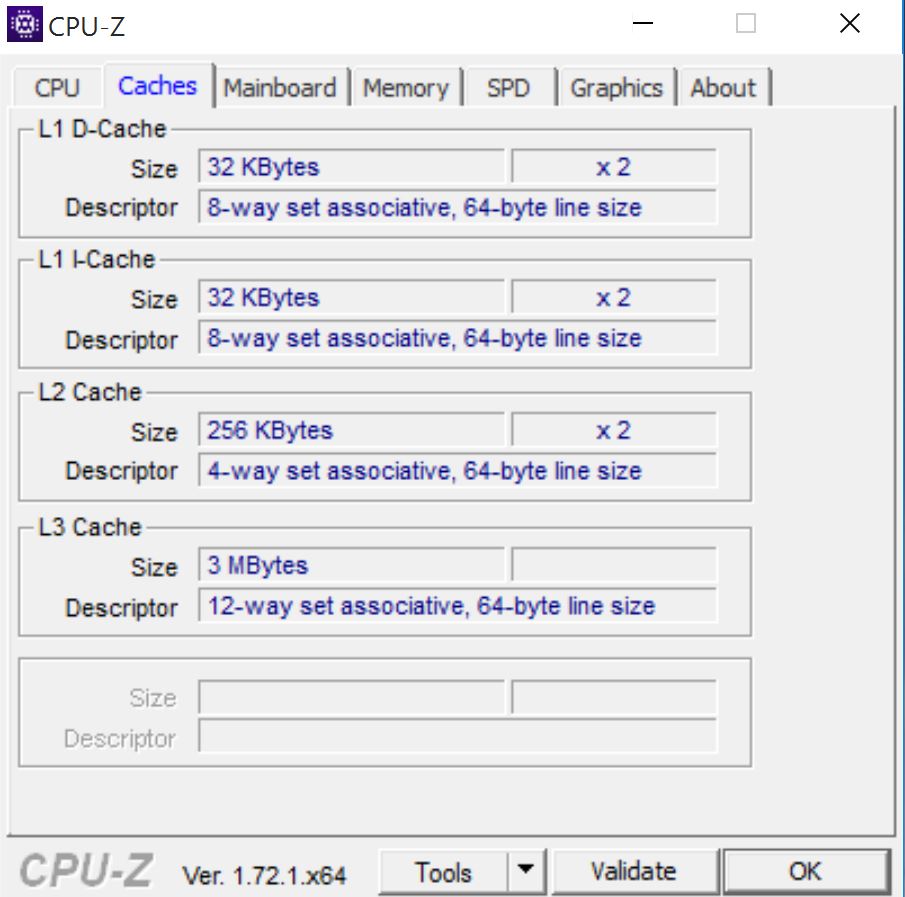
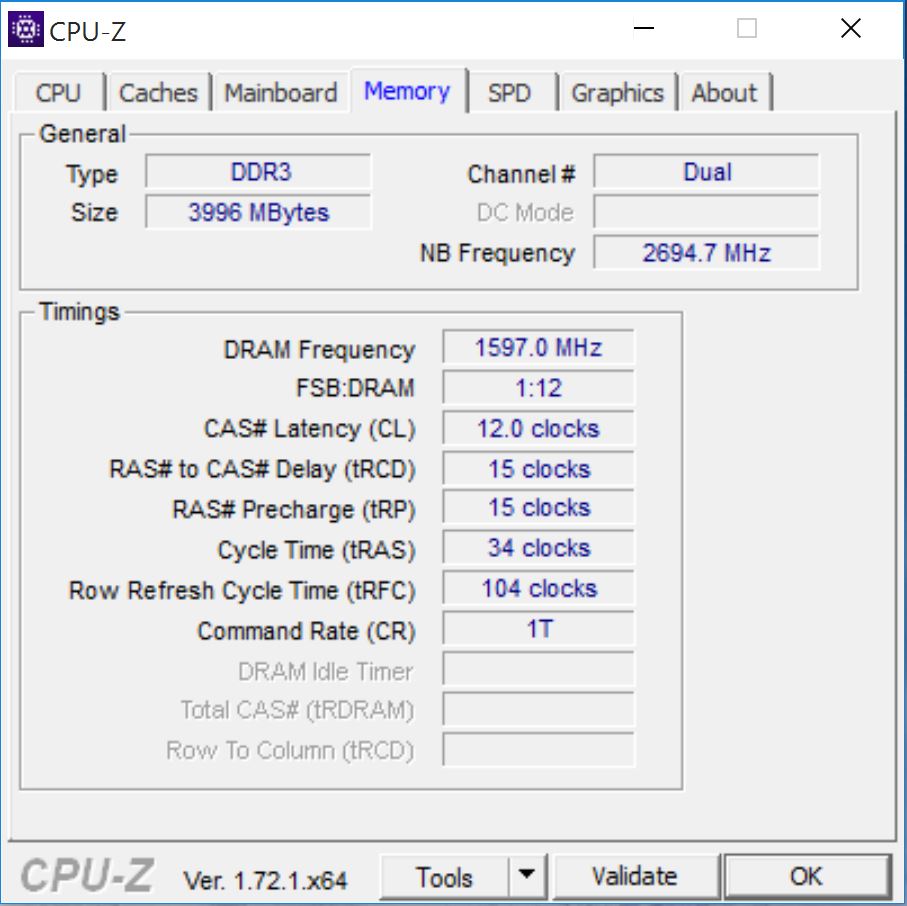
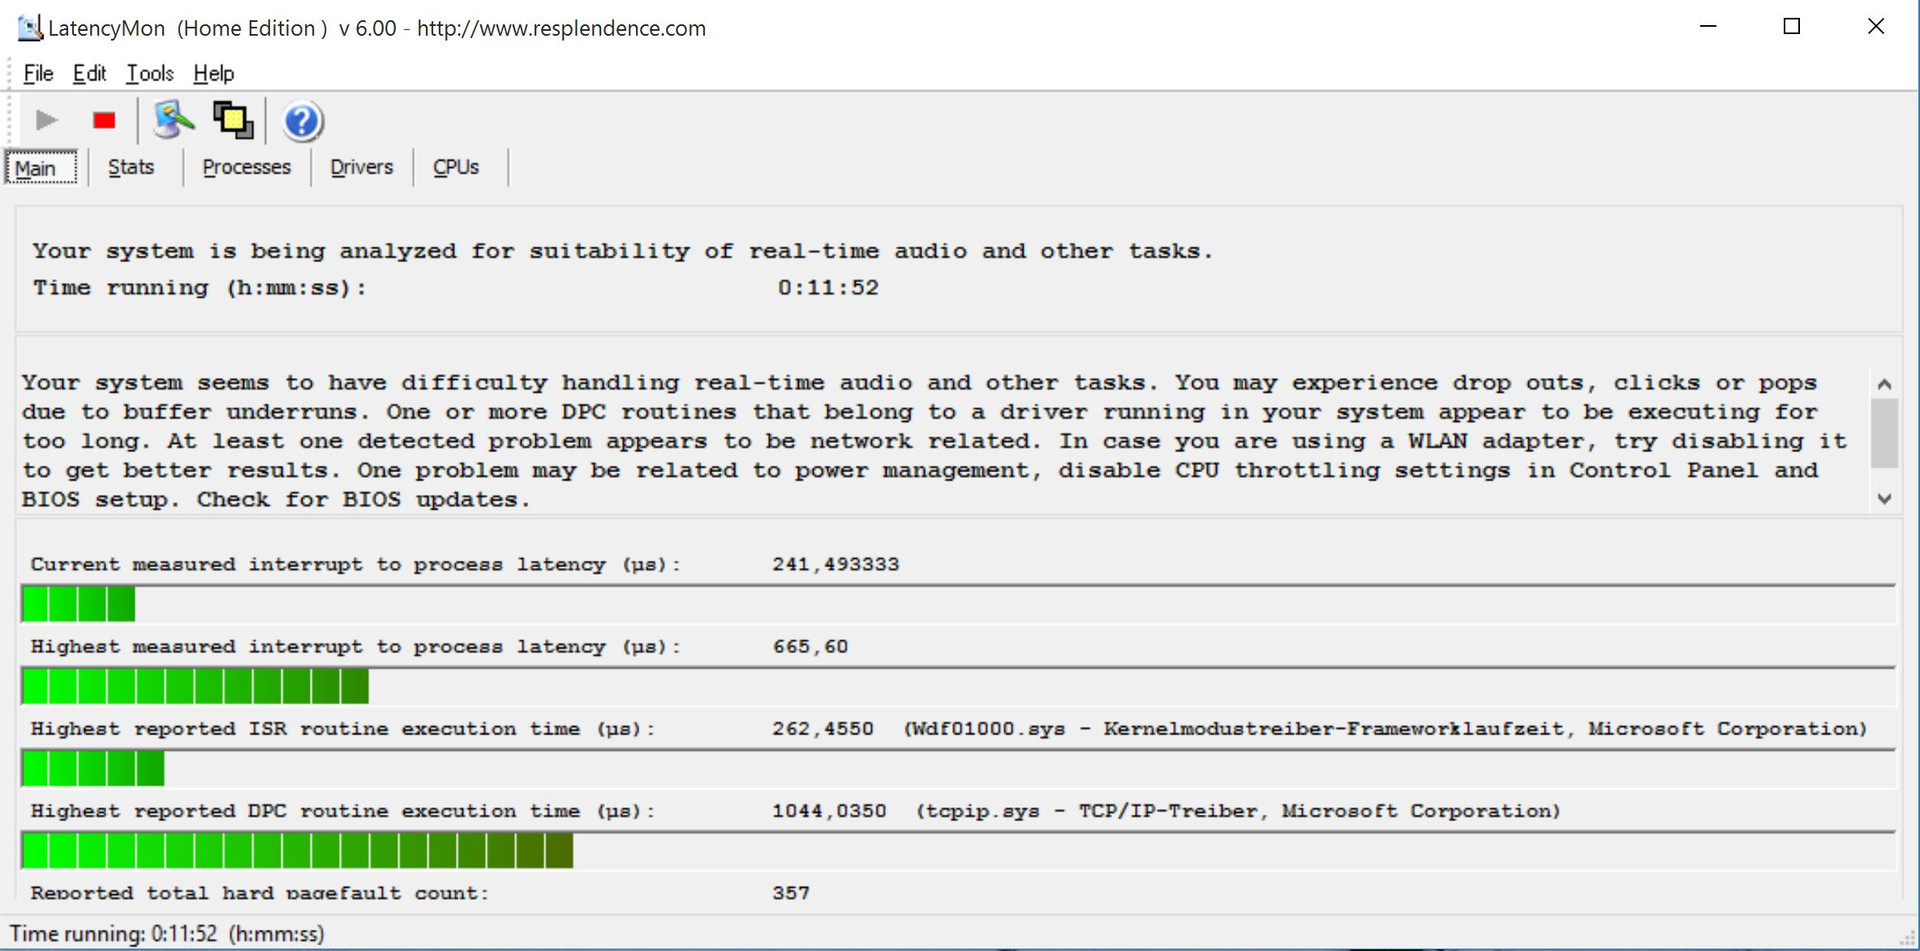
The combination of a modern Core i5-6200U and a 256 GB M.2 SSD promises a good all-rounder with smooth handling as well as video playback without delays. Gaming in high resolutions is, as expected, not possible with the integrated HD Graphics 520. The device is also not suited for professional audio editing due to measurable audio dropouts (see LatencyMon screenshot); but this scenario usually requires an external audio interface anyway. The amount of RAM is a bit low at just 4 GB. It runs in a dual-channel configuration, which can improve the system performance a bit.
There is also a more powerful version of the Envy 13 with the QHD panel, which is equipped with 8 GB RAM and the i7-6500U. This model has the designation Envy 13-d004ng and is not much more expensive, so it actually offers a better price-performance ratio. The previously mentioned FHD version uses the Core i5-6200U from the review configuration, but in combination with 8 GB RAM. Otherwise, there are no differences.
Processor
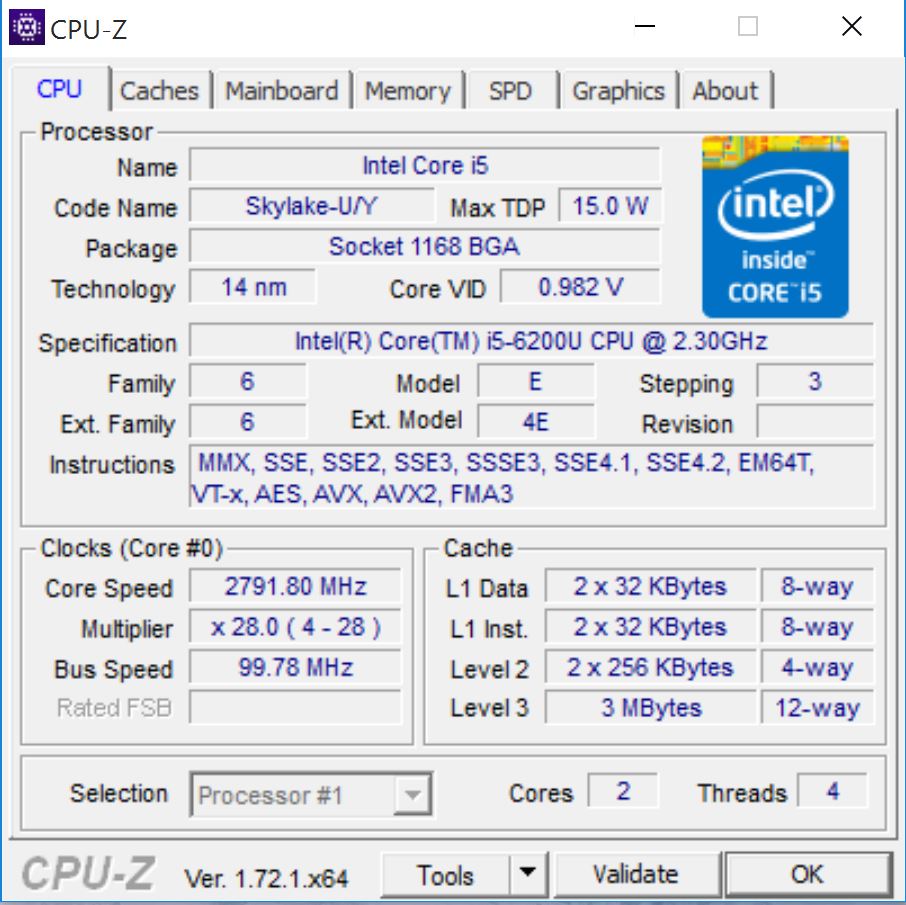
The Core i5-6200U is based on Intel's Skylake architecture and is manufactured in a 14 nm process. The dual-core has a nominal clock of 2.3 GHz that can be raised to 2.7 or 2.8 GHz (multi-core and single-core) if necessary. The TDP is specified at 15 watts.
A look at the Cinebench results shows that our review unit can keep up pretty well with the rivals: It is unsurprisingly on par with the Dell XPS 13 FHD, which is equipped with the identical CPU. The difference is only 20% even compared to nominally faster rivals, which is hardly perceptible in practice. We also want to mention that the full performance is also available on battery power.
System Performance
The solid performance impression is also supported by the PCMark results. The Envy is once again on par with the Dell XPS 13 FHD; it is interesting that the XPS 13 QHD with the i7 CPU cannot manage a lead and is sometimes even behind the two i5 versions. At the top is the MacBook Pro Retina. Its Core i5-5257U is still from the Broadwell generation, but has a higher clock (2.7 GHz base, Turbo up to 3.1 GHz). But what do simple numbers mean? Responsive handling is much more important in practice, and the review unit leaves a great impression in this respect.
| PCMark 7 Score | 4889 points | |
| PCMark 8 Home Score Accelerated v2 | 2883 points | |
| PCMark 8 Creative Score Accelerated v2 | 3541 points | |
| PCMark 8 Work Score Accelerated v2 | 3734 points | |
Help | ||
Storage Devices
The M.2 SSD from Samsung has a capacity of 256 GB and returned good transfer rates in benchmarks, but we still determined that the exact same model inside the HP EliteBook 820 G2 performs much better. The drive of the Envy 13 particularly struggles when it copies small files. The faster processor should not be the reason; the chipset is more likely – even though it seems a bit strange that the Broadwell-U PCH should be superior to the more modern Skylake counterpart inside the Envy. Upcoming updates of the chipset or the SSD firmware might be able to improve the situation. The Envy 13 cannot compete with the extreme performance of rivals that are equipped with NVMe drives. The SSD is one of the few components that can be replaced by the user.
| HP Envy 13-d000ng Samsung SSD PM851 256 GB MZNTE256HMHP | Dell XPS 13 2016 i7 256GB QHD Samsung PM951 NVMe MZ-VLV256D | Dell XPS 13-9350 Samsung PM951 NVMe MZ-VLV256D | HP Elitebook 820 G2-J8R58EA Samsung SSD PM851 256 GB MZ7TE256HMHP | Apple MacBook Pro Retina 13 inch 2015-03 Apple SSD SM0128G | |
|---|---|---|---|---|---|
| CrystalDiskMark 3.0 | 47% | 33% | 23% | 47% | |
| Read Seq (MB/s) | 467 | 764 64% | 1097 135% | 523 12% | 1403 200% |
| Write Seq (MB/s) | 265.9 | 311.4 17% | 307.7 16% | 268.3 1% | 657 147% |
| Read 4k (MB/s) | 24.1 | 42.16 75% | 38.52 60% | 29.14 21% | 20.95 -13% |
| Write 4k (MB/s) | 73.8 | 121 64% | 113 53% | 136.4 85% | 32.43 -56% |
| Read 4k QD32 (MB/s) | 355.5 | 485.7 37% | 244.7 -31% | 384.3 8% | 343.6 -3% |
| Write 4k QD32 (MB/s) | 240.4 | 293.6 22% | 151.5 -37% | 266.5 11% | 254.4 6% |
| AS SSD | 58% | 45% | 39% | 114% | |
| Seq Read (MB/s) | 473.8 | 735 55% | 1243 162% | 512 8% | 1233 160% |
| Seq Write (MB/s) | 256.4 | 301.2 17% | 152.6 -40% | 205.9 -20% | 616 140% |
| 4K Read (MB/s) | 18.95 | 38.21 102% | 34.61 83% | 27.42 45% | 20.6 9% |
| 4K Write (MB/s) | 62.5 | 97.6 56% | 0.98 -98% | 110 76% | 30.2 -52% |
| Copy ISO MB/s (MB/s) | 134.3 | 317.8 137% | 269.3 101% | 522 289% | |
| Copy Program MB/s (MB/s) | 121.1 | 149.1 23% | 147.8 22% | 285.5 136% | |
| Total Average (Program / Settings) | 53% /
51% | 39% /
39% | 31% /
31% | 81% /
80% |

GPU Performance
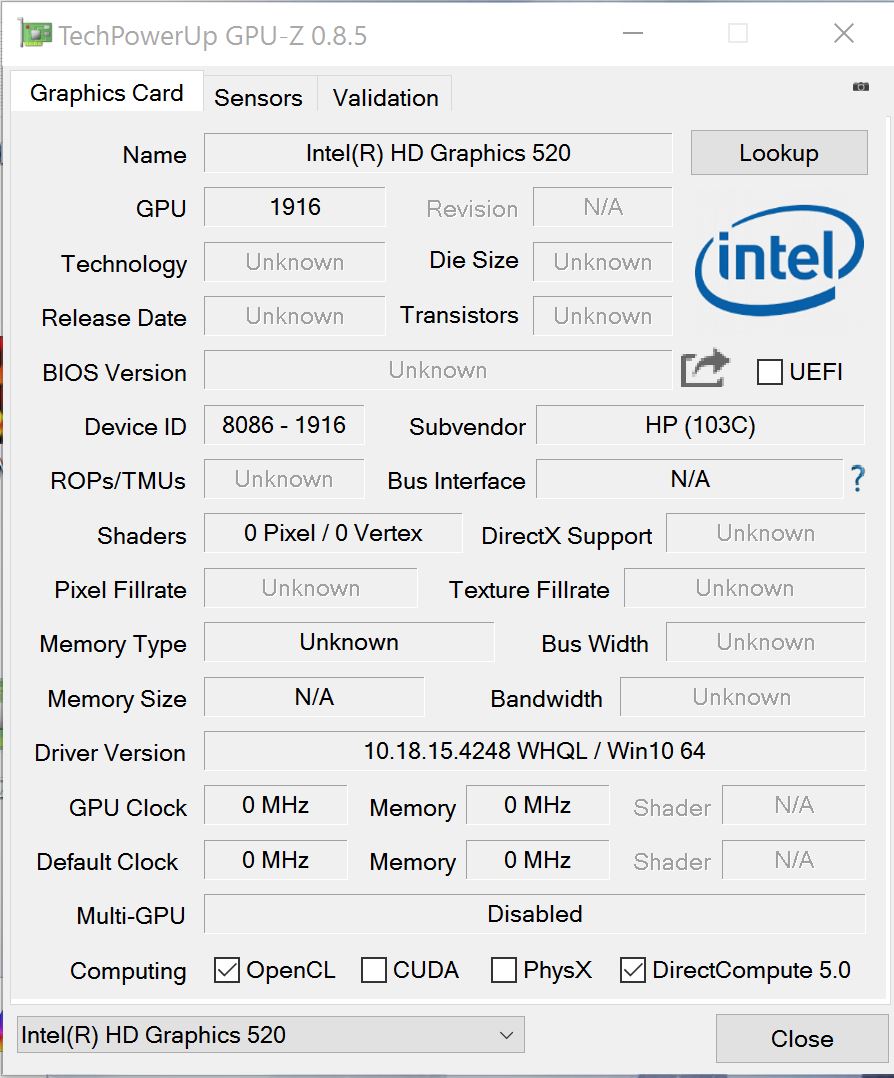
The integrated HD Graphics 520 is one of the faster chips of its kind and the performance can keep up with dedicated entry-level chips like the GeForce 820M. Interesting for our review unit: The GPU supports hardware decoding of 4K H.265 videos. The GPU performance also benefits from the dual-channel memory configuration since there is no dedicated VRAM.
Compared to the Broadwell GPU from the HP EliteBook 820 G2, for example, we can clearly see an improvement in the 3DMarks. The Envy falls slightly behind the two Dell XPS 13 laptops that we reviewed with the same integrated graphics. The MacBook has a clear advantage over the other comparison devices since it uses the "premium-iGPU" Iris Graphics.
| 3DMark 11 Performance | 1447 points | |
| 3DMark Ice Storm Standard Score | 54790 points | |
| 3DMark Cloud Gate Standard Score | 5710 points | |
| 3DMark Fire Strike Score | 793 points | |
Help | ||
Gaming Performance
Even newer games can be played on the Envy 13 as long as you can live with low settings and the minimum resolution for notebooks (1366x768 pixels). The graphics are still pretty good on the 13.3-inch screen in this case; the subjectively very rich and vivid colors of the QHD screen clearly improve the gaming experience on the Envy despite the low resolution.
| low | med. | high | ultra | |
|---|---|---|---|---|
| Tomb Raider (2013) | 78.1 | 39.9 | 24.1 | 10.4 |
| Sims 4 (2014) | 162 | 54.2 | 26.5 | 7.7 |
| Metal Gear Solid V (2015) | 45.4 | 27.2 | 16.2 | 9.3 |
Emissions
System Noise
The fan of the Envy 13 is never silent by default, even while idling. It is still very quiet and you will have to hold your ear against the fan exhaust at the back or work in a very quiet environment. Similar to the majority of subnotebooks, our review unit is pretty restrained in this scenario. The noise level is also constant at 31.5 dB(A), so there is no annoying pulsating of the fan. You can clearly hear the Envy 13 under load, which is partly caused by the varying fan speed. It is still not annoying, but you can notice it. For comparison: The two XPS 13 models are not only generally quieter under load, but the fan speed is also constant.
It is possible to adjust the fan behavior of the Envy manually, which was pointed out by one of our readers. You can deactivate the default always-on of the fan in the BIOS; after that it should really be deactivated most of the time while idling and only spin if necessary. This means the user can decide whether he prefers a constant murmur or silence with the occasional activation of the fan.
| HP Envy 13-d000ng | Dell XPS 13 2016 i7 256GB QHD | Dell XPS 13-9350 | HP Elitebook 820 G2-J8R58EA | Apple MacBook Pro Retina 13 inch 2015-03 | |
|---|---|---|---|---|---|
| Noise | 0% | 13% | 7% | -3% | |
| Idle Minimum * (dB) | 31.5 | 31.8 -1% | 28.2 10% | 29.2 7% | 29 8% |
| Idle Average * (dB) | 31.5 | 31.8 -1% | 28.3 10% | 29.2 7% | 29 8% |
| Idle Maximum * (dB) | 31.5 | 34.8 -10% | 28.4 10% | 29.2 7% | 29 8% |
| Load Average * (dB) | 35.6 | 34.8 2% | 30.2 15% | 34.7 3% | 42.5 -19% |
| Load Maximum * (dB) | 38.8 | 34.8 10% | 30.2 22% | 35.1 10% | 45.6 -18% |
* ... smaller is better
Noise level
| Idle |
| 31.5 / 31.5 / 31.5 dB(A) |
| Load |
| 35.6 / 38.8 dB(A) |
 | ||
30 dB silent 40 dB(A) audible 50 dB(A) loud |
||
min: | ||
Temperature
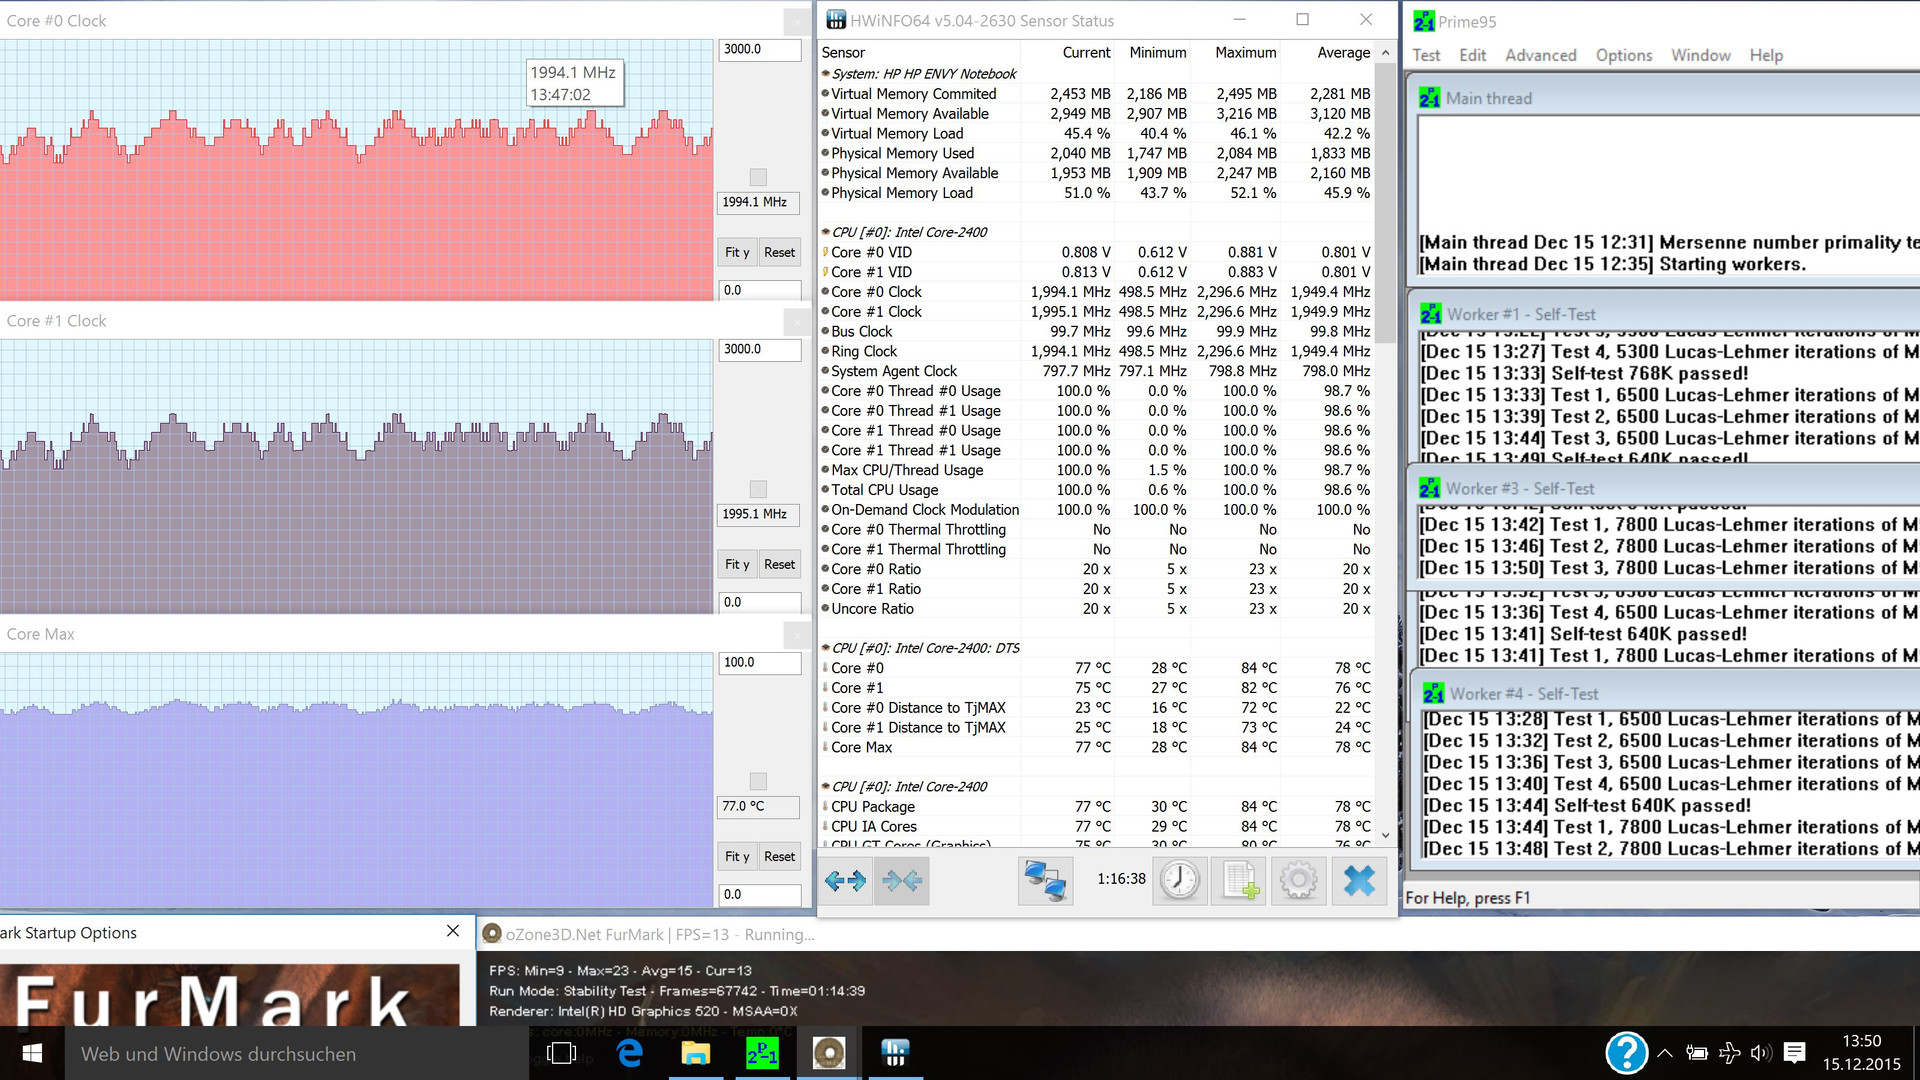
The temperature development of our review unit was generally not an issue. It gets slightly warmer than the rivals (except for the Dell XPS QHD, which creates much more heat under load because of the faster i7-6500U) and we can even measure around 50 °C (122 °F) at the fan exhaust under maximum load. However, the higher temperatures are concentrated at the center of the rear, where they are no big problem. Our stress test also shows that the Envy handles the thermal load very well even after one hour, despite the slightly higher temperatures. The base clock of the processor is reduced from 2.3 to 2.0 GHz after around 10 minutes, but is steady at this level over the course of the test. The CPU only took a couple of resting periods where it dropped to 1.7 GHz for around one minute. This compensated temperature peaks and resulted in an average value of 80 °C (176 °F), which should not be a problem for the lifespan of the chip. For comparison: The XPS 13 FHD with the same CPU had to throttle to 1.4 GHz to stay below the 80 °C mark.
| HP Envy 13-d000ng 6200U, HD Graphics 520 | Dell XPS 13 2016 i7 256GB QHD 6500U, HD Graphics 520 | Dell XPS 13-9350 6200U, HD Graphics 520 | HP Elitebook 820 G2-J8R58EA 5500U, HD Graphics 5500 | Apple MacBook Pro Retina 13 inch 2015-03 5257U, Iris Graphics 6100 | |
|---|---|---|---|---|---|
| Heat | -8% | 9% | 8% | 15% | |
| Maximum Upper Side * (°C) | 49.8 | 57 -14% | 45.2 9% | 43.2 13% | 45.1 9% |
| Maximum Bottom * (°C) | 50.9 | 56 -10% | 45.2 11% | 45.1 11% | 39.6 22% |
| Idle Upper Side * (°C) | 33.3 | 34.1 -2% | 30.4 9% | 31.2 6% | 28.5 14% |
| Idle Bottom * (°C) | 32.7 | 34.3 -5% | 31.2 5% | 32.5 1% | 28.3 13% |
* ... smaller is better
(-) The maximum temperature on the upper side is 49.8 °C / 122 F, compared to the average of 35.9 °C / 97 F, ranging from 21.4 to 59 °C for the class Subnotebook.
(-) The bottom heats up to a maximum of 50.9 °C / 124 F, compared to the average of 39.2 °C / 103 F
(+) In idle usage, the average temperature for the upper side is 29.5 °C / 85 F, compared to the device average of 30.8 °C / 87 F.
(+) The palmrests and touchpad are cooler than skin temperature with a maximum of 29.9 °C / 85.8 F and are therefore cool to the touch.
(±) The average temperature of the palmrest area of similar devices was 28.2 °C / 82.8 F (-1.7 °C / -3 F).
Speakers
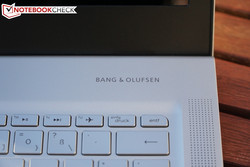
The sound system is provided by Bang & Olufsen, one of the most prestigious manufacturers of audio components for the volume market. Compared to the Envy 17, where the 4.1 speaker combination could really impress the author, our review unit only gets two speakers. But the result of this minimum spec is very convenient in all genres. The transparent sound characteristics already surprise in the default settings and you can clearly differentiate individual instruments. As expected, the small modules have a problem with the bass, but the software offers a very comprehensive equalizer for manual adjustments. Furthermore, you get different presets for music, voice and movies, which are subjectively well adjusted.
Energy Management
Power Consumption
As it should be for an Ultrabook, the Envy 13 QHD is a very frugal device and there are no anomalies compared to the rivals. The EliteBook consumes significantly less power while idling, which is most likely a result of the lower resolution 12.5-inch HD screen. We can see up to 40 watts under load (especially at the start of the stress test), but the 45-watt power adaptor is sufficient. The average consumption was 32.1 watts at the end of the stress test.
| HP Envy 13-d000ng 6200U | Dell XPS 13 2016 i7 256GB QHD 6500U | Dell XPS 13 9343 Core i7 5500U | HP Elitebook 820 G2-J8R58EA 5500U | Apple MacBook Pro Retina 13 inch 2015-03 5257U | |
|---|---|---|---|---|---|
| Power Consumption | 0% | 1% | 23% | -4% | |
| Idle Minimum * (Watt) | 5.4 | 6.8 -26% | 6.6 -22% | 3.1 43% | 2.8 48% |
| Idle Average * (Watt) | 10.1 | 10 1% | 9.3 8% | 5.8 43% | 7.8 23% |
| Idle Maximum * (Watt) | 11.1 | 10.5 5% | 11 1% | 6.5 41% | 8.1 27% |
| Load Average * (Watt) | 32.1 | 30.2 6% | 32.2 -0% | 30.5 5% | 52.4 -63% |
| Load Maximum * (Watt) | 40.1 | 33.6 16% | 33.2 17% | 46.3 -15% | 62.8 -57% |
* ... smaller is better
| Off / Standby | |
| Idle | |
| Load |
|
Key:
min: | |
Battery Runtime
The stamina of the Envy 13 QHD is a bit disappointing. The results are actually not that bad, but sometimes clearly behind the direct rivals. One reason is the rather small 45-Wh battery, but it is surprising that the EliteBook lasts more than 4 hours longer while idling despite the similar battery capacity and the less efficient CPU. The QHD display of the Envy probably consumes quite a lot of power. The CPU is the biggest consumer in this case – advantage for systems with a Skylake processor.
More important in practice should be the result of our Wi-Fi test, where we use a script to load random websites in a fixed interval at an adjusted display brightness of 150 cd/m². The Envy falls behind in this browsing scenario and has to be recharged after around 5.5 hours – probably a real issue in practice. The MacBook Pro 13 Retina manages the best result with almost 9 hours, which is sufficient for a full business day on battery power.
| HP Envy 13-d000ng 45 Wh | Dell XPS 13 2016 i7 256GB QHD 56 Wh | Dell XPS 13-9350 56 Wh | HP Elitebook 820 G2-J8R58EA 46 Wh | Apple MacBook Pro Retina 13 inch 2015-03 75 Wh | |
|---|---|---|---|---|---|
| Battery runtime | 26% | 43% | 15% | 89% | |
| Reader / Idle (h) | 8.6 | 13.1 52% | 13 51% | 15.4 79% | 28.2 228% |
| H.264 (h) | 5.7 | 4.9 -14% | 9.7 70% | ||
| WiFi v1.3 (h) | 5.4 | 7.2 33% | 7.5 39% | 5.6 4% | 9 67% |
| Load (h) | 1.8 | 1.7 -6% | 2.5 39% | 1.6 -11% | 1.6 -11% |
Pros
Cons
Verdict
The HP Envy 13-d000ng is an average device when you just look at the test results. Its QHD panel stands out from the masses, but does not set any records (even though the high sRGB coverage and the low color deviations are good). The performance benchmarks are within the expectations, only the integrated SSD seems to be slightly behind its possibilities. However, the impression is a bit different in practice.
The handling of the device is just very convenient and the system is very responsive – neither the SSD nor the small amount of memory (4 GB) turn out to be bottlenecks. The display not only has an extremely high resolution, but subjectively also provides great pictures, so you can easily overlook drawbacks like the flexing keyboard. The Envy can also score in productive environments thanks to the fingerprint scanner and TPM. And the sound system is just great.
The other big advantage – which is really surprising – is the comparatively low price for the Envy 13 QHD of just 1,000 Euros (~$1092). If you really want a Windows subnotebook with a QHD screen, the only rival is pretty much the Dell XPS 13 QHD – and it costs 500 Euros (~$546) more. The very good MacBook Pro 13 Retina sells for 1,100 Euros (~$1202), but it only makes sense if you also use Mac compatible apps. Why should you use a device from the last generation with Bootcamp Windows if you can have the modern and lower priced Windows alternative Envy 13 QHD?
Perhaps because of the comparatively mediocre battery runtime of the Envy. All the rivals are better in this regard – and there is still no Windows device that can beat the MacBook Pro 13 Retina. However, this is the only real issue of our review unit. If you prefer stationary use or only use it occasionally on your way home, the HP Envy 13 subnotebook is a solid companion.
HP Envy 13-d000ng
- 02/16/2016 v5 (old)
Oliver Moebel
Price comparison
