 Deutsch
 English
 Español
 Français
 Italiano
 Nederlands
 Polski
 Português
 Русский
 Türkçe
 Svenska
 Chinese
 Magyar
Laptop, Smartphone, and Tablet Comparison
On this page you are able to compare test data and specifications from our reviews. Select a model using our search, the search box below or the compare link in our reviews (below the specs).
Lenovo ThinkPad E590-20NC0003GELenovo ThinkPad E590 (i7-8565U, UHD 620, FHD) Laptop Review by Benjamin Herzig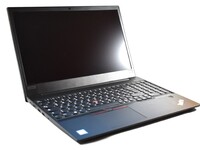 | ||||||||||||||||||||||||||||
#454 Intel Core i7-8565U 16384 MB 512 GB SSD 15.60-inch 1920x1080 1923 g 369 x 252.5 x 19.9 45 Wh 950 Euro | ||||||||||||||||||||||||||||
SpecificationsLenovo ThinkPad E590-20NC0003GE (ThinkPad E590 Series) Processor Intel Core i7-8565U 4 x 1.8 - 4.6 GHz (Intel Core i7) Graphics adapter Memory 16 GB , DDR4-2400, 1 of 2 slots free, max 64GB Display 15.60 inch 16:9, 1920 x 1080 pixel 141 PPI, LP156WFC-SPDB, IPS LED, glossy: no Mainboard Intel Cannon Lake-U PCH-LP Premium Storage Toshiba KBG30ZMT512G, 512 GB , M.2 2280, PCIe NVMe, 440 GB free Soundcard Intel Cannon Lake-H/S - cAVS (Audio, Voice, Speech) Connections 1 USB 2.0, 2 USB 3.0 / 3.1 Gen1, 1 USB 3.1 Gen2, 1 HDMI, 1 DisplayPort, 1 Kensington Lock, Audio Connections: Combo audio, Card Reader: MicroSD, 1 Fingerprint Reader Networking Realtek RTL8168/8111 Gigabit-LAN (10/100/1000MBit/s), Intel Wireless-AC 9260 (a/b/g/n = Wi-Fi 4/ac = Wi-Fi 5/), Bluetooth 5.0 Size height x width x depth (in mm): 19.9 x 369 x 252.5 ( = 0.78 x 14.53 x 9.94 in) Battery 45 Wh Lithium-Ion Operating System Microsoft Windows 10 Pro 64 Bit Camera Webcam: 720p Additional features Speakers: 2 W stereo, Keyboard: 6 row chiclet with numpad, Keyboard Light: yes, Lenovo Vantage, McAfee LiveSafe, Microsoft Office Trial, Dolby Audio Premium, 12 Months Warranty Weight 1.923 kg ( = 67.83 oz / 4.24 pounds), Power Supply: 337 g ( = 11.89 oz / 0.74 pounds) Price 950 Euro
| ||||||||||||||||||||||||||||
LP156WFC-SPDB tested with X-Rite i1Pro 2 Maximum: 258 cd/m² (Nits) Average: 251.2 cd/m² Minimum: 2.1 cd/m²Brightness Distribution: 90 % Center on Battery: 251 cd/m² Contrast: 1270:1 (Black: 0.2 cd/m²) ΔE Color 5.6 | 0.5-29.43 Ø5, calibrated: 4.9 ΔE Greyscale 3.1 | 0.57-98 Ø5.3 57.1% sRGB (Argyll 1.6.3 3D) 36.3% AdobeRGB 1998 (Argyll 1.6.3 3D) 39.47% AdobeRGB 1998 (Argyll 2.2.0 3D) 57.5% sRGB (Argyll 2.2.0 3D) 38.21% Display P3 (Argyll 2.2.0 3D) Gamma: 2.22 | ||||||||||||||||||||||||||||
ERROR no Specs ID specified in element or header and also no heat ID found in element
| ||||||||||||||||||||||||||||
Noise Level
| ||||||||||||||||||||||||||||
Power Consumption
| ||||||||||||||||||||||||||||
Lenovo ThinkPad E590-20NC0003GE
-
09/26/2019 v7
Office - Weighted Average
| ||||||||||||||||||||||||||||
| ||||||||||||||||||||||||||||
CrystalDiskMark 3.0 Write 4k QD32: 155.8 MB/s | ||||||||||||||||||||||||||||
CrystalDiskMark 3.0 Read 4k QD32: 231.7 MB/s | ||||||||||||||||||||||||||||
CrystalDiskMark 3.0 Write 4k: 96.1 MB/s | ||||||||||||||||||||||||||||
CrystalDiskMark 3.0 Read 4k: 43.61 MB/s | ||||||||||||||||||||||||||||
CrystalDiskMark 3.0 Write 512: 585 MB/s | ||||||||||||||||||||||||||||
CrystalDiskMark 3.0 Read 512: 758 MB/s | ||||||||||||||||||||||||||||
CrystalDiskMark 3.0 Write Seq: 779 MB/s | ||||||||||||||||||||||||||||
CrystalDiskMark 3.0 Read Seq: 947 MB/s | ||||||||||||||||||||||||||||
AS SSD Copy Game MB/s: 599 MB/s | ||||||||||||||||||||||||||||
AS SSD Copy Program MB/s: 209.7 MB/s | ||||||||||||||||||||||||||||
AS SSD Copy ISO MB/s: 876 MB/s | ||||||||||||||||||||||||||||
AS SSD Score Total: 2139 Points | ||||||||||||||||||||||||||||
AS SSD Score Write: 649 Points | ||||||||||||||||||||||||||||
AS SSD Score Read: 999 Points | ||||||||||||||||||||||||||||
AS SSD Access Time Write: 0.188 ms* | ||||||||||||||||||||||||||||
AS SSD Access Time Read: 0.081 ms* | ||||||||||||||||||||||||||||
AS SSD 4K-64 Write: 488 MB/s | ||||||||||||||||||||||||||||
AS SSD 4K-64 Read: 825 MB/s | ||||||||||||||||||||||||||||
AS SSD 4K Write: 81.8 MB/s | ||||||||||||||||||||||||||||
AS SSD 4K Read: 38.82 MB/s | ||||||||||||||||||||||||||||
AS SSD Seq Write: 789 MB/s | ||||||||||||||||||||||||||||
AS SSD Seq Read: 1348 MB/s | ||||||||||||||||||||||||||||
Cinebench R15 CPU Single 64Bit: 178 Points | ||||||||||||||||||||||||||||
Cinebench R15 CPU Multi 64Bit: 553 Points | ||||||||||||||||||||||||||||
Cinebench R15 Ref. Match 64Bit: 97.8 % | ||||||||||||||||||||||||||||
Cinebench R15 OpenGL 64Bit: 47.13 fps | ||||||||||||||||||||||||||||
3DMark 11 Performance Combined: 1554 Points | ||||||||||||||||||||||||||||
3DMark 11 Performance Physics: 4753 Points | ||||||||||||||||||||||||||||
3DMark 11 Performance GPU: 1844 Points | ||||||||||||||||||||||||||||
3DMark 11 Performance: 1989 Points | ||||||||||||||||||||||||||||
3DMark Fire Strike Combined: 368 Points | ||||||||||||||||||||||||||||
3DMark Fire Strike Physics: 4932 Points | ||||||||||||||||||||||||||||
3DMark Fire Strike Graphics: 1183 Points | ||||||||||||||||||||||||||||
3DMark Fire Strike Score: 1068 Points | ||||||||||||||||||||||||||||
3DMark Cloud Gate Standard Physics: 3489 Points | ||||||||||||||||||||||||||||
3DMark Cloud Gate Standard Graphics: 9446 Points | ||||||||||||||||||||||||||||
3DMark Cloud Gate Standard Score: 6847 Points | ||||||||||||||||||||||||||||
Mozilla Kraken 1.1 Total: 2622 ms* | ||||||||||||||||||||||||||||
Octane V2 Total Score: 13935 Points | ||||||||||||||||||||||||||||
CrystalDiskMark 5.2 / 6 Write 4K: 53.4 MB/s | ||||||||||||||||||||||||||||
CrystalDiskMark 5.2 / 6 Read 4K: 33.03 MB/s | ||||||||||||||||||||||||||||
CrystalDiskMark 5.2 / 6 Write Seq: 624 MB/s | ||||||||||||||||||||||||||||
CrystalDiskMark 5.2 / 6 Read Seq: 835 MB/s | ||||||||||||||||||||||||||||
CrystalDiskMark 5.2 / 6 Write 4K Q32T1: 87.4 MB/s | ||||||||||||||||||||||||||||
CrystalDiskMark 5.2 / 6 Read 4K Q32T1: 135.9 MB/s | ||||||||||||||||||||||||||||
CrystalDiskMark 5.2 / 6 Write Seq Q32T1: 784 MB/s | ||||||||||||||||||||||||||||
CrystalDiskMark 5.2 / 6 Read Seq Q32T1: 1623 MB/s | ||||||||||||||||||||||||||||
PCMark 8 Work Score Accelerated v2: 3596 Points | ||||||||||||||||||||||||||||
PCMark 8 Home Score Accelerated v2: 2577 Points | ||||||||||||||||||||||||||||
JetStream 1.1 Total Score: 107.6 Points | ||||||||||||||||||||||||||||
PCMark 10 Digital Content Creation: 2264 Points | ||||||||||||||||||||||||||||
PCMark 10 Productivity: 3381 Points | ||||||||||||||||||||||||||||
PCMark 10 Essentials: 5450 Points | ||||||||||||||||||||||||||||
PCMark 10 Score: 2486 Points | ||||||||||||||||||||||||||||
BioShock Infinite Ultra Preset, DX11 (DDOF): 8.4 fps | ||||||||||||||||||||||||||||
BioShock Infinite High Preset: 26.3 fps | ||||||||||||||||||||||||||||
BioShock Infinite Medium Preset: 32.4 fps | ||||||||||||||||||||||||||||
BioShock Infinite Very Low Preset: 62.5 fps | ||||||||||||||||||||||||||||
The Witcher 3 Low Graphics & Postprocessing: 16.6 fps | ||||||||||||||||||||||||||||
Rise of the Tomb Raider Lowest Preset: 21.5 fps | ||||||||||||||||||||||||||||
SD Card Reader JPG Copy Test (av. of 3 runs): 77.6 MB/s | ||||||||||||||||||||||||||||
SD Card Reader AS SSD Seq Read Test (1GB): 85.2 MB/s | ||||||||||||||||||||||||||||
Battery Runtime WiFi Websurfing: 383 min | ||||||||||||||||||||||||||||
Response Times Response Time Grey 50% / Grey 80%: 40 ms* | ||||||||||||||||||||||||||||
Response Times Response Time Black / White: 27.6 ms* | ||||||||||||||||||||||||||||
Response Times PWM Frequency: 0 Hz | ||||||||||||||||||||||||||||
Emissions Fan Noise: 30.6 dB(A) | ||||||||||||||||||||||||||||
Loudspeakers Pink Noise: 70 dB(A) | ||||||||||||||||||||||||||||
Networking iperf3 receive AX12: 592 MBit/s | ||||||||||||||||||||||||||||
Networking iperf3 transmit AX12: 683 MBit/s | ||||||||||||||||||||||||||||
Display Display P3 Coverage: 38.21 % | ||||||||||||||||||||||||||||
Display sRGB Coverage: 57.5 % | ||||||||||||||||||||||||||||
Display AdobeRGB 1998 Coverage: 39.47 % | ||||||||||||||||||||||||||||

Console
log 06. 10:02:09
#0 before search +0s ... 0s
#1 after search +0s ... 0s
#2 added compareJS +0s ... 0s
#3 looking up spec 308380 +0s ... 0s
#4 more than one entry found +0.002s ... 0.002s
#5 ThinkPad E590-20NC0003GE for array +0.285s ... 0.287s
#6 return log +0s ... 0.287s