 Deutsch
 English
 Español
 Français
 Italiano
 Nederlands
 Polski
 Português
 Русский
 Türkçe
 Svenska
 Chinese
 Magyar
Laptop, Smartphone, and Tablet Comparison
On this page you are able to compare test data and specifications from our reviews. Select a model using our search, the search box below or the compare link in our reviews (below the specs).
Dell XPS 13 9370 FHD i5Dell XPS 13 9370 (Core i5, FHD) Laptop Review by Andreas Osthoff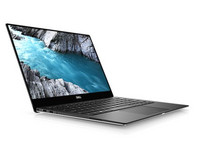 | Dell XPS 13 9360 FHD i7 IrisDell XPS 13 9360 (FHD, i7, Iris) Laptop Review by Andreas Osthoff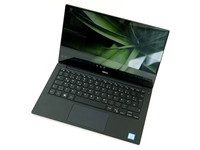 | ||||||||||||||||||||||||||||||||||||||||||||||||||||||||||||
#554 Intel Core i5-8250U 8192 MB 256 GB SSD 13.30-inch 1920x1080 1210 g 302 x 199 x 11.6 52 Wh 1349 Euro | #572 Intel Core i7-7560U » 103% #518 Intel Iris Plus Graphics 640 » 87% 16384 MB » 200% 512 GB » 200% SSD 13.30-inch » 100% 1920x1080 » 100% 1228 g » 101% 304 x 201 x 15 » 131% 60 Wh » 115% 1575 Euro » 117% | ||||||||||||||||||||||||||||||||||||||||||||||||||||||||||||
SpecificationsDell XPS 13 9370 FHD i5 (XPS 13 9370 Series) Processor Intel Core i5-8250U 4 x 1.6 - 3.4 GHz, Kaby Lake Refresh Graphics adapter Intel UHD Graphics 620, Core: 1100 MHz, Memory: 933 MHz, 22.20.16.4815 Memory 8 GB , dual-channel, LPDDR3-1866, soldered Display 13.30 inch 16:9, 1920 x 1080 pixel 166 PPI, SHP1484, IPS, LQ133M1, glossy: yes Mainboard Intel Kaby Lake-U iHDCP 2.2 Premium PCH Storage Toshiba XG5 KXG50ZNV256G, 256 GB , 197 GB free Soundcard Intel Kaby Lake-U/Y PCH - High Definition Audio Connections 3 USB 3.1 Gen2, 2 Thunderbolt, 3 DisplayPort, 1 Kensington Lock, Audio Connections: 3.5 mm audio, Card Reader: MicroSD, 1 Fingerprint Reader Networking Atheros/Qualcomm QCA6174 (a/b/g/n = Wi-Fi 4/ac = Wi-Fi 5/), Bluetooth 4.1 Size height x width x depth (in mm): 11.6 x 302 x 199 ( = 0.46 x 11.89 x 7.83 in) Battery 52 Wh Lithium-Polymer, 4-cell Operating System Microsoft Windows 10 Home 64 Bit Camera Webcam: HD Webcam Additional features Speakers: stereo, Keyboard: chiclet, Keyboard Light: yes, 45 W power supply, USB-C/USB-A adapter, service booklets, McAfee (30-day trial), Office (30-day trial), 12 Months Warranty Weight 1.21 kg ( = 42.68 oz / 2.67 pounds), Power Supply: 227 g ( = 8.01 oz / 0.5 pounds) Price 1349 Euro
| SpecificationsDell XPS 13 9360 FHD i7 Iris (XPS 13 9360 Series) Processor Intel Core i7-7560U 2 x 2.4 - 3.8 GHz, Kaby Lake Graphics adapter Intel Iris Plus Graphics 640 - 64 MB VRAM, Core: 1050 MHz, Memory: 1067 MHz, eDRAM-Cache Memory 16 GB , Dual-Channel, DDR4-2133 Display 13.30 inch 16:9, 1920 x 1080 pixel 166 PPI, SHP1449, IPS, glossy: no Mainboard Intel Kaby Lake-U iHDCP 2.2 Premium PCH Storage Toshiba XG4 NVMe (THNSN5512GPUK), 512 GB , 434 GB free Soundcard Intel Kaby Lake-U/Y PCH - High Definition Audio Connections 2 USB 3.0 / 3.1 Gen1, 1 USB 3.1 Gen2, 1 Thunderbolt, 1 DisplayPort, 1 Kensington Lock, Audio Connections: 3.5 mm Audio, Card Reader: SD-Leser, Brightness Sensor Networking Killer Wireless-n/a/ac 1535 Wireless Network Adapter (b/g/n = Wi-Fi 4/ac = Wi-Fi 5/), Bluetooth 4.1 Size height x width x depth (in mm): 15 x 304 x 201 ( = 0.59 x 11.97 x 7.91 in) Battery 60 Wh Lithium-Polymer Operating System Microsoft Windows 10 Home 64 Bit Camera Webcam: 720p Additional features Speakers: Stereo, Keyboard: Chiclet, Keyboard Light: yes, 45 W PSU, service brochures, Dell Product Manager, Support Assist, Norton Anti-Virus, Waves MaxxAudio Pro, 24 Months Warranty Weight 1.228 kg ( = 43.32 oz / 2.71 pounds), Power Supply: 263 g ( = 9.28 oz / 0.58 pounds) Price 1575 Euro
| ||||||||||||||||||||||||||||||||||||||||||||||||||||||||||||
SHP1484 tested with X-Rite i1Pro 2 Maximum: 431 cd/m² (Nits) Average: 405.2 cd/m² Minimum: 20.4 cd/m²Brightness Distribution: 87 % Center on Battery: 428 cd/m² Contrast: 1646:1 (Black: 0.26 cd/m²) ΔE Color 3.8 | 0.5-29.43 Ø5 ΔE Greyscale 4.4 | 0.57-98 Ø5.3 96.4% sRGB (Argyll 1.6.3 3D) 62.8% AdobeRGB 1998 (Argyll 1.6.3 3D) 69.6% AdobeRGB 1998 (Argyll 2.2.0 3D) 96.6% sRGB (Argyll 2.2.0 3D) 68.9% Display P3 (Argyll 2.2.0 3D) Gamma: 2.21 |
SHP1449 tested with X-Rite i1Pro 2 Maximum: 461 cd/m² (Nits) Average: 418.3 cd/m² Minimum: 20.9 cd/m²Brightness Distribution: 85 % Center on Battery: 461 cd/m² Contrast: 2305:1 (Black: 0.2 cd/m²) ΔE Color 5.4 | 0.5-29.43 Ø5 ΔE Greyscale 5.4 | 0.57-98 Ø5.3 76.9% sRGB (Argyll 1.6.3 3D) 48.6% AdobeRGB 1998 (Argyll 1.6.3 3D) 53.3% AdobeRGB 1998 (Argyll 2.2.0 3D) 77.4% sRGB (Argyll 2.2.0 3D) 51.6% Display P3 (Argyll 2.2.0 3D) Gamma: 2.15 | ||||||||||||||||||||||||||||||||||||||||||||||||||||||||||||
ERROR no Specs ID specified in element or header and also no heat ID found in element
|
ERROR no Specs ID specified in element or header and also no heat ID found in element
| ||||||||||||||||||||||||||||||||||||||||||||||||||||||||||||
Noise Level
| Noise Level
| ||||||||||||||||||||||||||||||||||||||||||||||||||||||||||||
Power Consumption
| Power Consumption
| ||||||||||||||||||||||||||||||||||||||||||||||||||||||||||||
Dell XPS 13 9370 FHD i5
-
02/07/2018 v6(old)
Subnotebook - Weighted Average
|
Dell XPS 13 9360 FHD i7 Iris
-
11/06/2017 v6(old)
Subnotebook - Weighted Average
| ||||||||||||||||||||||||||||||||||||||||||||||||||||||||||||
|
| ||||||||||||||||||||||||||||||||||||||||||||||||||||||||||||
CrystalDiskMark 3.0 Write 4k QD32: 339.9 MB/s | CrystalDiskMark 3.0 Write 4k QD32: 431.3 MB/s » 127% | ||||||||||||||||||||||||||||||||||||||||||||||||||||||||||||
CrystalDiskMark 3.0 Read 4k QD32: 381.8 MB/s | CrystalDiskMark 3.0 Read 4k QD32: 425.1 MB/s » 111% | ||||||||||||||||||||||||||||||||||||||||||||||||||||||||||||
CrystalDiskMark 3.0 Write 4k: 127.5 MB/s | CrystalDiskMark 3.0 Write 4k: 133.6 MB/s » 105% | ||||||||||||||||||||||||||||||||||||||||||||||||||||||||||||
CrystalDiskMark 3.0 Read 4k: 34.18 MB/s | CrystalDiskMark 3.0 Read 4k: 37.31 MB/s » 109% | ||||||||||||||||||||||||||||||||||||||||||||||||||||||||||||
CrystalDiskMark 3.0 Write 512: 353.9 MB/s | CrystalDiskMark 3.0 Write 512: 502 MB/s » 142% | ||||||||||||||||||||||||||||||||||||||||||||||||||||||||||||
CrystalDiskMark 3.0 Read 512: 840 MB/s | CrystalDiskMark 3.0 Read 512: 1058 MB/s » 126% | ||||||||||||||||||||||||||||||||||||||||||||||||||||||||||||
CrystalDiskMark 3.0 Write Seq: 352.7 MB/s | CrystalDiskMark 3.0 Write Seq: 617 MB/s » 175% | ||||||||||||||||||||||||||||||||||||||||||||||||||||||||||||
CrystalDiskMark 3.0 Read Seq: 1875 MB/s | CrystalDiskMark 3.0 Read Seq: 1314 MB/s » 70% | ||||||||||||||||||||||||||||||||||||||||||||||||||||||||||||
Cinebench R15 CPU Single 64Bit: 144 Points | Cinebench R15 CPU Single 64Bit: 153 Points » 106% | ||||||||||||||||||||||||||||||||||||||||||||||||||||||||||||
Cinebench R15 CPU Multi 64Bit: 669 Points | Cinebench R15 CPU Multi 64Bit: 336 Points » 50% | ||||||||||||||||||||||||||||||||||||||||||||||||||||||||||||
Cinebench R15 Ref. Match 64Bit: 97.8 % | Cinebench R15 Ref. Match 64Bit: 97.8 % » 100% | ||||||||||||||||||||||||||||||||||||||||||||||||||||||||||||
Cinebench R15 OpenGL 64Bit: 54.7 fps | Cinebench R15 OpenGL 64Bit: 52.4 fps » 96% | ||||||||||||||||||||||||||||||||||||||||||||||||||||||||||||
3DMark 11 Performance Combined: 1665 Points | 3DMark 11 Performance Combined: 1838 Points » 110% | ||||||||||||||||||||||||||||||||||||||||||||||||||||||||||||
3DMark 11 Performance Physics: 7356 Points | 3DMark 11 Performance Physics: 4693 Points » 64% | ||||||||||||||||||||||||||||||||||||||||||||||||||||||||||||
3DMark 11 Performance GPU: 1776 Points | 3DMark 11 Performance GPU: 2124 Points » 120% | ||||||||||||||||||||||||||||||||||||||||||||||||||||||||||||
3DMark 11 Performance: 1989 Points | 3DMark 11 Performance: 2275 Points » 114% | ||||||||||||||||||||||||||||||||||||||||||||||||||||||||||||
3DMark Fire Strike Physics: 9124 Points | 3DMark Fire Strike Physics: 5649 Points » 62% | ||||||||||||||||||||||||||||||||||||||||||||||||||||||||||||
3DMark Fire Strike Graphics: 1100 Points | 3DMark Fire Strike Graphics: 1369 Points » 124% | ||||||||||||||||||||||||||||||||||||||||||||||||||||||||||||
3DMark Fire Strike Score: 977 Points | 3DMark Fire Strike Score: 1265 Points » 129% | ||||||||||||||||||||||||||||||||||||||||||||||||||||||||||||
3DMark Time Spy Stress Test: 93.3 % | |||||||||||||||||||||||||||||||||||||||||||||||||||||||||||||
3DMark Time Spy CPU: 1857 Points | |||||||||||||||||||||||||||||||||||||||||||||||||||||||||||||
3DMark Time Spy Graphics: 413 Points | |||||||||||||||||||||||||||||||||||||||||||||||||||||||||||||
3DMark Time Spy Score: 467 Points | |||||||||||||||||||||||||||||||||||||||||||||||||||||||||||||
3DMark Fire Strike Ultra Combined: 121 Points | |||||||||||||||||||||||||||||||||||||||||||||||||||||||||||||
3DMark Fire Strike Ultra Physics: 5314 Points | |||||||||||||||||||||||||||||||||||||||||||||||||||||||||||||
3DMark Fire Strike Ultra Graphics: 292 Points | |||||||||||||||||||||||||||||||||||||||||||||||||||||||||||||
3DMark Fire Strike Ultra Score: 292 Points | |||||||||||||||||||||||||||||||||||||||||||||||||||||||||||||
3DMark Fire Strike Extreme Combined: 215 Points | |||||||||||||||||||||||||||||||||||||||||||||||||||||||||||||
3DMark Fire Strike Extreme Physics: 5591 Points | |||||||||||||||||||||||||||||||||||||||||||||||||||||||||||||
3DMark Fire Strike Extreme Graphics: 605 Points | |||||||||||||||||||||||||||||||||||||||||||||||||||||||||||||
3DMark Fire Strike Extreme Score: 577 Points | |||||||||||||||||||||||||||||||||||||||||||||||||||||||||||||
3DMark Fire Strike Combined: 2589 Points | |||||||||||||||||||||||||||||||||||||||||||||||||||||||||||||
3DMark Cloud Gate Standard Physics: 3651 Points | |||||||||||||||||||||||||||||||||||||||||||||||||||||||||||||
3DMark Cloud Gate Standard Graphics: 11232 Points | |||||||||||||||||||||||||||||||||||||||||||||||||||||||||||||
3DMark Cloud Gate Standard Score: 7685 Points | |||||||||||||||||||||||||||||||||||||||||||||||||||||||||||||
3DMark Ice Storm Unlimited Physics: 51358 Points | |||||||||||||||||||||||||||||||||||||||||||||||||||||||||||||
3DMark Ice Storm Unlimited Graphics Score: 145481 Points | |||||||||||||||||||||||||||||||||||||||||||||||||||||||||||||
3DMark Ice Storm Unlimited Score: 103378 Points | |||||||||||||||||||||||||||||||||||||||||||||||||||||||||||||
Mozilla Kraken 1.1 Total: 1065 ms* | Mozilla Kraken 1.1 Total: 997 ms* » 94% | ||||||||||||||||||||||||||||||||||||||||||||||||||||||||||||
Octane V2 Total Score: 34196 Points | Octane V2 Total Score: 36944 Points » 108% | ||||||||||||||||||||||||||||||||||||||||||||||||||||||||||||
CrystalDiskMark 5.2 / 6 Write 4K: 128.2 MB/s | CrystalDiskMark 5.2 / 6 Write 4K: 131.9 MB/s » 103% | ||||||||||||||||||||||||||||||||||||||||||||||||||||||||||||
CrystalDiskMark 5.2 / 6 Read 4K: 48.09 MB/s | CrystalDiskMark 5.2 / 6 Read 4K: 46.72 MB/s » 97% | ||||||||||||||||||||||||||||||||||||||||||||||||||||||||||||
CrystalDiskMark 5.2 / 6 Write Seq: 1088 MB/s | CrystalDiskMark 5.2 / 6 Write Seq: 1036 MB/s » 95% | ||||||||||||||||||||||||||||||||||||||||||||||||||||||||||||
CrystalDiskMark 5.2 / 6 Read Seq: 1877 MB/s | CrystalDiskMark 5.2 / 6 Read Seq: 1352 MB/s » 72% | ||||||||||||||||||||||||||||||||||||||||||||||||||||||||||||
CrystalDiskMark 5.2 / 6 Write 4K Q32T1: 367.1 MB/s | CrystalDiskMark 5.2 / 6 Write 4K Q32T1: 487.7 MB/s » 133% | ||||||||||||||||||||||||||||||||||||||||||||||||||||||||||||
CrystalDiskMark 5.2 / 6 Read 4K Q32T1: 411.9 MB/s | CrystalDiskMark 5.2 / 6 Read 4K Q32T1: 443.9 MB/s » 108% | ||||||||||||||||||||||||||||||||||||||||||||||||||||||||||||
CrystalDiskMark 5.2 / 6 Write Seq Q32T1: 1078 MB/s | CrystalDiskMark 5.2 / 6 Write Seq Q32T1: 1048 MB/s » 97% | ||||||||||||||||||||||||||||||||||||||||||||||||||||||||||||
CrystalDiskMark 5.2 / 6 Read Seq Q32T1: 2771 MB/s | CrystalDiskMark 5.2 / 6 Read Seq Q32T1: 1699 MB/s » 61% | ||||||||||||||||||||||||||||||||||||||||||||||||||||||||||||
Sunspider 1.0 Total Score: 80.4 ms* | |||||||||||||||||||||||||||||||||||||||||||||||||||||||||||||
PCMark 8 Work Score Accelerated v2: 4906 Points | PCMark 8 Work Score Accelerated v2: 4890 Points » 100% | ||||||||||||||||||||||||||||||||||||||||||||||||||||||||||||
PCMark 8 Creative Score Accelerated v2: 5044 Points | PCMark 8 Creative Score Accelerated v2: 5083 Points » 101% | ||||||||||||||||||||||||||||||||||||||||||||||||||||||||||||
PCMark 8 Home Score Accelerated v2: 3994 Points | PCMark 8 Home Score Accelerated v2: 3902 Points » 98% | ||||||||||||||||||||||||||||||||||||||||||||||||||||||||||||
PCMark 8 Storage Score v2: 4942 Points | |||||||||||||||||||||||||||||||||||||||||||||||||||||||||||||
JetStream 1.1 Total Score: 241.1 Points | JetStream 1.1 Total Score: 244.2 Points » 101% | ||||||||||||||||||||||||||||||||||||||||||||||||||||||||||||
PCMark 10 Digital Content Creation: 3058 Points | |||||||||||||||||||||||||||||||||||||||||||||||||||||||||||||
PCMark 10 Productivity: 5926 Points | |||||||||||||||||||||||||||||||||||||||||||||||||||||||||||||
PCMark 10 Essentials: 7988 Points | |||||||||||||||||||||||||||||||||||||||||||||||||||||||||||||
PCMark 10 Score: 3764 Points | |||||||||||||||||||||||||||||||||||||||||||||||||||||||||||||
Tomb Raider Ultra Preset: 14.1 fps | Tomb Raider Ultra Preset: 17.2 fps » 122% | ||||||||||||||||||||||||||||||||||||||||||||||||||||||||||||
Tomb Raider High Preset: 31.4 fps | Tomb Raider High Preset: 37 fps » 118% | ||||||||||||||||||||||||||||||||||||||||||||||||||||||||||||
Tomb Raider Normal Preset: 49.7 fps | Tomb Raider Normal Preset: 54.1 fps » 109% | ||||||||||||||||||||||||||||||||||||||||||||||||||||||||||||
Tomb Raider Low Preset: 103.5 fps | Tomb Raider Low Preset: 103 fps » 100% | ||||||||||||||||||||||||||||||||||||||||||||||||||||||||||||
BioShock Infinite Ultra Preset, DX11 (DDOF): 9.8 fps | BioShock Infinite Ultra Preset, DX11 (DDOF): 10.7 fps » 109% | ||||||||||||||||||||||||||||||||||||||||||||||||||||||||||||
BioShock Infinite High Preset: 29.1 fps | BioShock Infinite High Preset: 33.5 fps » 115% | ||||||||||||||||||||||||||||||||||||||||||||||||||||||||||||
BioShock Infinite Medium Preset: 34.1 fps | BioShock Infinite Medium Preset: 40.2 fps » 118% | ||||||||||||||||||||||||||||||||||||||||||||||||||||||||||||
BioShock Infinite Very Low Preset: 57.2 fps | BioShock Infinite Very Low Preset: 61 fps » 107% | ||||||||||||||||||||||||||||||||||||||||||||||||||||||||||||
The Witcher 3 Medium Graphics & Postprocessing: 10.7 fps | |||||||||||||||||||||||||||||||||||||||||||||||||||||||||||||
The Witcher 3 Low Graphics & Postprocessing: 16.8 fps | The Witcher 3 Low Graphics & Postprocessing: 17.5 fps » 104% | ||||||||||||||||||||||||||||||||||||||||||||||||||||||||||||
Rocket League High Quality: 22.2 fps | Rocket League High Quality: 25.3 fps » 114% | ||||||||||||||||||||||||||||||||||||||||||||||||||||||||||||
Rocket League Quality: 33.8 fps | Rocket League Quality: 35.8 fps » 106% | ||||||||||||||||||||||||||||||||||||||||||||||||||||||||||||
Rocket League Performance: 89.7 fps | Rocket League Performance: 69.3 fps » 77% | ||||||||||||||||||||||||||||||||||||||||||||||||||||||||||||
SD Card Reader JPG Copy Test (av. of 3 runs): 180 MB/s | SD Card Reader JPG Copy Test (av. of 3 runs): 186.1 MB/s » 103% | ||||||||||||||||||||||||||||||||||||||||||||||||||||||||||||
SD Card Reader AS SSD Seq Read Test (1GB): 204.9 MB/s | SD Card Reader AS SSD Seq Read Test (1GB): 219.8 MB/s » 107% | ||||||||||||||||||||||||||||||||||||||||||||||||||||||||||||
Battery Runtime WiFi Websurfing: 644 min | Battery Runtime WiFi Websurfing: 655 min » 102% | ||||||||||||||||||||||||||||||||||||||||||||||||||||||||||||
Response Times Response Time Grey 50% / Grey 80%: 62.4 ms* | Response Times Response Time Grey 50% / Grey 80%: 41.2 ms* » 66% | ||||||||||||||||||||||||||||||||||||||||||||||||||||||||||||
Response Times Response Time Black / White: 45.6 ms* | Response Times Response Time Black / White: 30 ms* » 66% | ||||||||||||||||||||||||||||||||||||||||||||||||||||||||||||
Response Times PWM Frequency: 1008 Hz | Response Times PWM Frequency: 19530 Hz » 1938% | ||||||||||||||||||||||||||||||||||||||||||||||||||||||||||||
Emissions Fan Noise: 37.3 dB(A) | Emissions Fan Noise: 34.9 dB(A) » 94% | ||||||||||||||||||||||||||||||||||||||||||||||||||||||||||||
Loudspeakers Pink Noise: 82.8 dB(A) | |||||||||||||||||||||||||||||||||||||||||||||||||||||||||||||
Networking iperf3 receive AX12: 588 MBit/s | Networking iperf3 receive AX12: 634 MBit/s » 108% | ||||||||||||||||||||||||||||||||||||||||||||||||||||||||||||
Networking iperf3 transmit AX12: 557 MBit/s | Networking iperf3 transmit AX12: 589 MBit/s » 106% | ||||||||||||||||||||||||||||||||||||||||||||||||||||||||||||
Display Display P3 Coverage: 68.9 % | Display Display P3 Coverage: 51.6 % » 75% | ||||||||||||||||||||||||||||||||||||||||||||||||||||||||||||
Display sRGB Coverage: 96.6 % | Display sRGB Coverage: 77.4 % » 80% | ||||||||||||||||||||||||||||||||||||||||||||||||||||||||||||
Display AdobeRGB 1998 Coverage: 69.6 % | Display AdobeRGB 1998 Coverage: 53.3 % » 77% | ||||||||||||||||||||||||||||||||||||||||||||||||||||||||||||
Rainbow Six Siege High Preset: 16.4 fps | |||||||||||||||||||||||||||||||||||||||||||||||||||||||||||||
Rainbow Six Siege Medium Preset: 29 fps | |||||||||||||||||||||||||||||||||||||||||||||||||||||||||||||
Rainbow Six Siege Low Preset: 50.5 fps | |||||||||||||||||||||||||||||||||||||||||||||||||||||||||||||
F1 2017 Medium Preset: 15 fps | |||||||||||||||||||||||||||||||||||||||||||||||||||||||||||||
F1 2017 Ultra Low Preset: 33 fps | |||||||||||||||||||||||||||||||||||||||||||||||||||||||||||||
Battlefield 4 Ultra Preset: 8.2 fps | |||||||||||||||||||||||||||||||||||||||||||||||||||||||||||||
Battlefield 4 High Preset: 23.2 fps | |||||||||||||||||||||||||||||||||||||||||||||||||||||||||||||
Battlefield 4 Medium Preset: 29.7 fps | |||||||||||||||||||||||||||||||||||||||||||||||||||||||||||||
Battlefield 4 Low Preset: 43.1 fps | |||||||||||||||||||||||||||||||||||||||||||||||||||||||||||||
Overwatch High (Render Scale 100 %): 29.9 fps | |||||||||||||||||||||||||||||||||||||||||||||||||||||||||||||
Overwatch Medium (Render Scale 100 %): 36.5 fps | |||||||||||||||||||||||||||||||||||||||||||||||||||||||||||||
Overwatch Low (Render Scale 100 %): 56.1 fps | |||||||||||||||||||||||||||||||||||||||||||||||||||||||||||||

Console
log 15. 06:54:55
#0 before search +0s ... 0s
#1 after search +0s ... 0s
#2 added compareJS +0s ... 0s
#3 looking up spec 288410 +0s ... 0s
#4 looking up spec 42926 +0s ... 0s
#5 more than one entry found +0.002s ... 0.003s
#6 XPS 13 9370 FHD i5 for array +0.425s ... 0.428s
#7 XPS 13 9360 FHD i7 Iris for array +0.579s ... 1.007s
#8 return log +0s ... 1.007s