Notebookcheck Logo

Titanfall Benchmarked

A little fun on the side. Violent multiplayer battles with parkour interludes and mechs armed to the teeth? That is how the former Call of Duty developers envision the future of the action genre. We took a closer look at the graphics demands; so read on to find out which graphics card you will need.
Titanfall Logo

For the original German article, see here.

Graphics

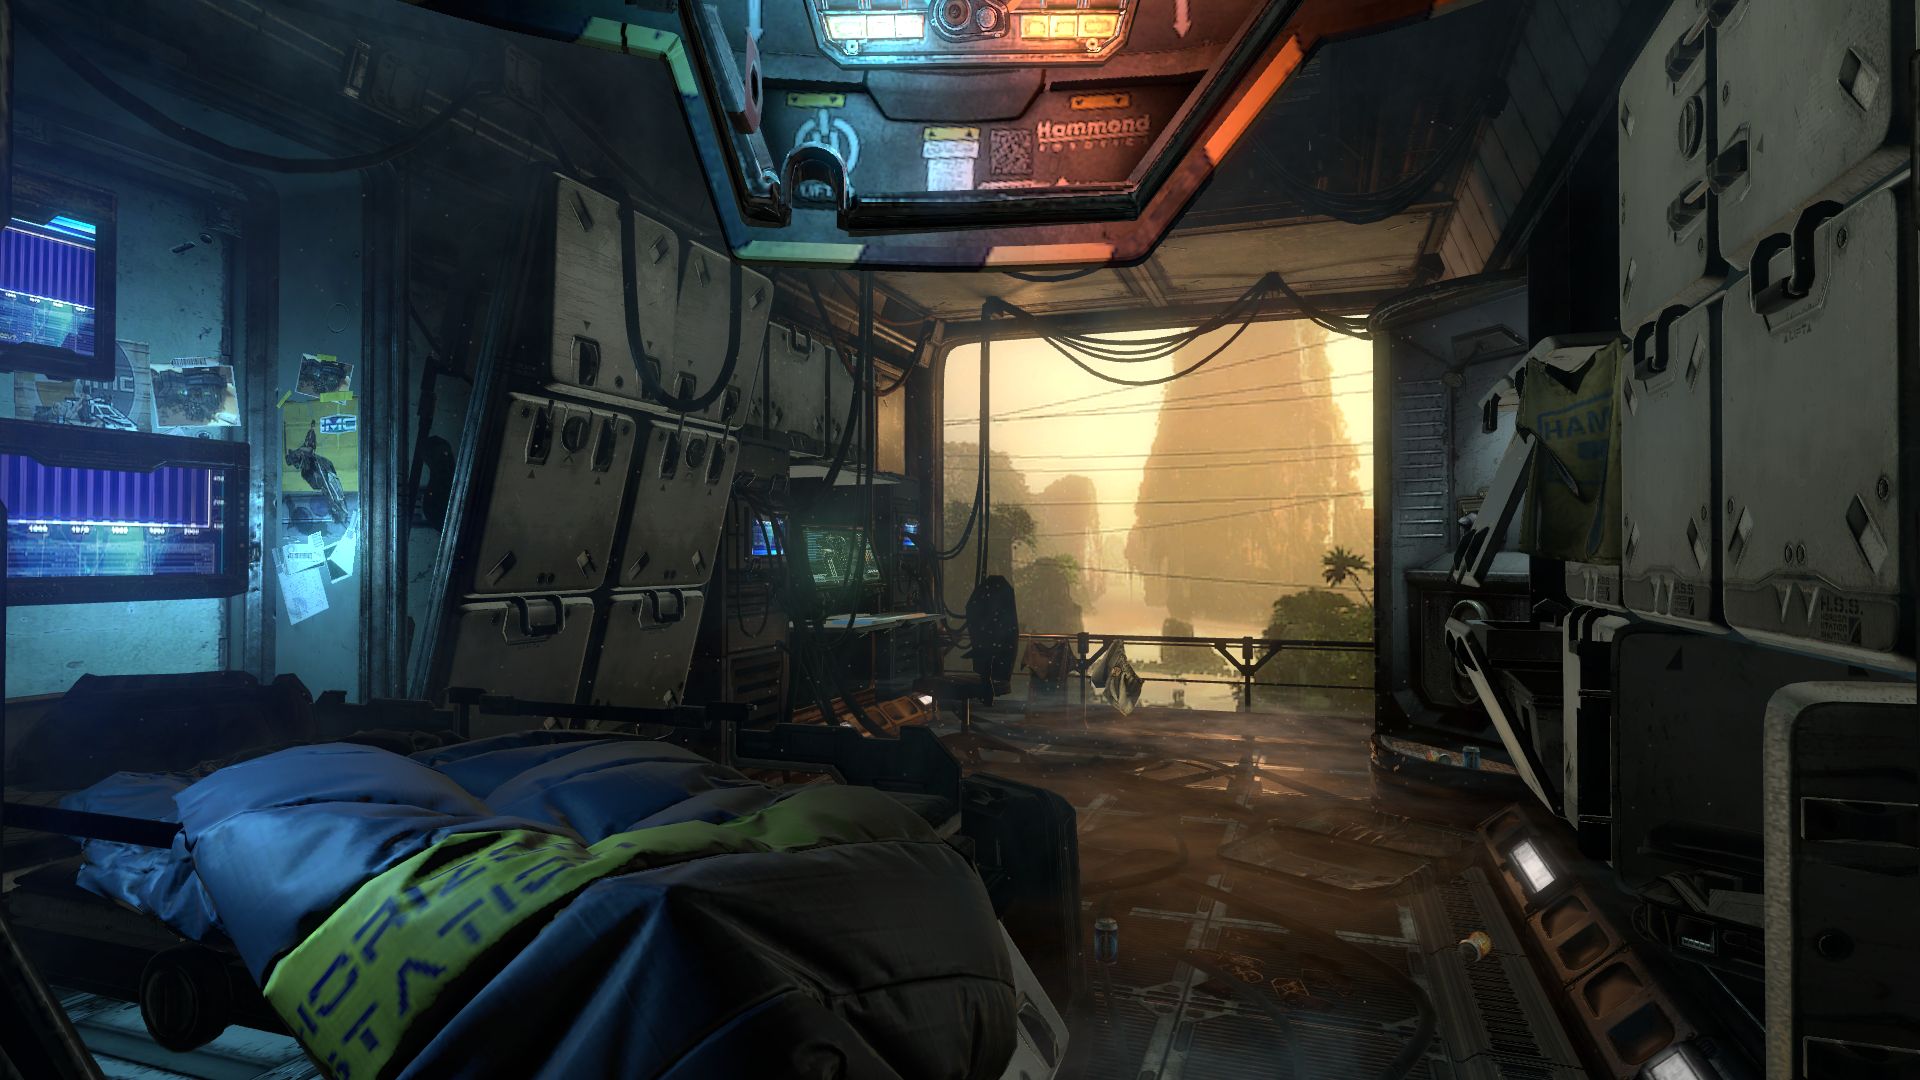
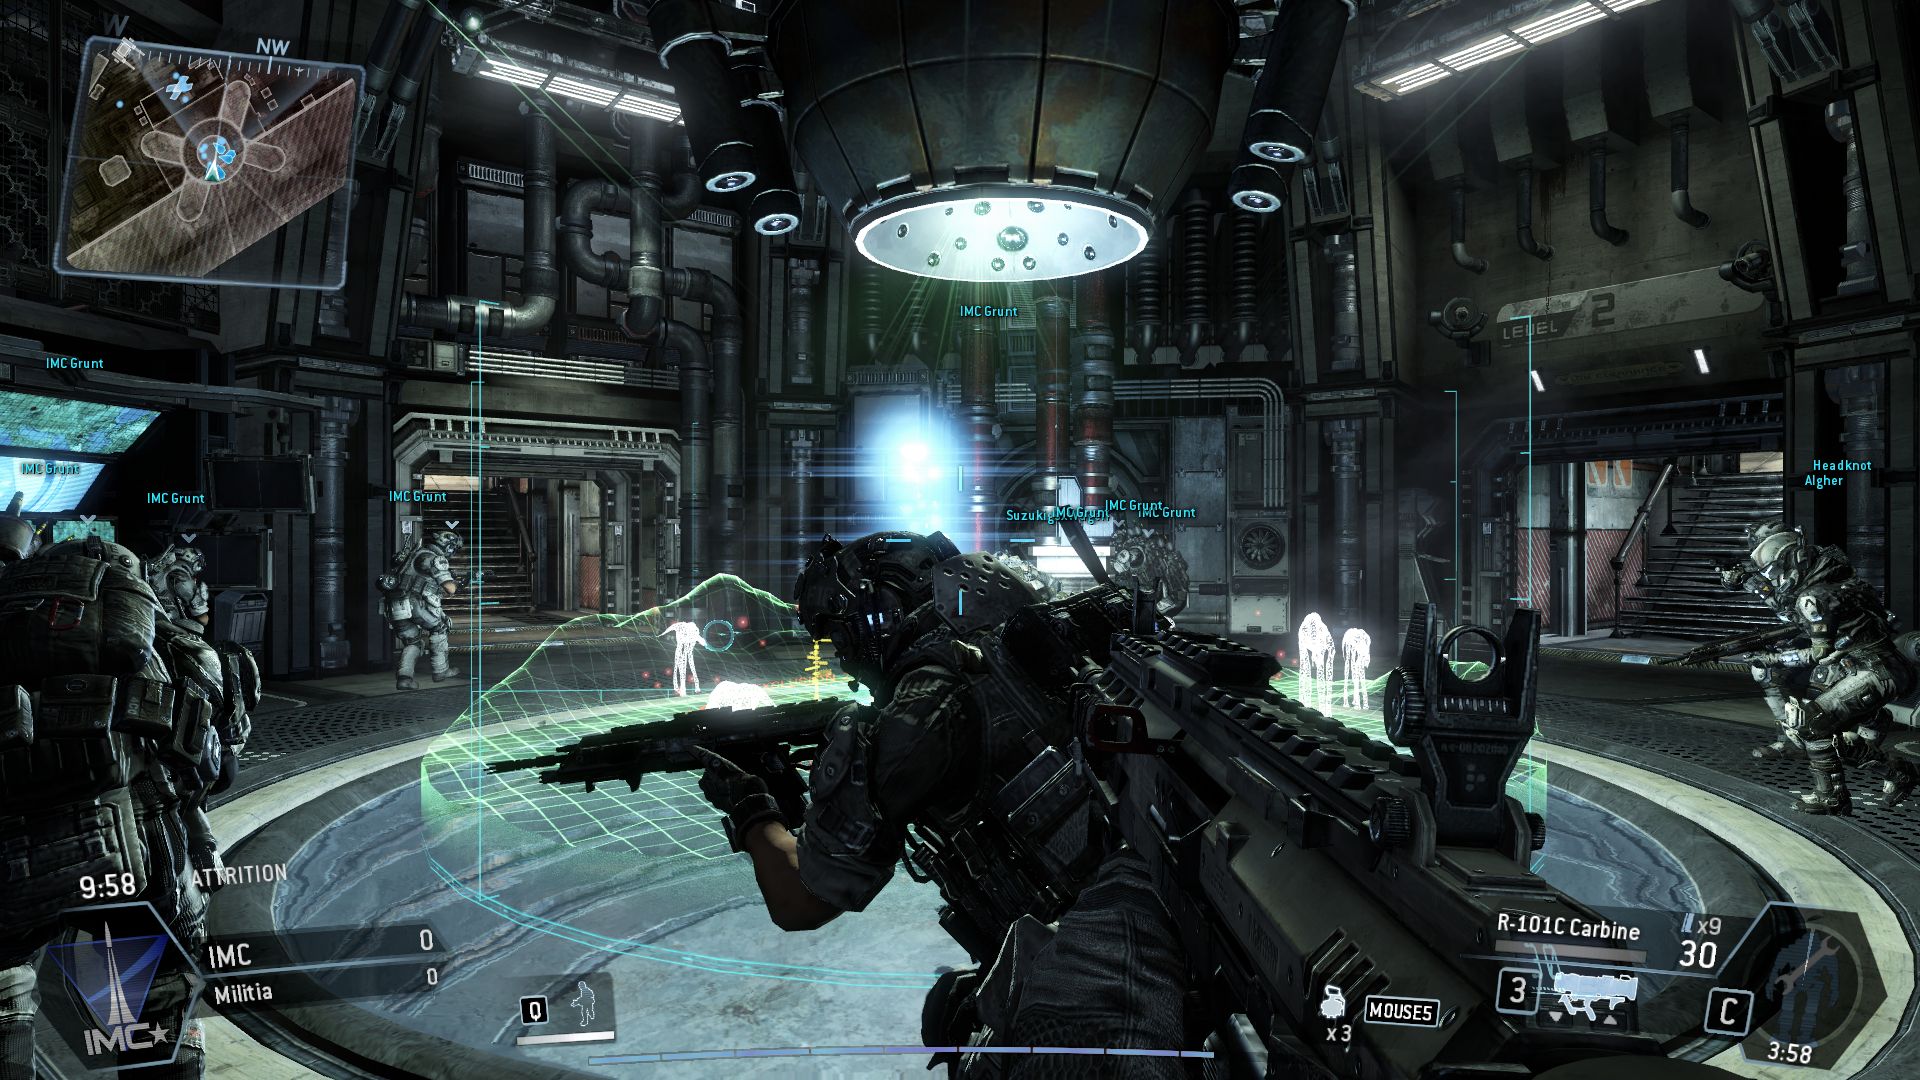
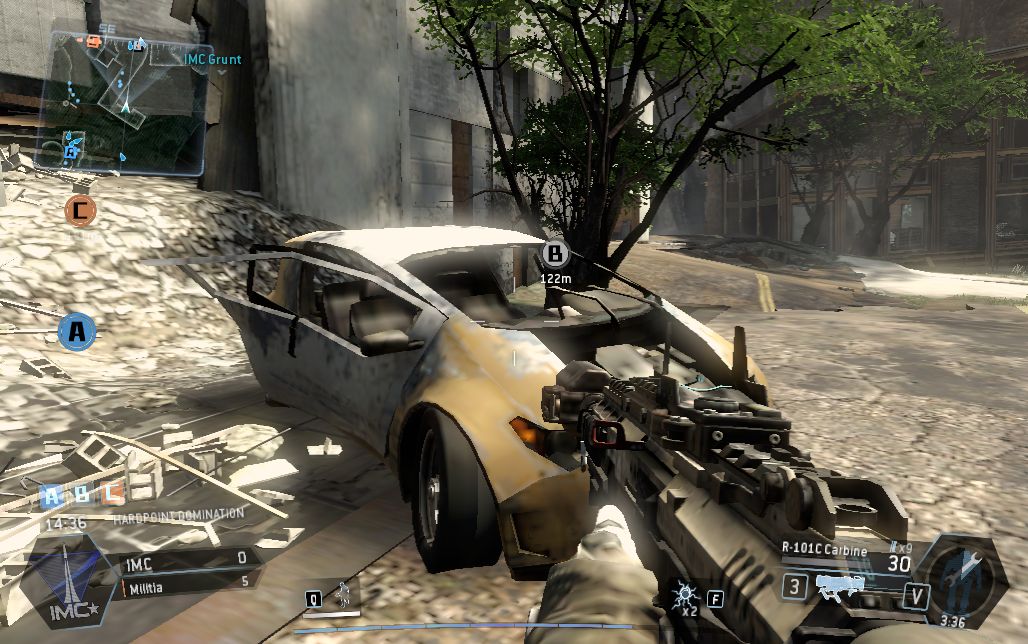
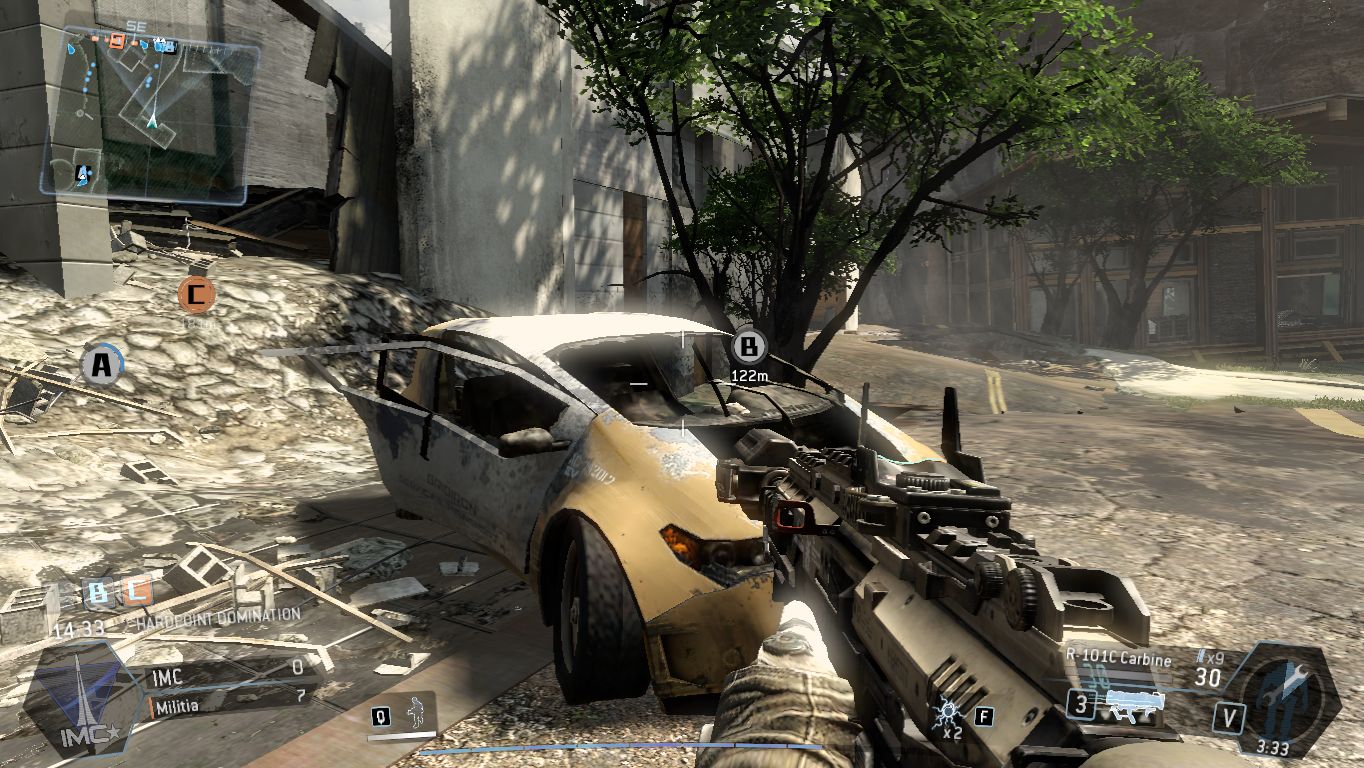
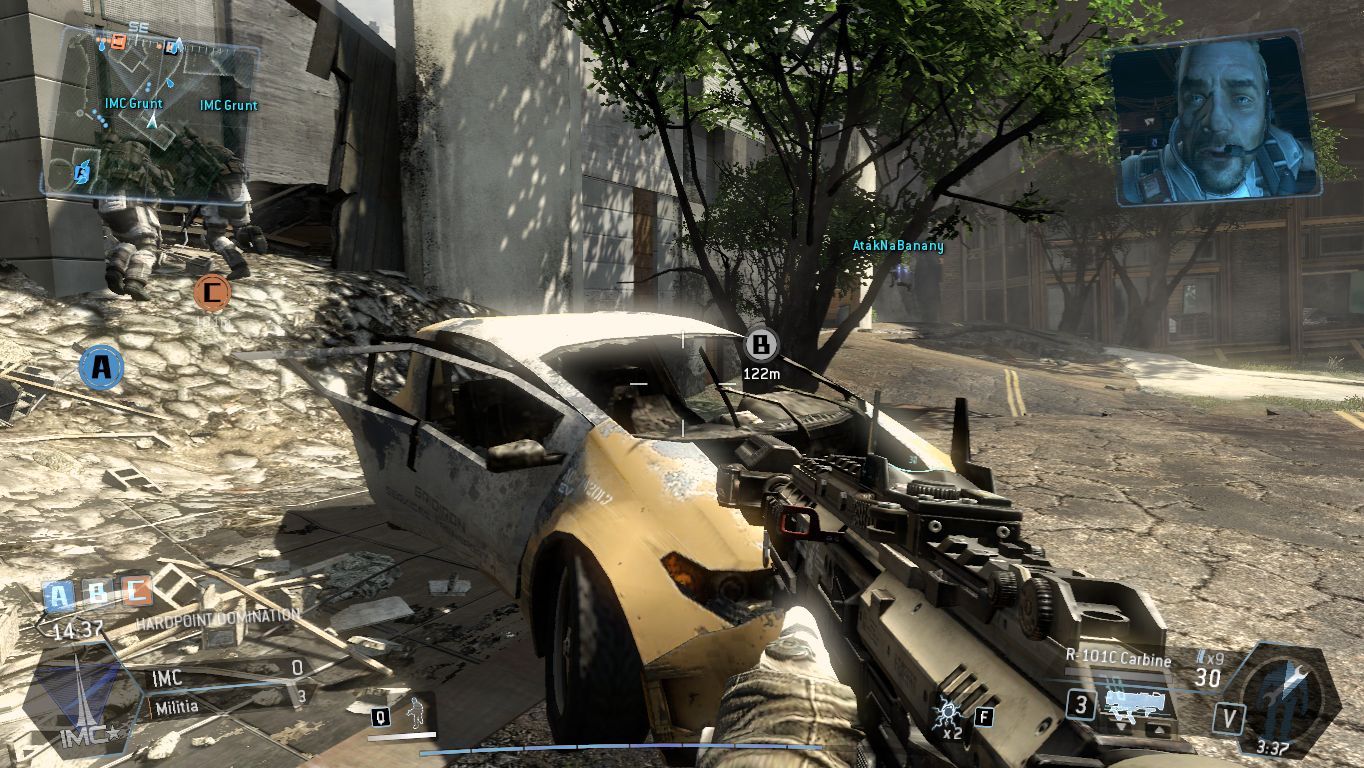
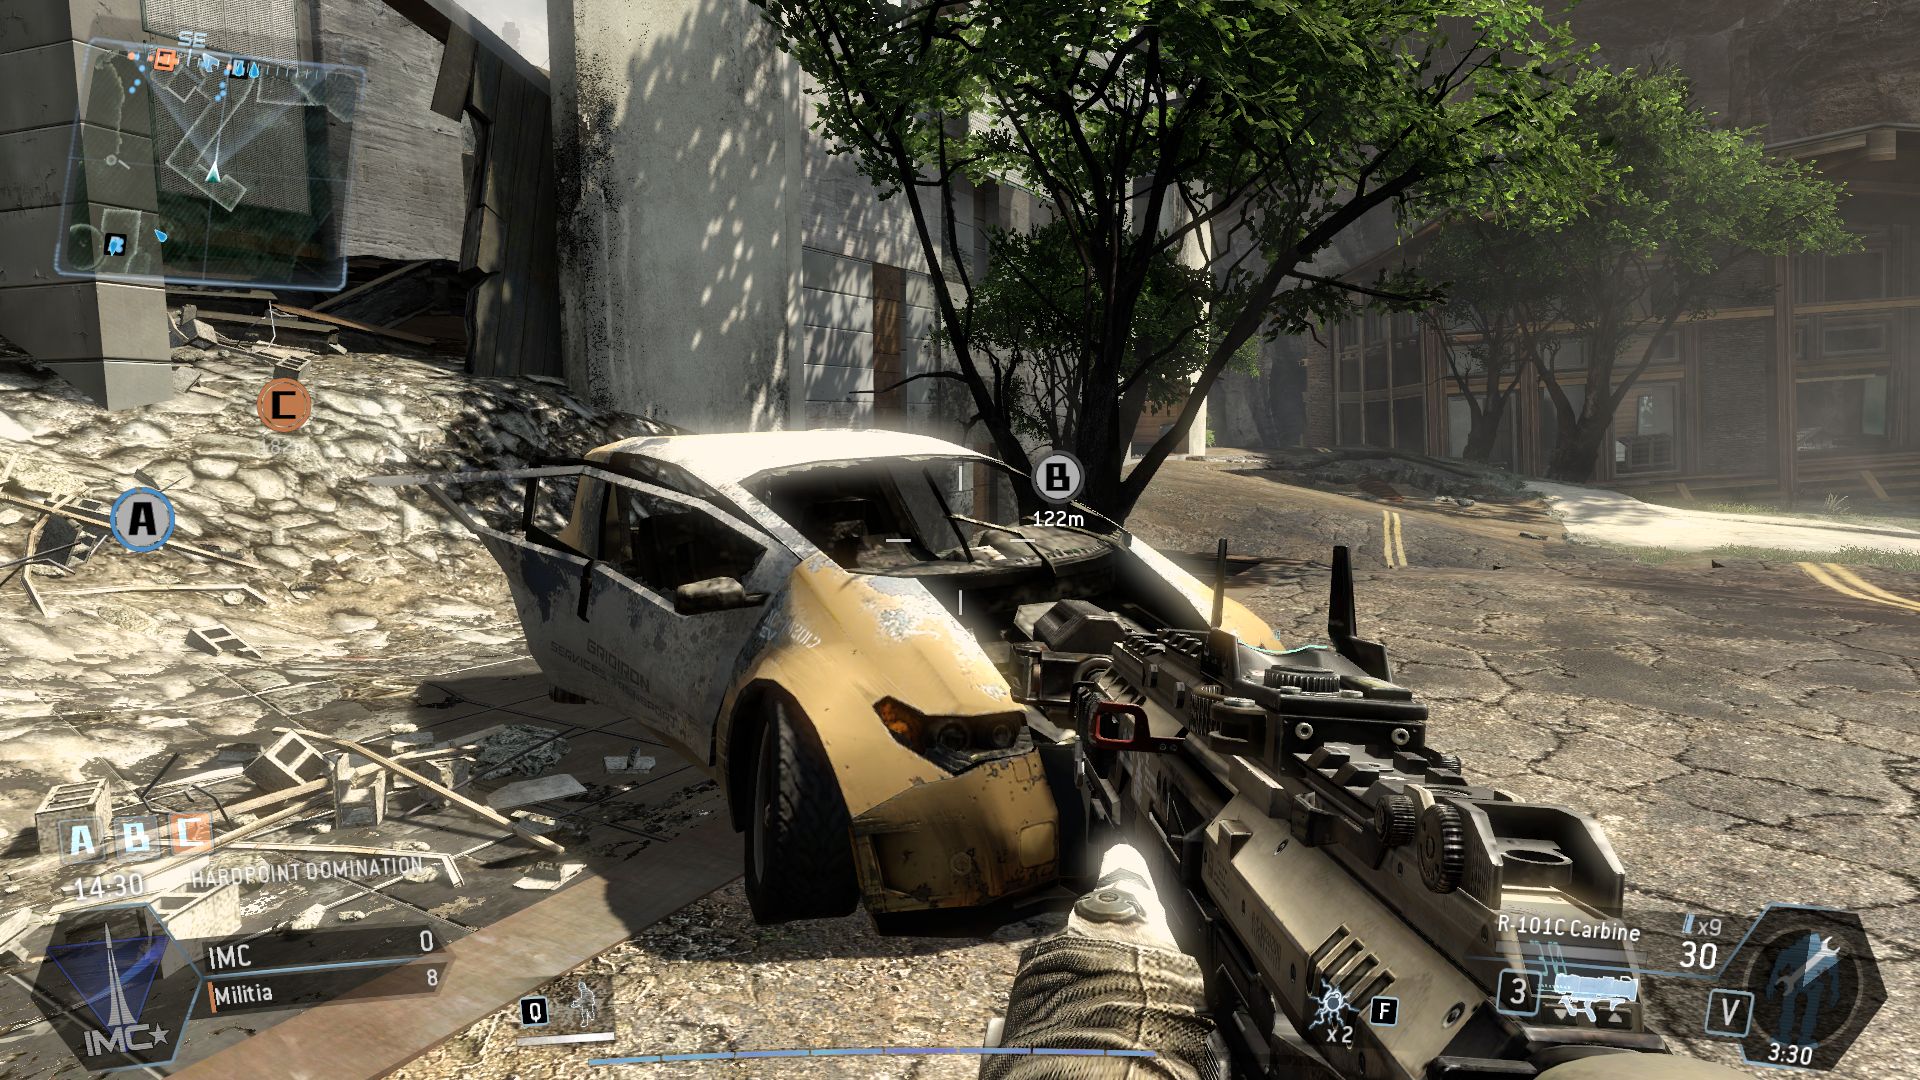
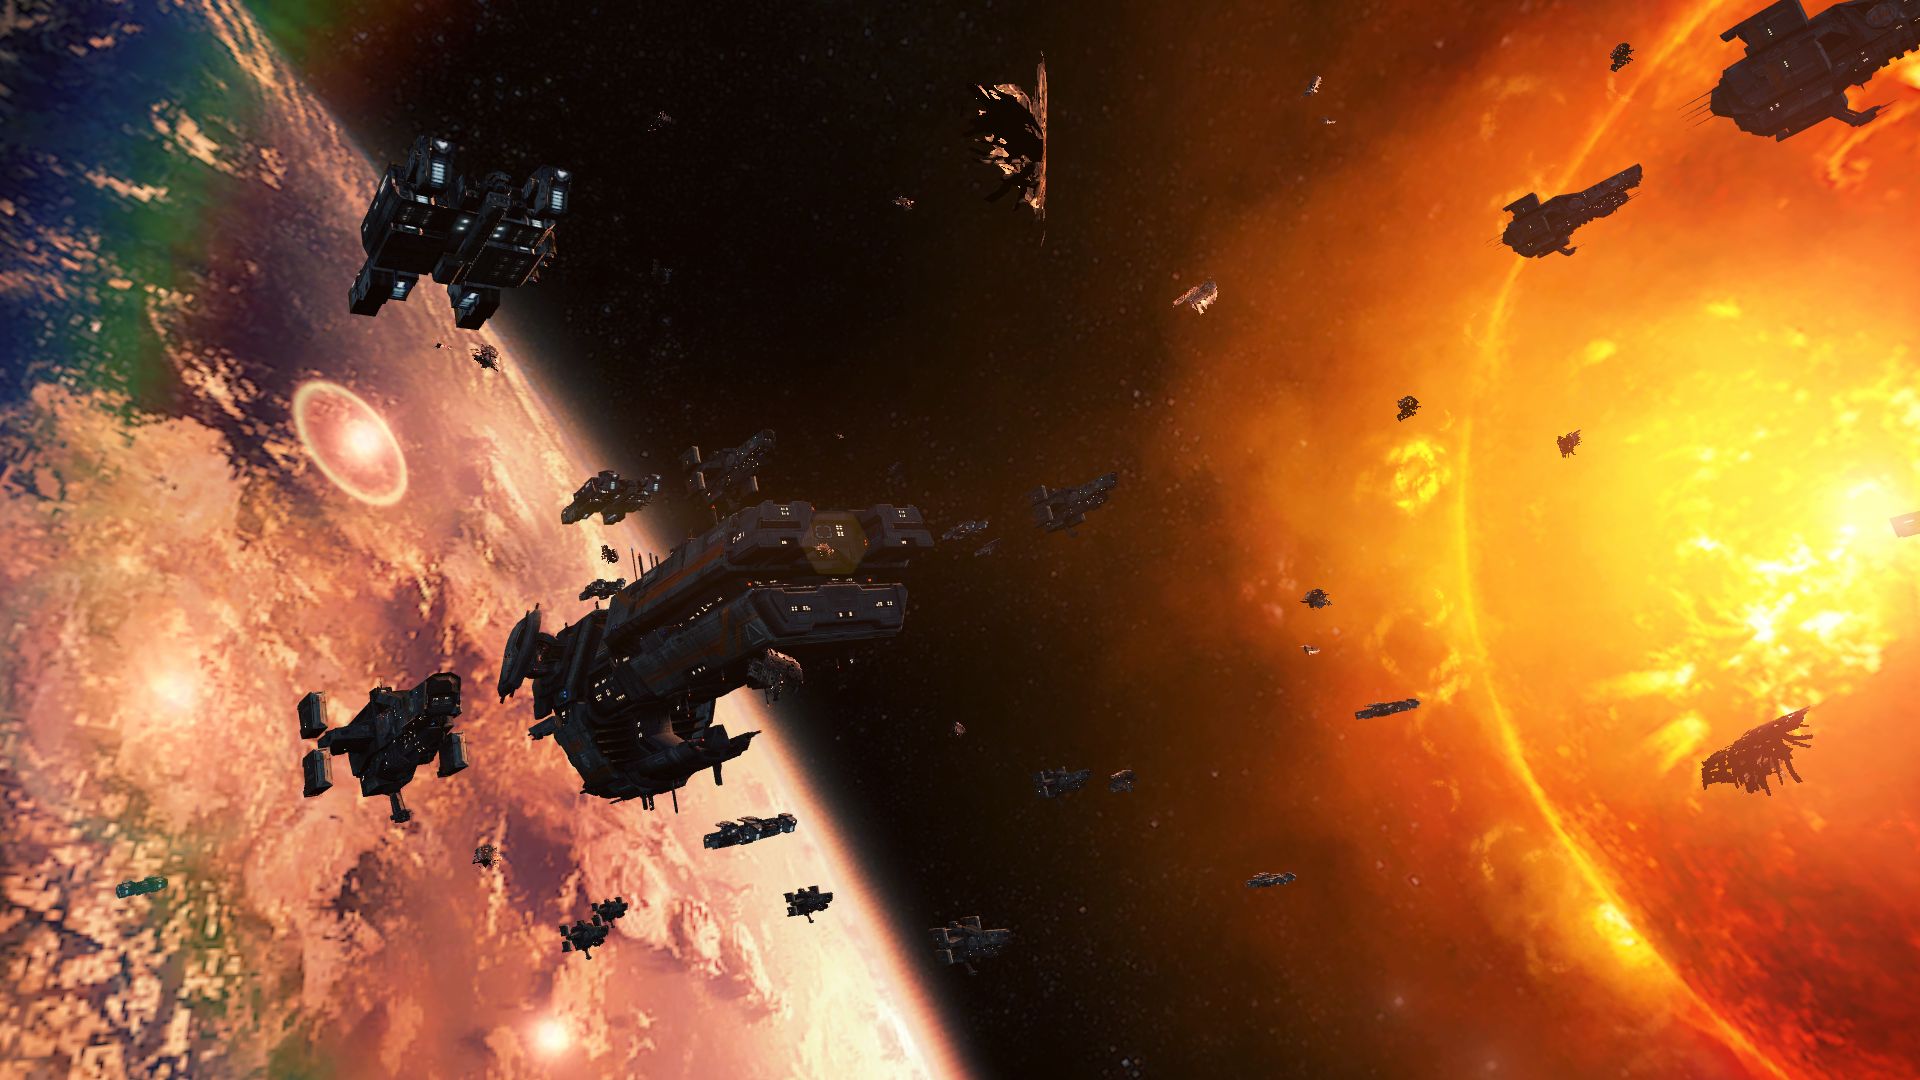
Passionate gamers waiting for a graphics bomb in the style of Battlefield 4 or Crysis 3 will not find what they are looking for in Titanfall. The source engine has been massively revamped in recent years and embellished with new features, but the graphics technology is still not really modern. For one thing, the texture quality does not meet 2014 standards: Most of the object wallpapers are too sludgy upon closer inspection.

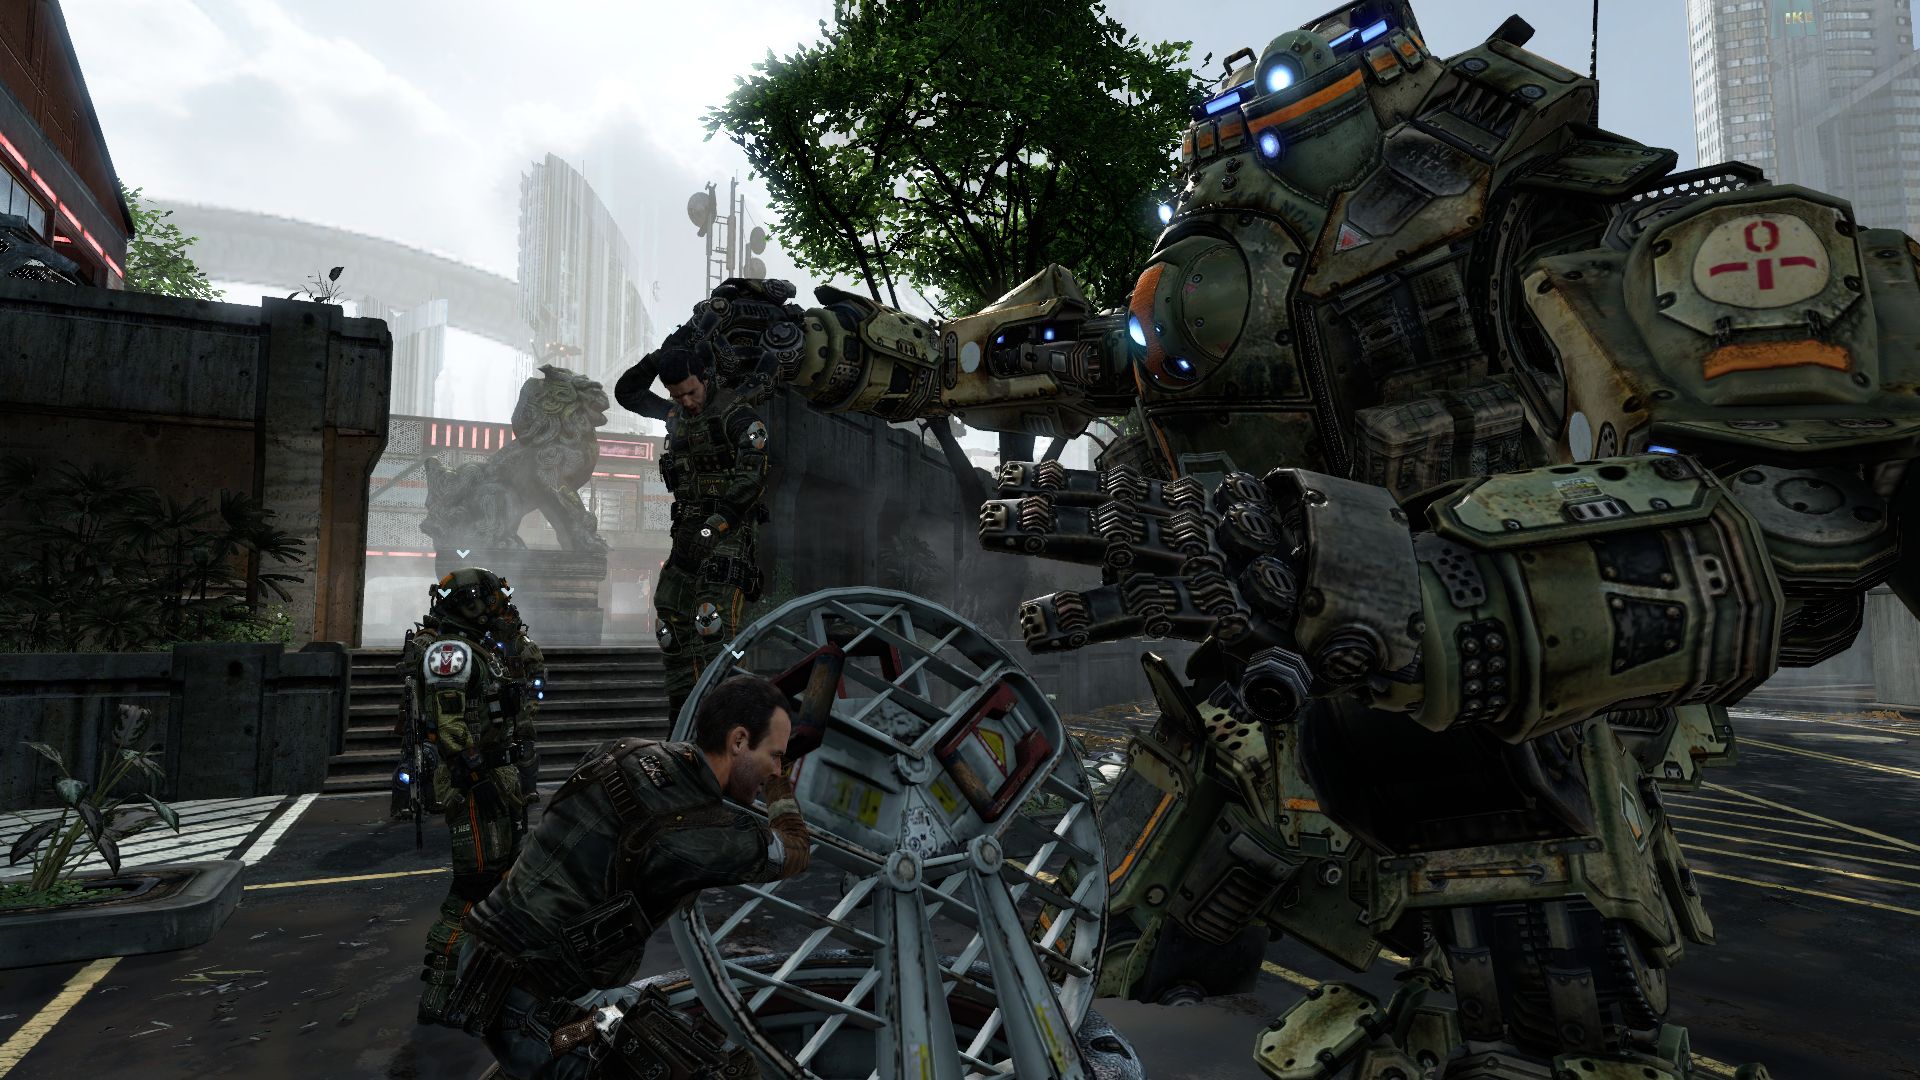
Another shortcoming is the lack of a detailed physics and destruction system. Yes, in some scenes the screen is bursting with effects and explosions, but you will not see any crumbling walls or collapsing houses. Considering this, it is even more surprising to us that Titanfall takes up 50 GB worth of hard drive space. Even Battlefield 4 only occupies about 25 GB at the moment (Crysis 3: ~14 GB).

Titanfall
Titanfall
Titanfall
Titanfall
Titanfall
Titanfall

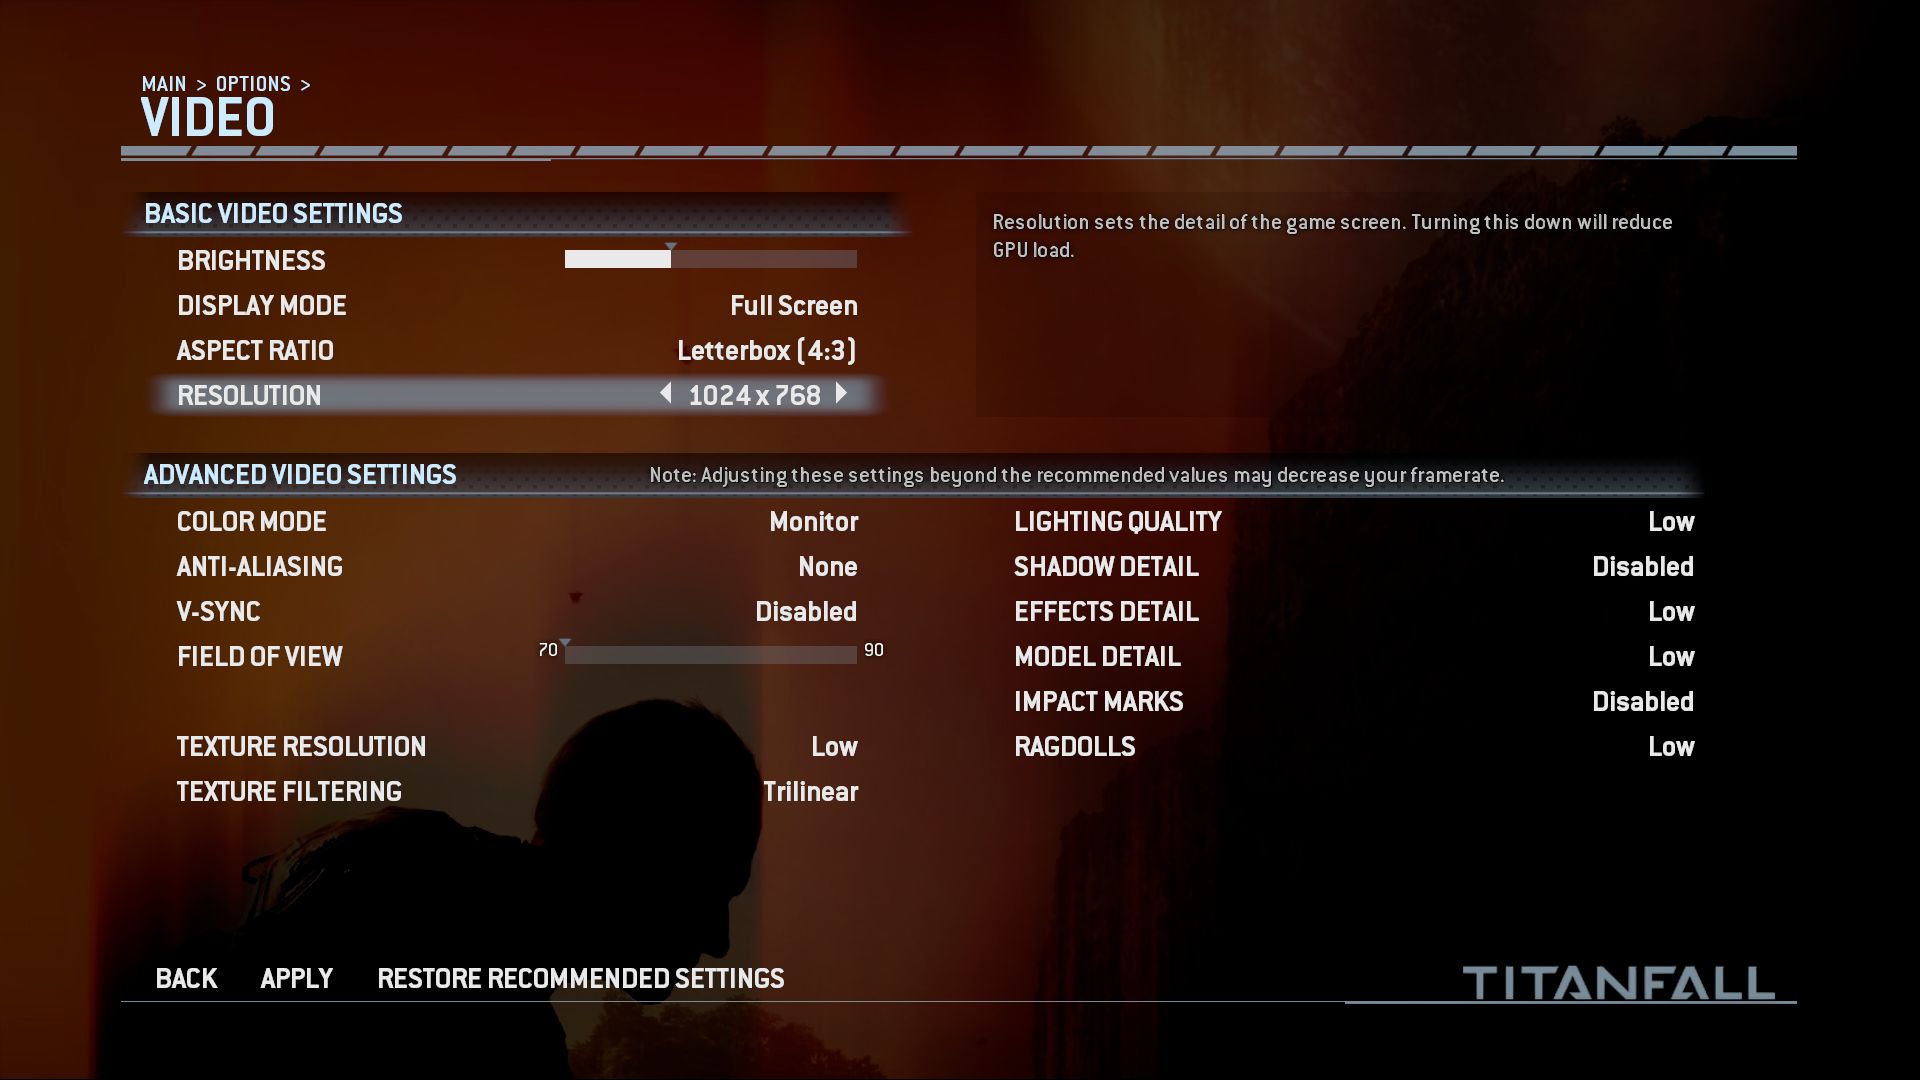
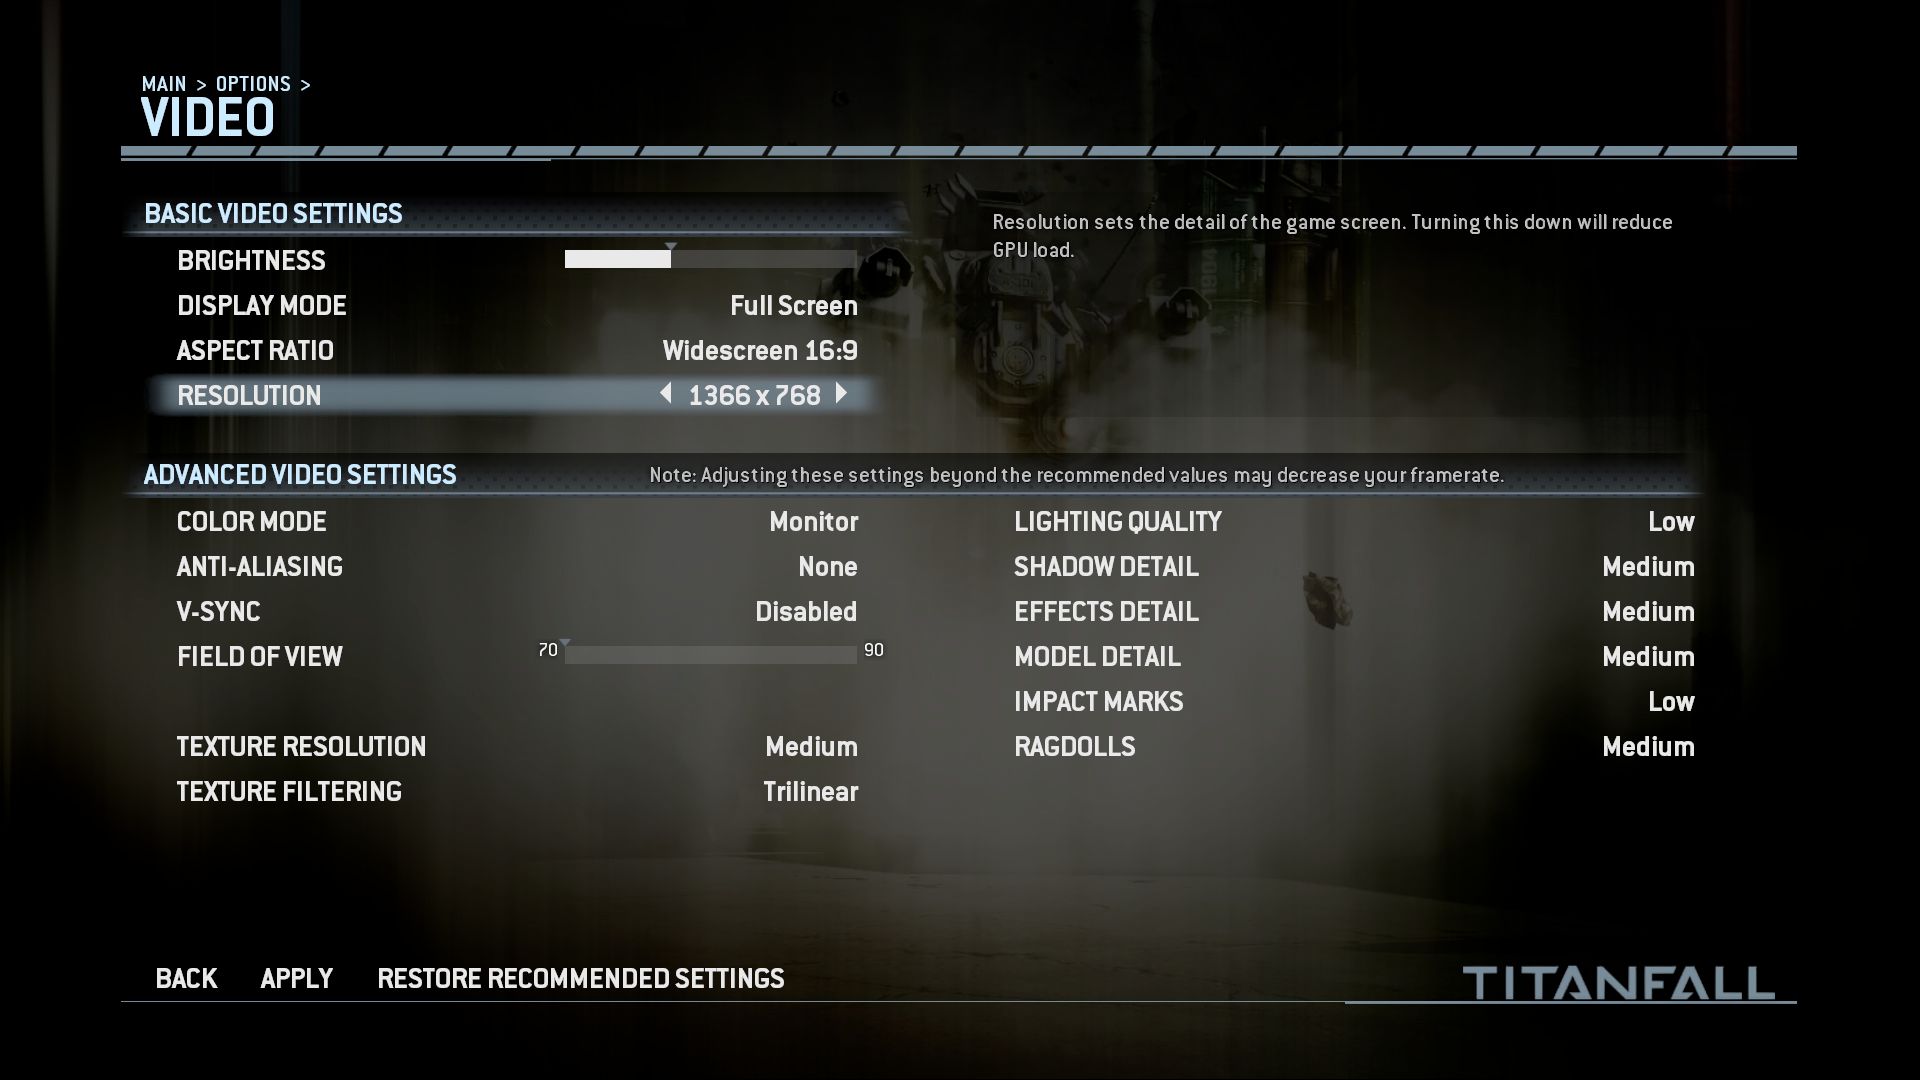
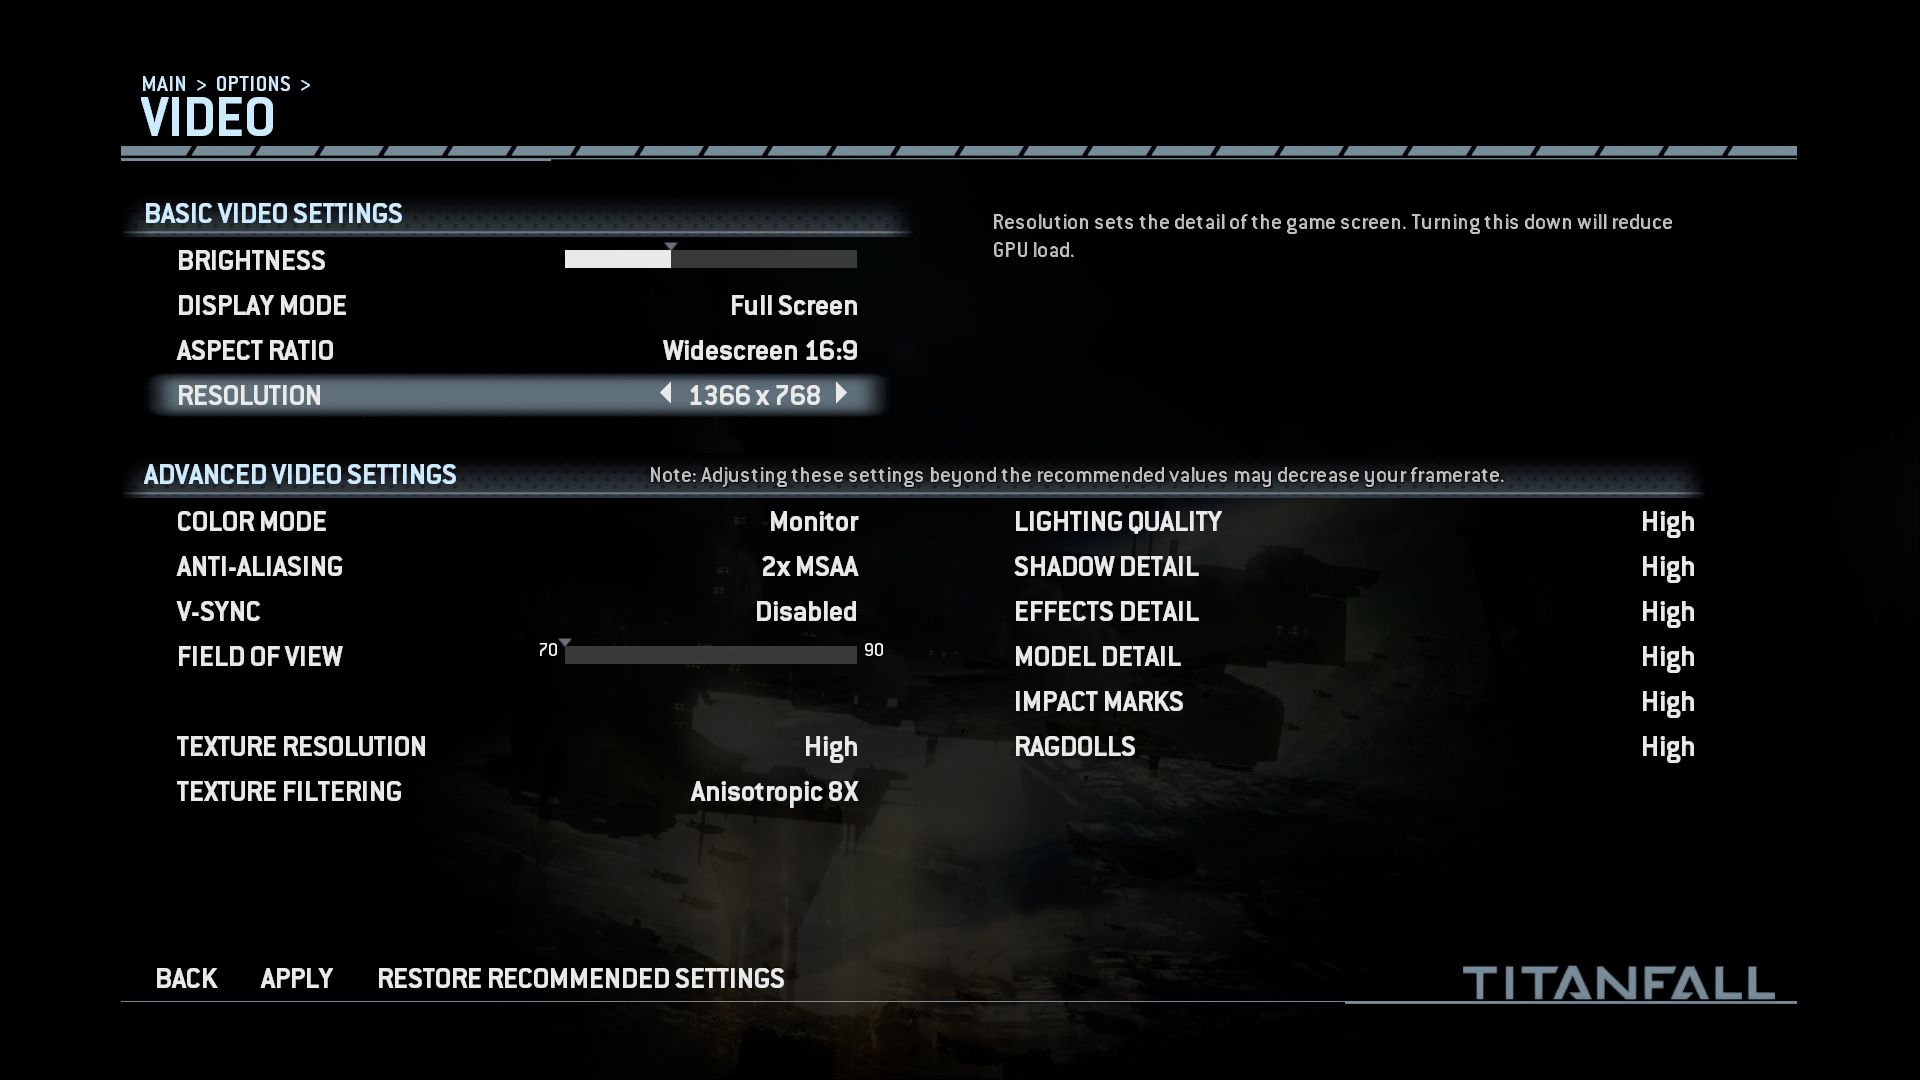
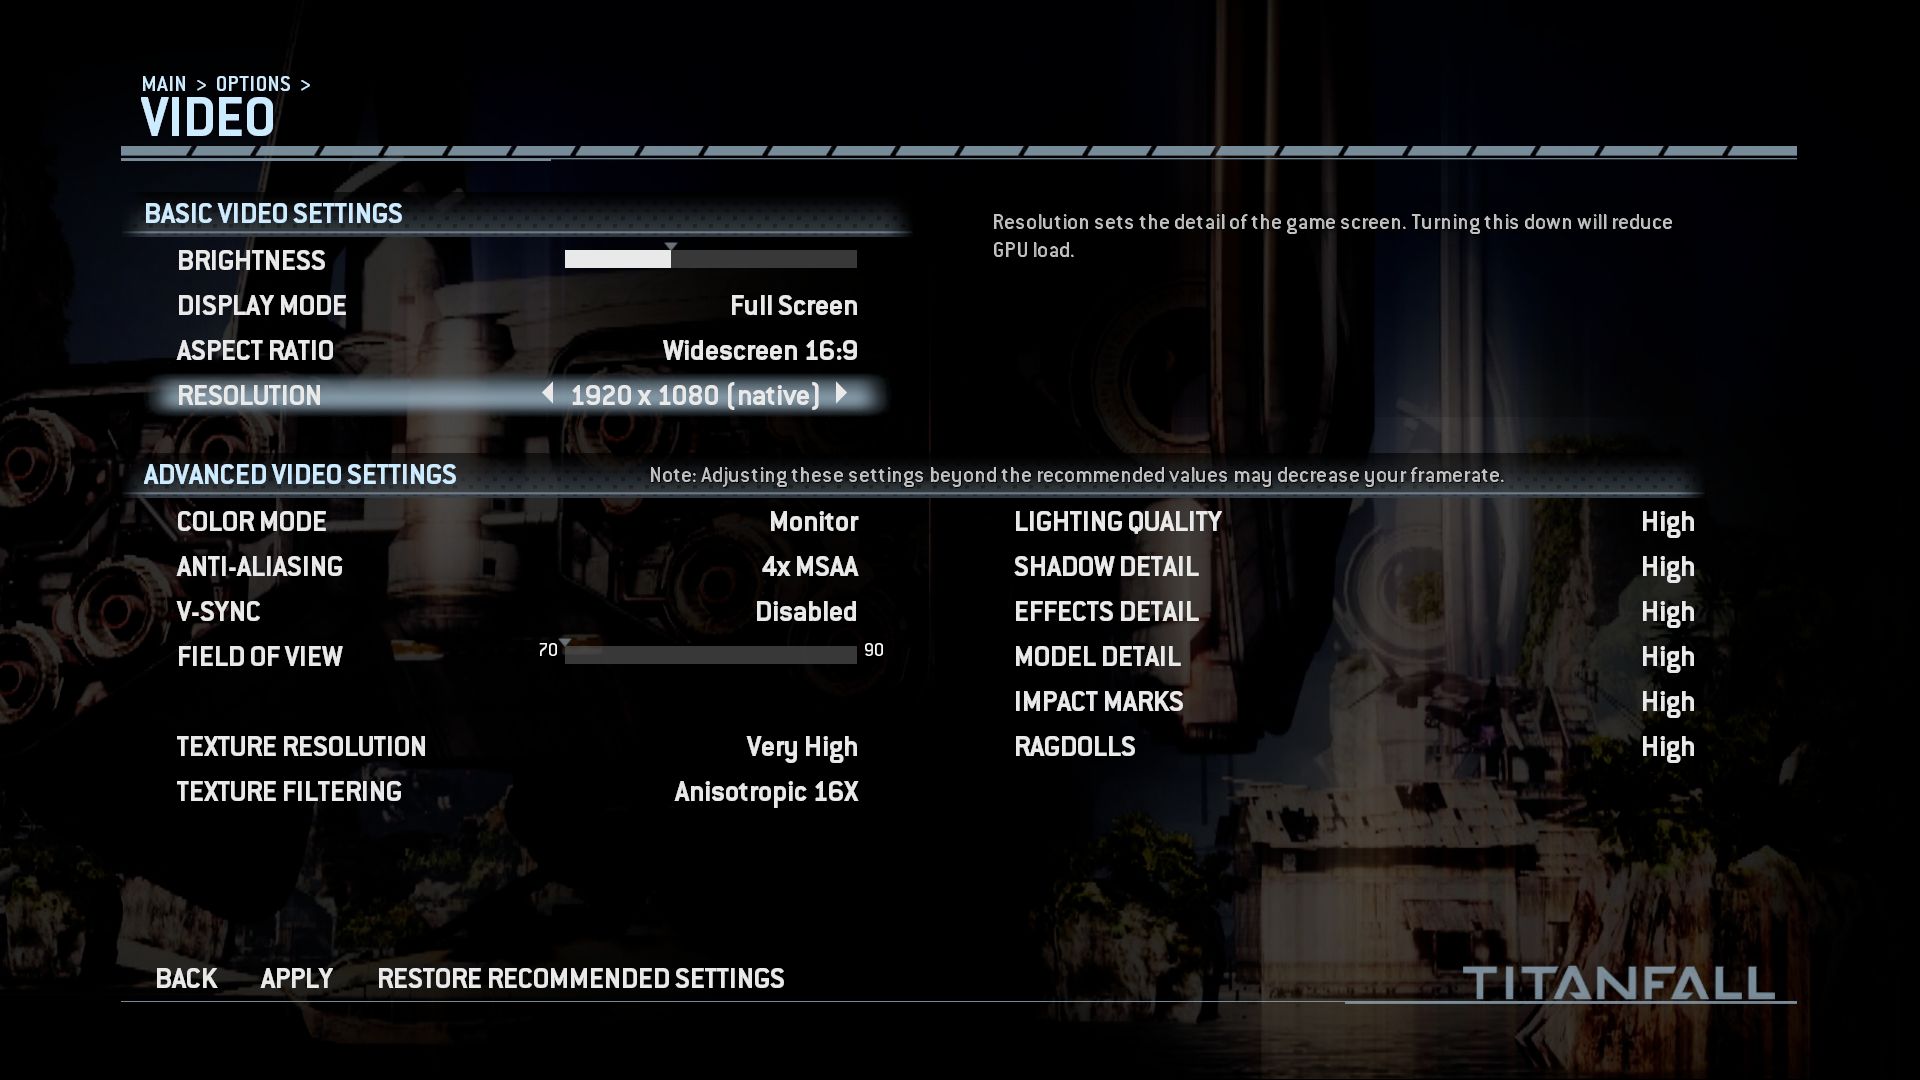
However, we do want to praise the developers for the easy-to-use, well-designed menus, though some of the graphics settings can only be altered in the main menu, not during a running match. That includes the resolution and texture quality. Speaking of textures: Because the maximum setting, "Insane," screams for a graphics card with at least 3 GB of VRAM, we chose not to use this level in our benchmarks and just stuck with Low, Medium, High and Very High.

Besides texture quality, the video menu offers a number of other options. Be it light, shadow, effect and model details, or bullet holes, or ragdoll physics, they are all there. The brightness, picture mode, aspect ratio and field of vision can be adjusted as well. Thanks to the integrated anti-aliasing and anisotropic filtering, far-away objects still appear relatively sharp and without jagged edges. V-Sync, which prevents bothersome screen tearing, was deactivated for our benchmarks.

Unfortunately, the maximum refresh rate aligns with the frequency of the monitor. While 120 Hz panels cannot display more than 120 frames per second, an ordinary 60 Hz monitor, like you find in more devices, will not exceed 60 fps. It may not be the best etiquette, but due to this issue we only tested our graphics cards in each setting if they did not hit this limit. For example, if model xy reached 59 fps on the High setting, we simply recorded 60 fps for Medium and Low.

Low Settings
Low Settings
Medium Settings
Medium Settings
High Settings
High Settings
Ultra Settings
Ultra Settings
Low Settings
Low Settings
Medium Settings
Medium Settings
High Settings
High Settings
Ultra Settings
Ultra Settings

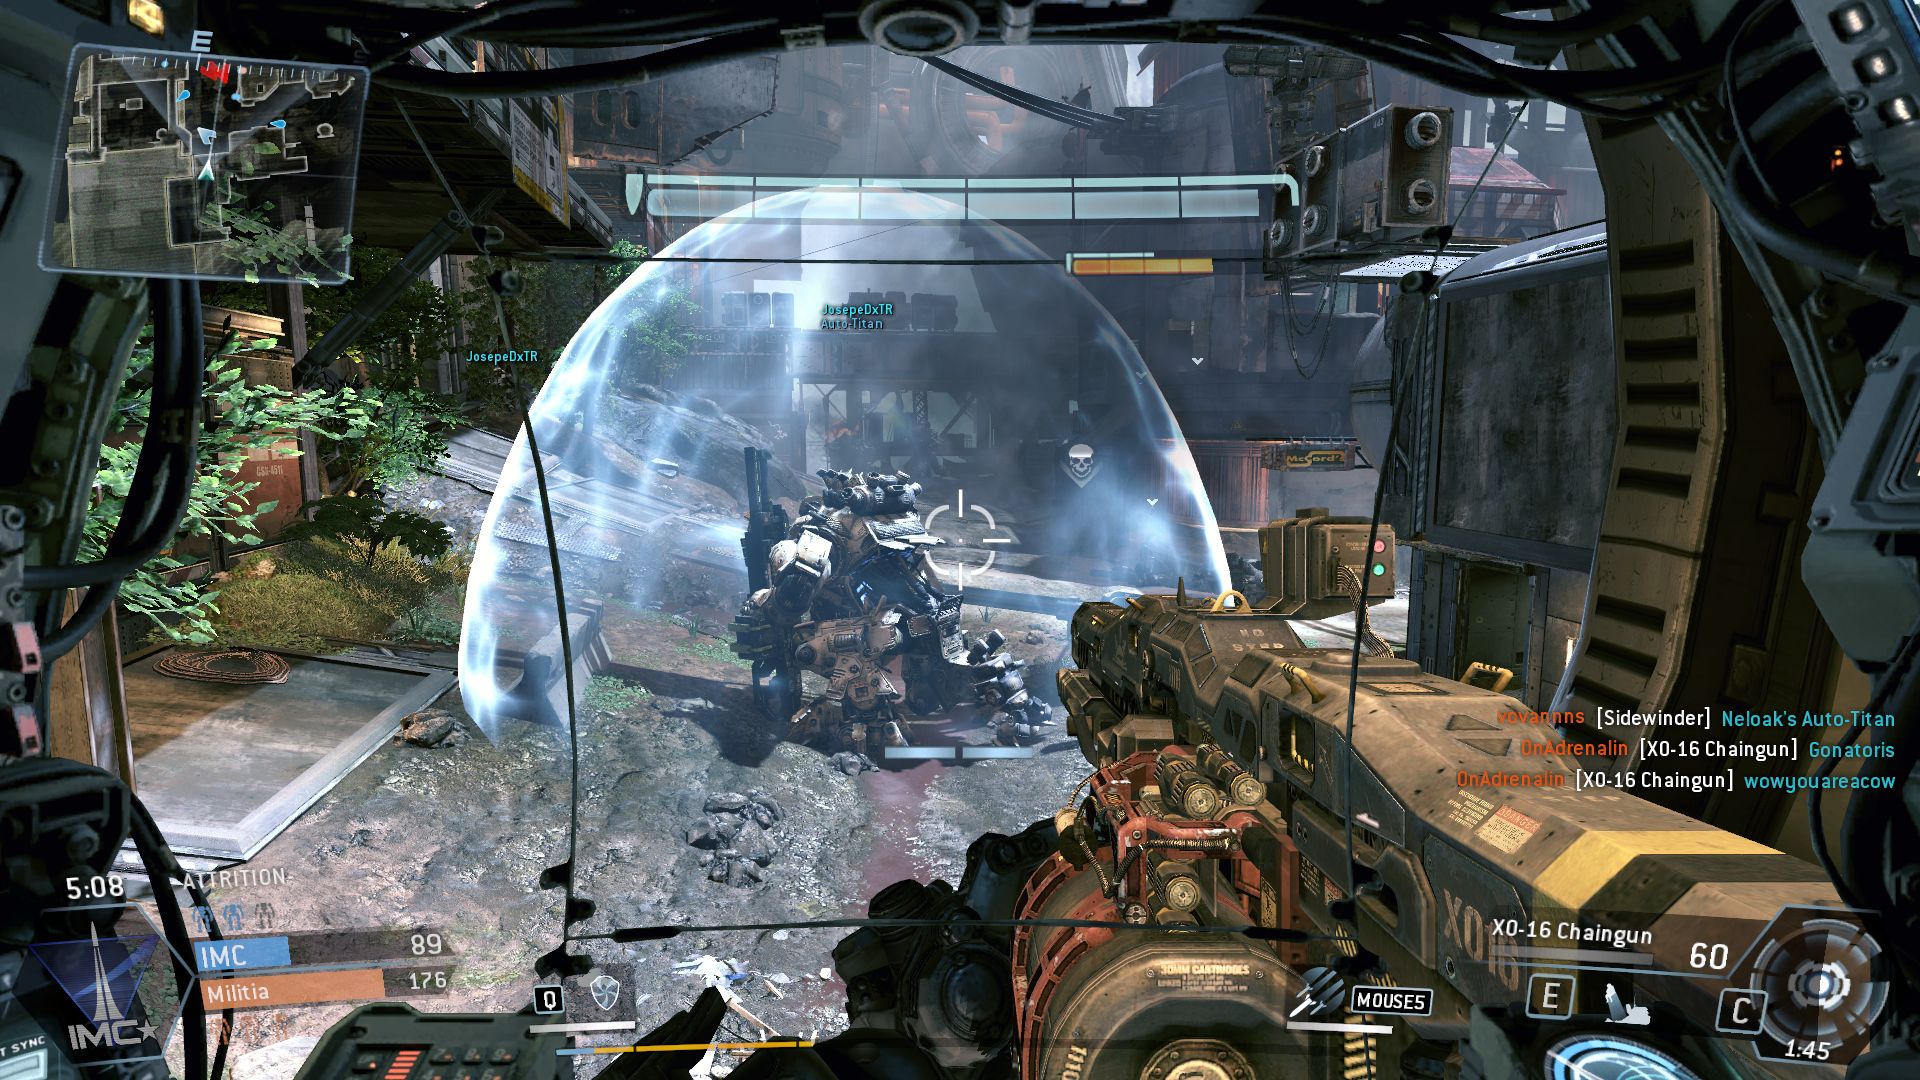
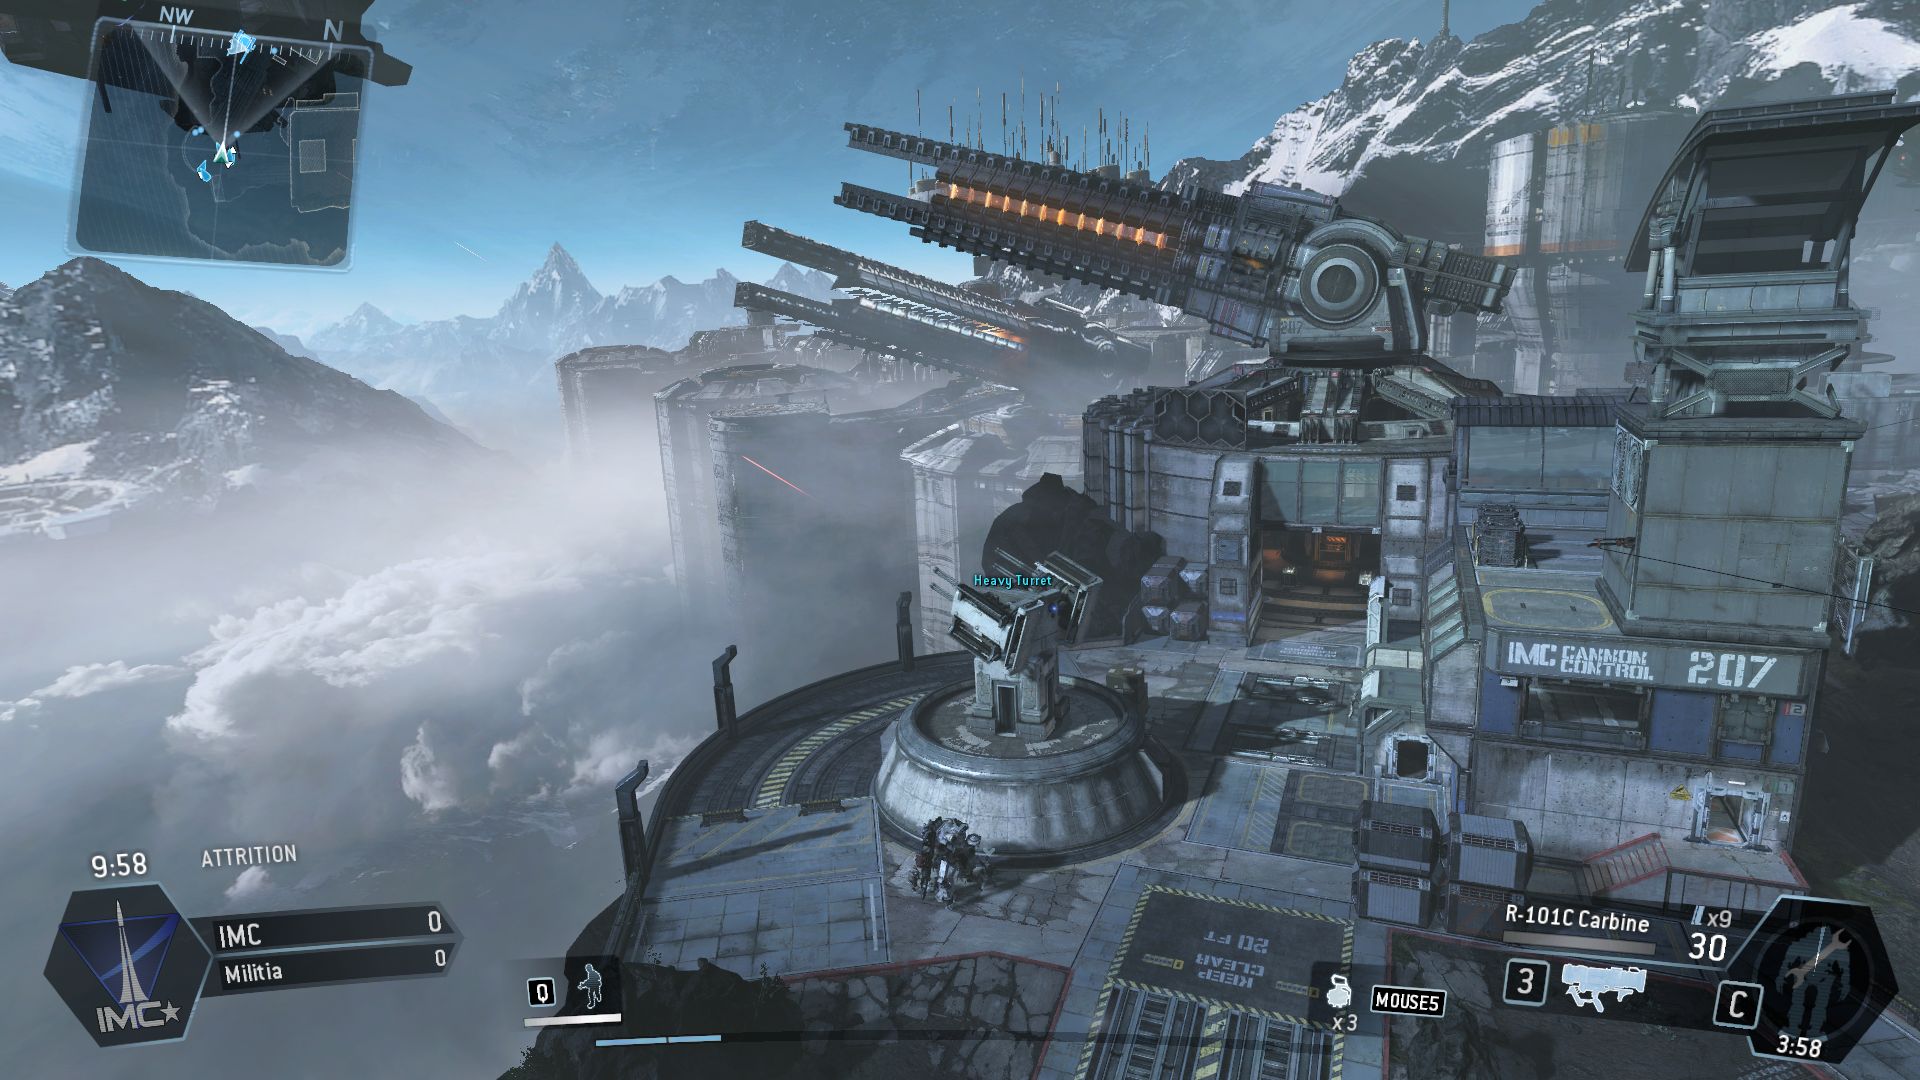
In terms of the feel of the game, Titanfall is quite enjoyable. Despite some deficits in atmosphere due to the antiquated graphics technology, the roaring battles are staged in a way that is stylish and thrilling. The fast game tempo paired with the uncomplicated controls and fresh gameplay ideas make for a very fun experience. At least for a few hours, anyway -- after a while the mechanics will get a little monotonous, whether or not there are new upgrades and improvements.

Whether you will be motivated to keep playing Titanfall for an extended period of time depends very much on your personal preferences. In the end, like with most multiplayer games, you just find yourself fighting your way through masses of opponents. But as an uncompromising action-shooter game to play every now and then, Titanfall is exactly what it should be. The fluid and very comfortable controls and the crisp sounds are huge contributors here.

Titanfall
Titanfall
Titanfall

Benchmark

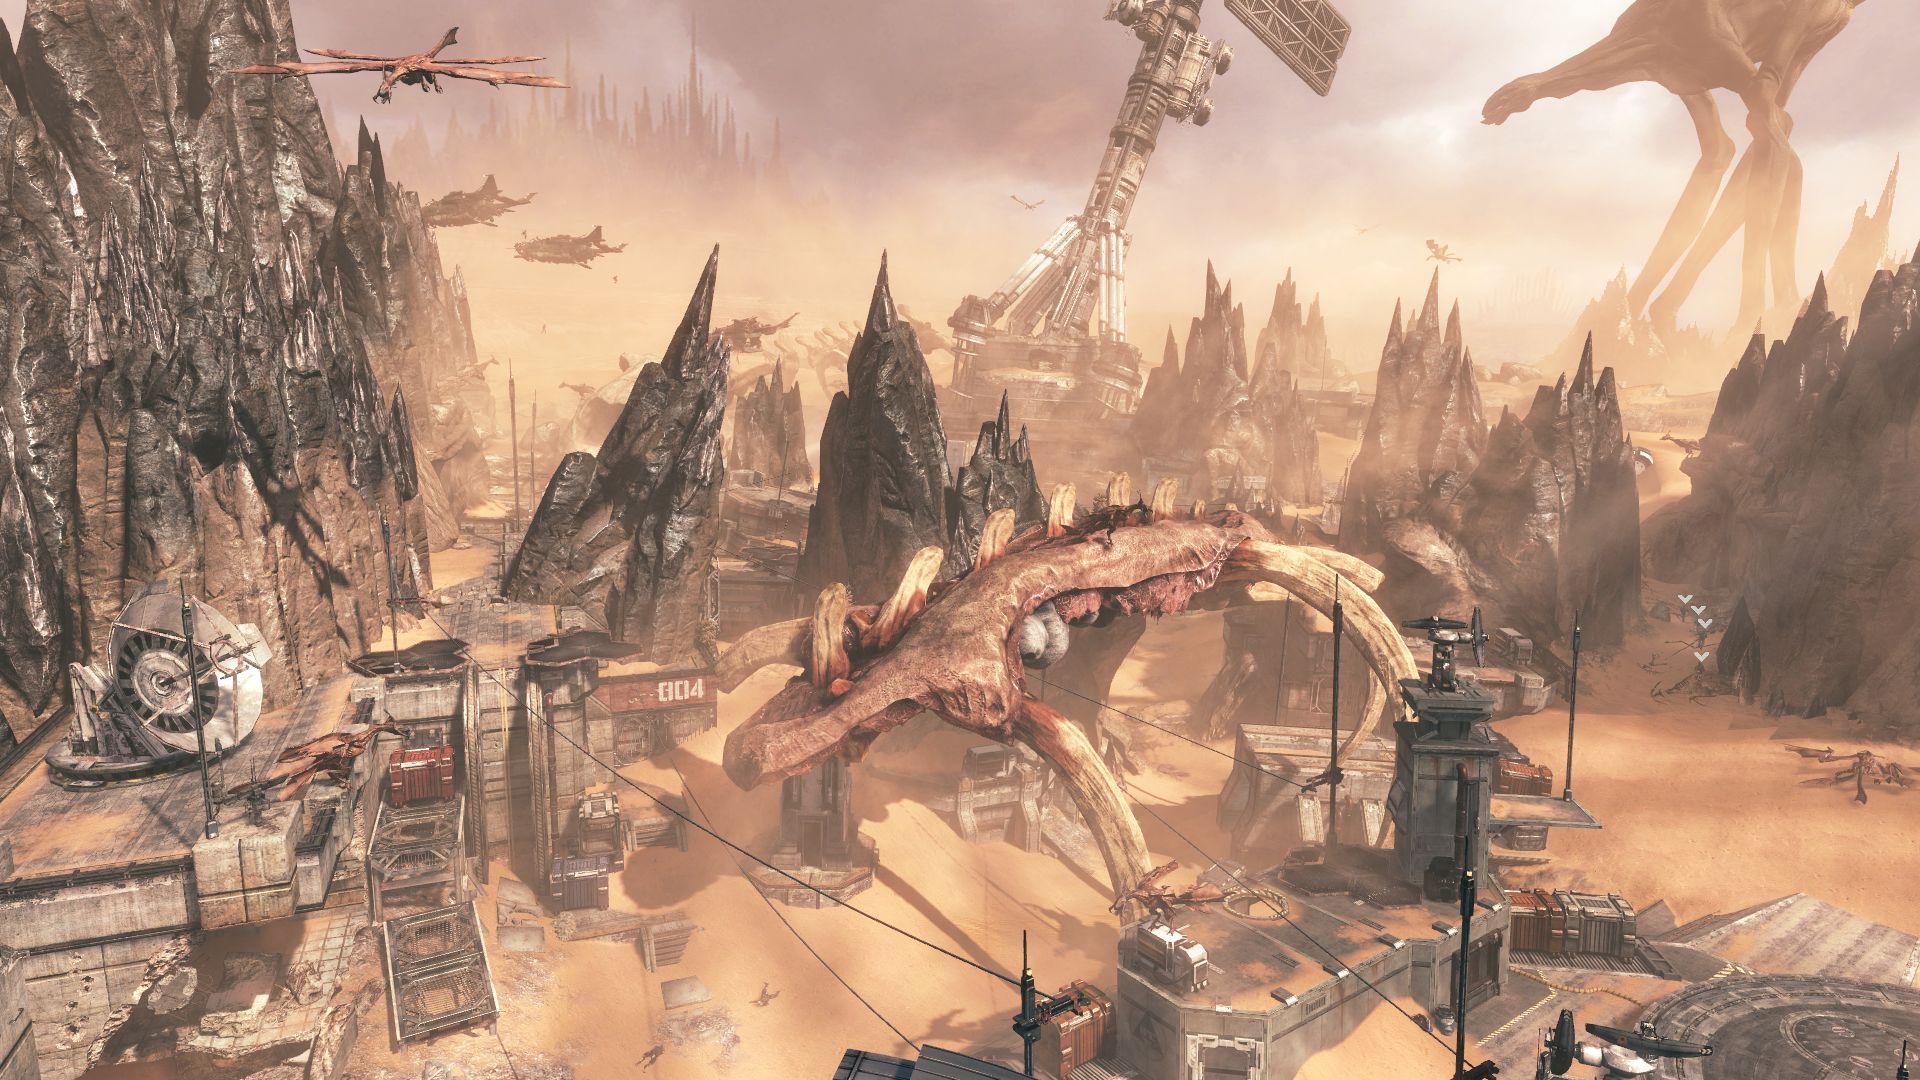
Multiplayer titles that do not have an offline mode are not particularly suited for benchmark testing. Because the title flows differently each time you play, and other factors influence the game as well (server quality, ping, etc.), there is a lot of unavoidable fluctuation. The task of finding a graphically demanding scene that is as comfortable as possible to benchmark AND offers consistent results is a hard one indeed.

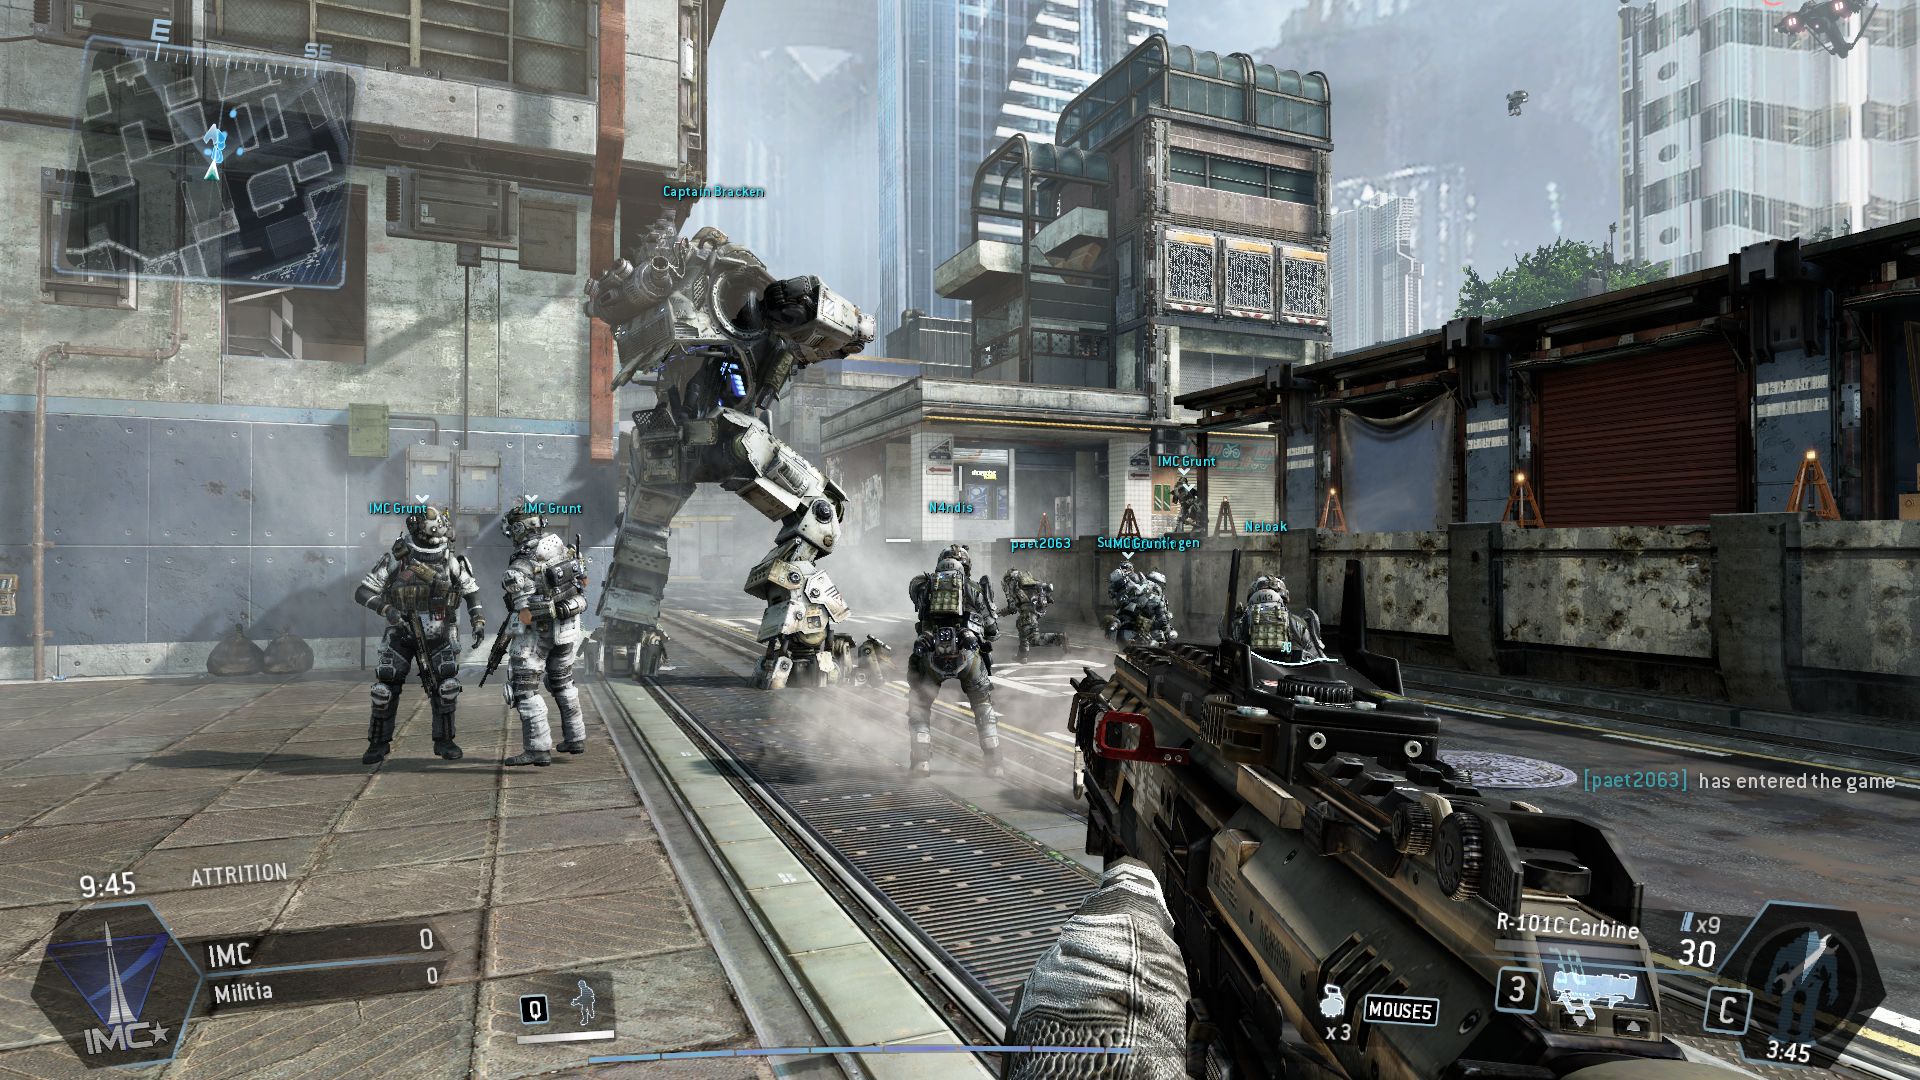
Although the tracking shots at the beginning of the campaign levels are not the perfect solution to our problem, we decided to use the start of "The Refueling Raid" mission (on the IMC side). As long as our character, directly upon exiting the helicopter, is sitting or standing with his gaze overlooking the battlefield (which is true in about two-thirds of our passes), the results do not differ massively. Only if the character is positioned at a wide angle, and the environment is no longer visible, does the performance sometimes increase. In such cases, we moved our head in the direction of the "action."

Since the frame rates often dropped by one-third or more in scenes that were heavy on effects (explosions, smoke, etc.), the average rate should be at least 30-35 fps. If the score is lower, Titanfall jerks too much in some levels/passages.

Results

How hardware-hungry is Titanfall? The game actually proves to be quite frugal. If you want to play the action title at 1920x1080 pixels, very high details and 4x MSAA, you will have to have a high-end GPU installed in your computer, but a GeForce GTX 765M already climbs over the 35 fps line.

For high graphics settings, 1366x768 pixels and 2x anti-aliasing, you will need at least a card from the upper middle class (ex. the GeForce GT 750M). Typical all-round GPUs, like the GeForce GT 740M, can still run the game at normal settings if the AA option is deactivated. Entry-level chips on the level of the Intel HD Graphics 4600, however, can only handle low resolution and details.

The GeForce GTX 860M's relatively bad score (Ultra, see table) can probably be explained by the driver. While the notebooks we have on long-term loan run with the absolute most current driver Nvidia recommends (ForceWare 335.23), the XMG P304 had to make do with the somewhat older version 332.35 in our review. Hence: To keep your card at its maximum performance, be sure to update your driver.

The driver is also important for the Intel HD Graphics 4000, which only functioned properly with the brand new beta version 10.18.10.3496 ("properly," that is, if you overlook the lousy performance). The official but now somewhat antiquated driver, version 10.18.10.3412, produced massive graphics errors.

Considering the fps limits, the huge file size and the large time commitment, Titanfall certainly will not become part of our "standard parkour." Best not expect too many benchmarks to come for this title.

Titanfall
    1920x1080 (Very) High AA:4xMS AF:16x     1366x768 High AA:2xMS AF:8x     1366x768 Medium/Low     1024x768 Low/Disabled
Radeon R9 280X, 3770K
Desktop-PC
59.9 (0min) fps ∼98%
60 (0min) fps ∼100%
60 (0min) fps ∼100%
60 (0min) fps ∼97%
GeForce GTX 660 Ti, 3770K
Desktop-PC
59.5 (0min) fps ∼98%
60 (0min) fps ∼100%
60 (0min) fps ∼100%
60 (0min) fps ∼97%
GeForce GTX 780M, 4700MQ
Schenker W503
59.1 (0min) fps ∼97%
60 (0min) fps ∼100%
60 (0min) fps ∼100%
60 (0min) fps ∼97%
Radeon HD 8970M, 4700MQ
Schenker W503
59.1 (0min) fps ∼97%
60 (0min) fps ∼100%
60 (0min) fps ∼100%
60 (0min) fps ∼97%
Radeon R9 M290X, 4700MQ, Samsung SSD 840 EVO 500GB
One K56-4N
58.9 (0min) fps ∼97%
60 (0min) fps ∼100%
60 (0min) fps ∼100%
60 (0min) fps ∼97%
Radeon HD 7970M, 3610QM
Schenker XMG P502
58.3 (0min) fps ∼96%
59.7 (0min) fps ∼100%
60 (0min) fps ∼100%
60 (0min) fps ∼97%
GeForce GTX 680M, 3610QM
Schenker XMG P502
53.9 (0min) fps ∼88%
59.8 (0min) fps ∼100%
60 (0min) fps ∼100%
60 (0min) fps ∼97%
GeForce GTX 770M, 4700MQ
Schenker W503
48.3 (0min) fps ∼79%
59.3 (0min) fps ∼99%
60 (0min) fps ∼100%
60 (0min) fps ∼97%
GeForce GTX 860M, 4810MQ, Crucial M500 240 GB CT240M500SSD3 mSATA
SCHENKER XMG P304
42.4 (0min) fps ∼70%
59.7 (0min) fps ∼100%
60 (0min) fps ∼100%
60 (0min) fps ∼97%
GeForce GTX 675MX, 3610QM
Schenker XMG P502
39.7 (0min) fps ∼65%
52.1 (0min) fps ∼87%
59 (0min) fps ∼98%
60 (0min) fps ∼97%
GeForce GTX 765M, 4700MQ
Schenker W503
35.6 (0min) fps ∼58%
54.3 (0min) fps ∼91%
59.7 (0min) fps ∼100%
60 (0min) fps ∼97%
GeForce GTX 670MX, 3610QM
Schenker XMG P502
35.3 (0min) fps ∼58%
48.1 (0min) fps ∼80%
57.8 (0min) fps ∼96%
60 (0min) fps ∼97%
GeForce GTX 660M, 3610QM
Schenker XMG P502
20.8 (0min) fps ∼34%
39.4 (0min) fps ∼66%
49.3 (0min) fps ∼82%
60 (0min) fps ∼97%
GeForce GT 750M, 4702MQ
Schenker M503
18.5 (0min) fps ∼30%
33.3 (0min) fps ∼56%
42.1 (0min) fps ∼70%
59.9 (0min) fps ∼97%
Iris Pro Graphics 5200, 4750HQ, Intel SSD 525 Series SSDMCEAC180B3
SCHENKER S413
14.8 (9min) fps ∼24%
24.7 (17min) fps ∼41%
37.1 (25min) fps ∼62%
57.1 (39min) fps ∼92%
GeForce GT 740M, 4200M
HP Envy 15-j011sg
13.4 (0min) fps ∼22%
27.3 (0min) fps ∼46%
36.9 (0min) fps ∼62%
59.2 (0min) fps ∼95%
HD Graphics 4600, 4700MQ
Schenker W503
9.1 (0min) fps ∼15%
14.4 (0min) fps ∼24%
23.3 (0min) fps ∼39%
46.4 (0min) fps ∼75%
HD Graphics 4000, 3610QM
Schenker XMG P502
4.9 (0min) fps ∼8%
6.7 (0min) fps ∼11%
10.9 (0min) fps ∼18%
20.4 (0min) fps ∼33%

Test Systems

Three of our test devices are courtesy of Schenker Technologies (mysn.de):

  • W503 (Core i7-4700MQ, 8 GB DDR3, GeForce GTX 765M, GTX 770M, GTX 780M, Radeon HD 8970M & HD Graphics 4600)
  • M503 (Core i7-4702MQ, 8 GB DDR3, GeForce GT 750M & HD Graphics 4600)
  • XMG P502 (Core i7-3610QM, 8 GB DDR3, GeForce GTX 660M, GTX 670MX, GTX 675MX, GTX 680M, Radeon HD 7970M & HD Graphics 4000)

The 64-bit edition of Windows 7 is installed on each of these devices. A further thank you goes to Micron for the 480 GB Crucial M500.

Another test device is courtesy of Nvidia:

  • HP Envy 15-j011sg (Core i5-4200M, 12 GB DDR3, GeForce GT 740M & HD Graphics 4600)

GPU drivers used: Nvidia 335.23, AMD 14.2 Beta 1.3, Intel 10.18.10.3464 (10.18.10.3496 @ HD 4000)

We have also included benchmarks from other notebooks (perhaps with different drivers).

From left to right: Schenker M503, XMG P502 & W503
HP Envy 15-j011sg
HP Envy 15-j011sg

Overview

Show Restrictions
PosModel< PrevNext >Titanfall
 Titanfall (2014)
low
1024x768
Low/Disabled
med.
1366x768
Medium/Low
high
1366x768
High
8xAF 2xMSAA
ultra
1920x1080
(Very) High
16xAF 4xMSAA
PosModel< PrevNext >Titanfall
low med. high ultra
PosModel< PrevNext >Titanfall
low med. high ultra
PosModel< PrevNext >Titanfall
low med. high ultra
PosModel< PrevNext >Titanfall
low med. high ultra
PosModel< PrevNext >Titanfall
low med. high ultra
PosModel< PrevNext >Titanfall
low med. high ultra
PosModel< PrevNext >Titanfall
low med. high ultra
PosModel< PrevNext >Titanfall
low med. high ultra
PosModel< PrevNext >Titanfall
low med. high ultra
PosModel< PrevNext >Titanfall
low med. high ultra
PosModel< PrevNext >Titanfall
low med. high ultra
PosModel< PrevNext >Titanfall
low med. high ultra
PosModel< PrevNext >Titanfall
low med. high ultra
PosModel< PrevNext >Titanfall
low med. high ultra
PosModel< PrevNext >Titanfall
low med. high ultra
PosModel< PrevNext >Titanfall
low med. high ultra
PosModel< PrevNext >Titanfall
low med. high ultra
PosModel< PrevNext >Titanfall
low med. high ultra
PosModel< PrevNext >Titanfall
low med. high ultra
PosModel< PrevNext >Titanfall
low med. high ultra
Qualcomm Adreno 205
AMD Radeon Pro 5500M
Qualcomm Adreno 203
AMD Radeon HD 6775G2
PosModel< PrevNext >Titanfall
low med. high ultra
AMD Radeon HD 6770M
AMD Radeon Graphics (Ryzen 9000)
AMD Radeon HD 6250
AMD Radeon 760M
AMD Radeon 680M
AMD Radeon HD 6755G2
NVIDIA GeForce GTX 980
NVIDIA RTX A4000 Laptop GPU
AMD Radeon HD 8970M Crossfire
AMD Radeon Pro 5300M
AMD Radeon HD 6630M
AMD Radeon Pro 455
AMD Radeon Pro 450
AMD Radeon HD 6640G2
AMD Radeon HD 6645G2
AMD Radeon HD 6450M
AMD Radeon 890M
AMD FirePro W5130M
AMD Radeon HD 7370M
AMD Radeon HD 7290
PosModel< PrevNext >Titanfall
low med. high ultra
AMD Radeon HD 7310
AMD Radeon HD 6990M Crossfire
AMD Radeon HD 6970M Crossfire
Intel Iris Pro Graphics 5200
57.1
37.1
24.7
14.8
NVIDIA GeForce GTX 980M
NVIDIA GeForce GTX 1070 (Desktop)
Intel UHD Graphics 615
NVIDIA GeForce 8800M GTX
NVIDIA Tegra X1 Maxwell GPU
Intel UHD Graphics 610
NVIDIA GeForce 8800M GTX SLI
Intel HD Graphics (Ivy Bridge)
NVIDIA GeForce GT 430
NVIDIA GeForce 8600M GS
NVIDIA GeForce GTX 980M SLI
NVIDIA Quadro T2000 (Laptop)
NVIDIA Quadro T1000 Max-Q
PosModel< PrevNext >Titanfall
low med. high ultra
NVIDIA Quadro T1000 (Laptop)
NVIDIA Quadro RTX 6000 (Laptop)
NVIDIA Quadro RTX 4000 Max-Q
PowerVR SGX531
NVIDIA GeForce GTX 860M
60n2
60n2
59.5n3
42.4n3
PowerVR GX6450
NVIDIA Quadro T2000 Max-Q
NVIDIA T600
PosModel< PrevNext >Titanfall
low med. high ultra
AMD Radeon HD 6680G2
Qualcomm Adreno 200
AMD Radeon HD 6370M
AMD Radeon HD 6450 GDDR5
AMD Radeon 880M
AMD Radeon 780M
AMD Radeon 630
AMD Radeon 625
AMD FirePro M8900
AMD FirePro W5170M
AMD Radeon 520
AMD Radeon HD 6620G
AMD Radeon HD 7470M
PosModel< PrevNext >Titanfall
low med. high ultra
AMD Radeon HD 6380G
AMD Radeon Graphics (Ryzen 7000)
AMD Radeon 740M
AMD FirePro W4190M
AMD Radeon 540X
NVIDIA GeForce GTX 870M
60
60
59.95n2
57.55n2
NVIDIA GeForce GT 425M
AMD Radeon PRO W6600M
PosModel< PrevNext >Titanfall
low med. high ultra
AMD Radeon HD 6520G
AMD Radeon HD 6520G + HD 7450M Dual Graphics
AMD Radeon HD 6830M
AMD Radeon HD 6515G2
AMD Radeon HD 7610M
AMD Radeon HD 6850M
AMD Radeon HD 7620G
PosModel< PrevNext >Titanfall
low med. high ultra
PosModel< PrevNext >Titanfall
low med. high ultra
AMD Radeon HD 6540G2
PosModel< PrevNext >Titanfall
low med. high ultra
NVIDIA T1200 Laptop GPU
NVIDIA GeForce 9100M G
NVIDIA GeForce GTX 1650 (Desktop)
NVIDIA Quadro P3000 Max-Q
AMD Radeon HD 6570M
AMD Radeon HD 6510G2
AMD Radeon HD 6530M
PosModel< PrevNext >Titanfall
low med. high ultra
PosModel< PrevNext >Titanfall
low med. high ultra
PosModel< PrevNext >Titanfall
low med. high ultra
PosModel< PrevNext >Titanfall
low med. high ultra
AMD Radeon Pro 460
NVIDIA GeForce Go 7200
AMD Radeon Pro 555
AMD Radeon Pro 555X
AMD Radeon Pro 560
AMD Radeon Pro 5600M
PosModel< PrevNext >Titanfall
low med. high ultra
AMD Radeon Pro Vega 20
AMD Radeon Pro Vega 56
NVIDIA GeForce GT 420M
AMD Radeon HD 6970M
AMD Radeon HD 6970
AMD Radeon HD 6870M
AMD Radeon HD 6870
AMD Radeon HD 6950M
ATI Radeon HD 4270
AMD Radeon HD 7650M
ATI Mobility Radeon X300
PosModel< PrevNext >Titanfall
low med. high ultra
ATI Radeon HD 5770
ATI Mobility Radeon X2500
ATI Radeon HD 5670
NVIDIA GeForce GT 415M
NVIDIA GeForce GT 335M
NVIDIA GeForce 8200M G
NVIDIA GeForce 7190M
NVIDIA Quadro NVS 140M
NVIDIA GeForce MX230
NVIDIA GeForce GT 330M
NVIDIA RTX 3000 Ada Generation Laptop GPU
NVIDIA GeForce 7150M
PosModel< PrevNext >Titanfall
low med. high ultra
NVIDIA GeForce GT 325M
NVIDIA GeForce GT 320M
NVIDIA GeForce 8600M GT SLI
NVIDIA GeForce GTX 880M
60
60
60
59.8
NVIDIA GeForce GT 540M
NVIDIA GeForce GT 720M
57
30.8
25.4
NVIDIA GeForce GT 710
NVIDIA GeForce GT 650M
NVIDIA GeForce GTX 970M
NVIDIA GeForce GT 650M SLI
NVIDIA Quadro P4000
NVIDIA GeForce GT 645M
NVIDIA Quadro P2000
AMD Radeon HD 6650M
AMD Radeon HD 6480G + HD 7450M Dual Graphics
AMD Radeon HD 6480G
PowerVR G6200
NVIDIA Quadro P600
PowerVR SGX545
PosModel< PrevNext >Titanfall
low med. high ultra
NVIDIA Quadro P620
NVIDIA T600 Laptop GPU
NVIDIA Quadro P5200
PosModel< PrevNext >Titanfall
low med. high ultra
PosModel< PrevNext >Titanfall
low med. high ultra
PowerVR GE8322 / IMG8322
PowerVR GE8320
PosModel< PrevNext >Titanfall
low med. high ultra
PosModel< PrevNext >Titanfall
low med. high ultra
PowerVR GE8100
PowerVR G6430
PowerVR SGX540
PosModel< PrevNext >Titanfall
low med. high ultra
PosModel< PrevNext >Titanfall
low med. high ultra
PosModel< PrevNext >Titanfall
low med. high ultra
AMD Radeon R5 M320
AMD Radeon HD 6490M
AMD Radeon HD 6430M
AMD Radeon HD 6720G2
AMD Radeon HD 6470M
PosModel< PrevNext >Titanfall
low med. high ultra
AMD Radeon 660M
AMD FirePro W4170M
AMD FirePro W2100
AMD Radeon HD 6320
AMD Radeon HD 6310
AMD Radeon HD 6290
AMD Radeon 620
AMD Radeon 610
AMD Radeon 610M
AMD FirePro W4100
AMD FirePro M5950
AMD FirePro M4000
AMD FirePro M6100
AMD FirePro M3900
AMD FirePro M4100
AMD Radeon 530
AMD FirePro M2000
AMD Radeon HD 6750M
PosModel< PrevNext >Titanfall
low med. high ultra
PosModel< PrevNext >Titanfall
low med. high ultra
PosModel< PrevNext >Titanfall
low med. high ultra
PosModel< PrevNext >Titanfall
low med. high ultra
AMD Radeon HD 6760G2
AMD FirePro M6000
PosModel< PrevNext >Titanfall
low med. high ultra
AMD Radeon Pro Vega 16
NVIDIA RTX A1000 Laptop GPU
AMD FirePro M5100
NVIDIA GeForce GTX 965M
AMD Radeon HD 6620G + HD 7670M Dual Graphics
AMD Radeon HD 6740G2
NVIDIA GeForce 8600M GT
ATI Radeon HD 5570
NVIDIA GeForce GTX 970
NVIDIA Quadro P1000
AMD Radeon Pro 560X
NVIDIA GeForce GTX 965M SLI
AMD Radeon HD 6790
AMD FirePro W7170M
PosModel< PrevNext >Titanfall
low med. high ultra
PosModel< PrevNext >Titanfall
low med. high ultra
AMD Radeon HD 6350M
AMD Radeon HD 6330M
AMD Radeon R5 M420
AMD Radeon R5 M335
AMD Radeon HD 6990M
NVIDIA GeForce GTX 950M
NVIDIA GeForce GTX 950
AMD Radeon HD 6550M
AMD Radeon R5 M315
PosModel< PrevNext >Titanfall
low med. high ultra
PosModel< PrevNext >Titanfall
low med. high ultra
PosModel< PrevNext >Titanfall
low med. high ultra
PosModel< PrevNext >Titanfall
low med. high ultra
PosModel< PrevNext >Titanfall
low med. high ultra
PosModel< PrevNext >Titanfall
low med. high ultra
PosModel< PrevNext >Titanfall
low med. high ultra
AMD Radeon HD 8870M
AMD Radeon R5 M330
NVIDIA Quadro NVS 120M
AMD Radeon HD 8850M
60
49.9
38.7
24.9
PowerVR SGX543MP3
AMD Radeon HD 8830M
AMD Radeon HD 6620G + HD 7450M Dual Graphics
AMD Radeon HD 8970M
60
60
60
59.1
AMD Radeon HD 6550D
Intel Iris Plus Graphics G7 (Ice Lake 64 EU)
(-) * Smaller values are better. / n123 Number of benchmarks for this median value / * Approximate position


Legend
5Stutters – This game is very likely to stutter and have poor frame rates. Based on all known benchmarks using the specified graphical settings, average frame rates are expected to fall below 25fps
May Stutter – This graphics card has not been explicitly tested on this game. Based on interpolated information from surrounding graphics cards of similar performance levels, stutters and poor frame rates are expected.
30Fluent – Based on all known benchmarks using the specified graphical settings, this game should run at or above 25fps
40Fluent – Based on all known benchmarks using the specified graphical settings, this game should run at or above 35fps
60Fluent – Based on all known benchmarks using the specified graphical settings, this game should run at or above 58fps
May Run Fluently – This graphics card has not been explicitly tested on this game. Based on interpolated information from surrounding graphics cards of similar performance levels, fluent frame rates are expected.
?Uncertain – This graphics card experienced unexpected performance issues during testing for this game. A slower card may be able to achieve better and more consistent frame rates than this particular GPU running the same benchmark scene.
Uncertain – This graphics card has not been explicitly tested on this game and no reliable interpolation can be made based on the performances of surrounding cards of the same class or family.
The value in the fields displays the average frame rate of all values in the database. Move your cursor over the value to see individual results.
Read all 2 comments / answer
static version load dynamic
Loading Comments
Comment on this article
Please share our article, every link counts!
Florian Glaser, 2014-03-21 (Update: 2021-05-18)