CheckMag | The great GPU slowdown

For decades, GPUs have revolutionized computing, driving incredible leaps in performance with each new generation. Yet, as the industry approaches the physical and financial limits of silicon manufacturing, these gains are slowing, forcing a shift in how performance is achieved and measured. Examining generational trends reveals this shift and underscores the need for new strategies to sustain innovation in GPU technology.
Let's take Nvidia’s evolution as an example. The RTX 20 series (Turing) introduced real-time ray tracing, a significant architectural milestone, while the RTX 30 series (Ampere) and RTX 40 series (Ada Lovelace) pushed computational power to new heights. However, the pace of performance growth has decelerated. Monthly gains dropped from ~2.68% during the RTX 20 to 30 transition to an estimated ~0.96% for the upcoming RTX 50 series. AMD’s story follows a similar pattern, with RDNA 2 (RX 6000 series) delivering a remarkable ~6.25% monthly improvement which RDNA 3 can not match at ~2.60%.

This decline is not due to a lack of ambition but the growing challenges of silicon scaling. Process nodes like 7nm and 4nm have unlocked extraordinary capabilities, but further miniaturization faces steep technical and financial barriers. The era of exponential raw hardware growth is giving way to a focus on architectural innovation as the main driver of progress.
Architectural enhancements like Nvidia’s DLSS and AMD’s multi-chip designs represent this new direction. These new technologies leverage AI, advanced memory integration, and software-driven optimization to enhance performance in real-world scenarios. Emerging concepts like chiplet architectures and 3D stacking also promise to transform GPU design, enabling manufacturers to overcome the limits of monolithic chips and achieve higher performance within existing constraints.
As hardware innovation slows, our understanding of performance must evolve. Traditional benchmarks—such as teraflops and synthetic test scores—still hold value but often fail to capture real-world user experience, especially in gaming. A more meaningful approach is to focus on frame latency, which measures the time it takes for a GPU to render and display individual frames. This metric better reflects the fluidity and responsiveness of gameplay.
Latency needs also vary significantly between gaming genres. Fast-paced shooters (FPS) demand ultra-low latency for smooth visuals and precise controls during action-heavy sequences. On the other hand, role-playing games (RPGs) prioritize rich, immersive visuals, where slightly higher latency is acceptable. Strategy games or casual titles can tolerate even more latency without compromising user satisfaction. Recognizing these differences allows developers and manufacturers to optimize graphics adapters and software for specific use cases, ensuring the best experience across diverse gaming applications.
Frame latency has a direct impact on how smooth and responsive a game feels, particularly in graphically intensive or high-frame-rate scenarios. Measuring GPUs based on latency and stability provides a clearer picture of their real-world performance. A GPU with modest raw power might still outperform a higher-rated competitor by minimizing stutters and frame drops during demanding gameplay. By emphasizing such metrics, manufacturers can better meet the expectations of gamers and professionals alike.
The GPU industry is at a critical juncture. With traditional silicon scaling offering diminishing returns, the future lies in combining innovative hardware designs with smarter approaches to performance measurement. AI-enhanced rendering, smarter resource allocation, and advanced memory architectures will drive the next wave of GPU evolution. At the same time, adopting metrics like frame latency ensures these advances deliver meaningful, tangible improvements for end users.
The next chapter for GPUs is not just about making silicon faster or smaller. It’s about reimagining how we approach computing itself—focusing on creativity, efficiency, and user experience to propel innovation in a world where the limits of silicon are no longer the limits of possibility.
Nvidia GPU performance table
| GPU series | Architecture | Process node | 3DMark Time Spy Extreme score | % difference vs. previous gen | Months between launches | Monthly average % gain |
|---|---|---|---|---|---|---|
| Nvidia RTX 50 series (Quadro, GeForce ,...) | Blackwell | 4nm TSMC (4NP) | Estimated: 25,000 | +25% | Expected: 26 months | ~0.96% per month |
| Nvidia RTX 40 series (Quadro, GeForce ,...) | Ada Lovelace | 4nm TSMC | 20,692 (RTX 4090) | +80% | 23 months | ~3.48% per month |
| Nvidia RTX 30 series (Quadro, GeForce ,...) | Ampere | 8nm Samsung | 11,441 (RTX 3080 Ti) | +63% | 24 months | ~2.63% per month |
| Nvidia RTX 20 series (Quadro, GeForce ,...) | Turing | 12nm | 7,000 (RTX 2080 Ti) | +75% | 28 months | ~2.68% per month |
| Nvidia GTX 10 series (Quadro, GeForce ,...) | Pascal | 16nm | 4,000 (GTX 1080 Ti) | N/A | 19 months | N/A |
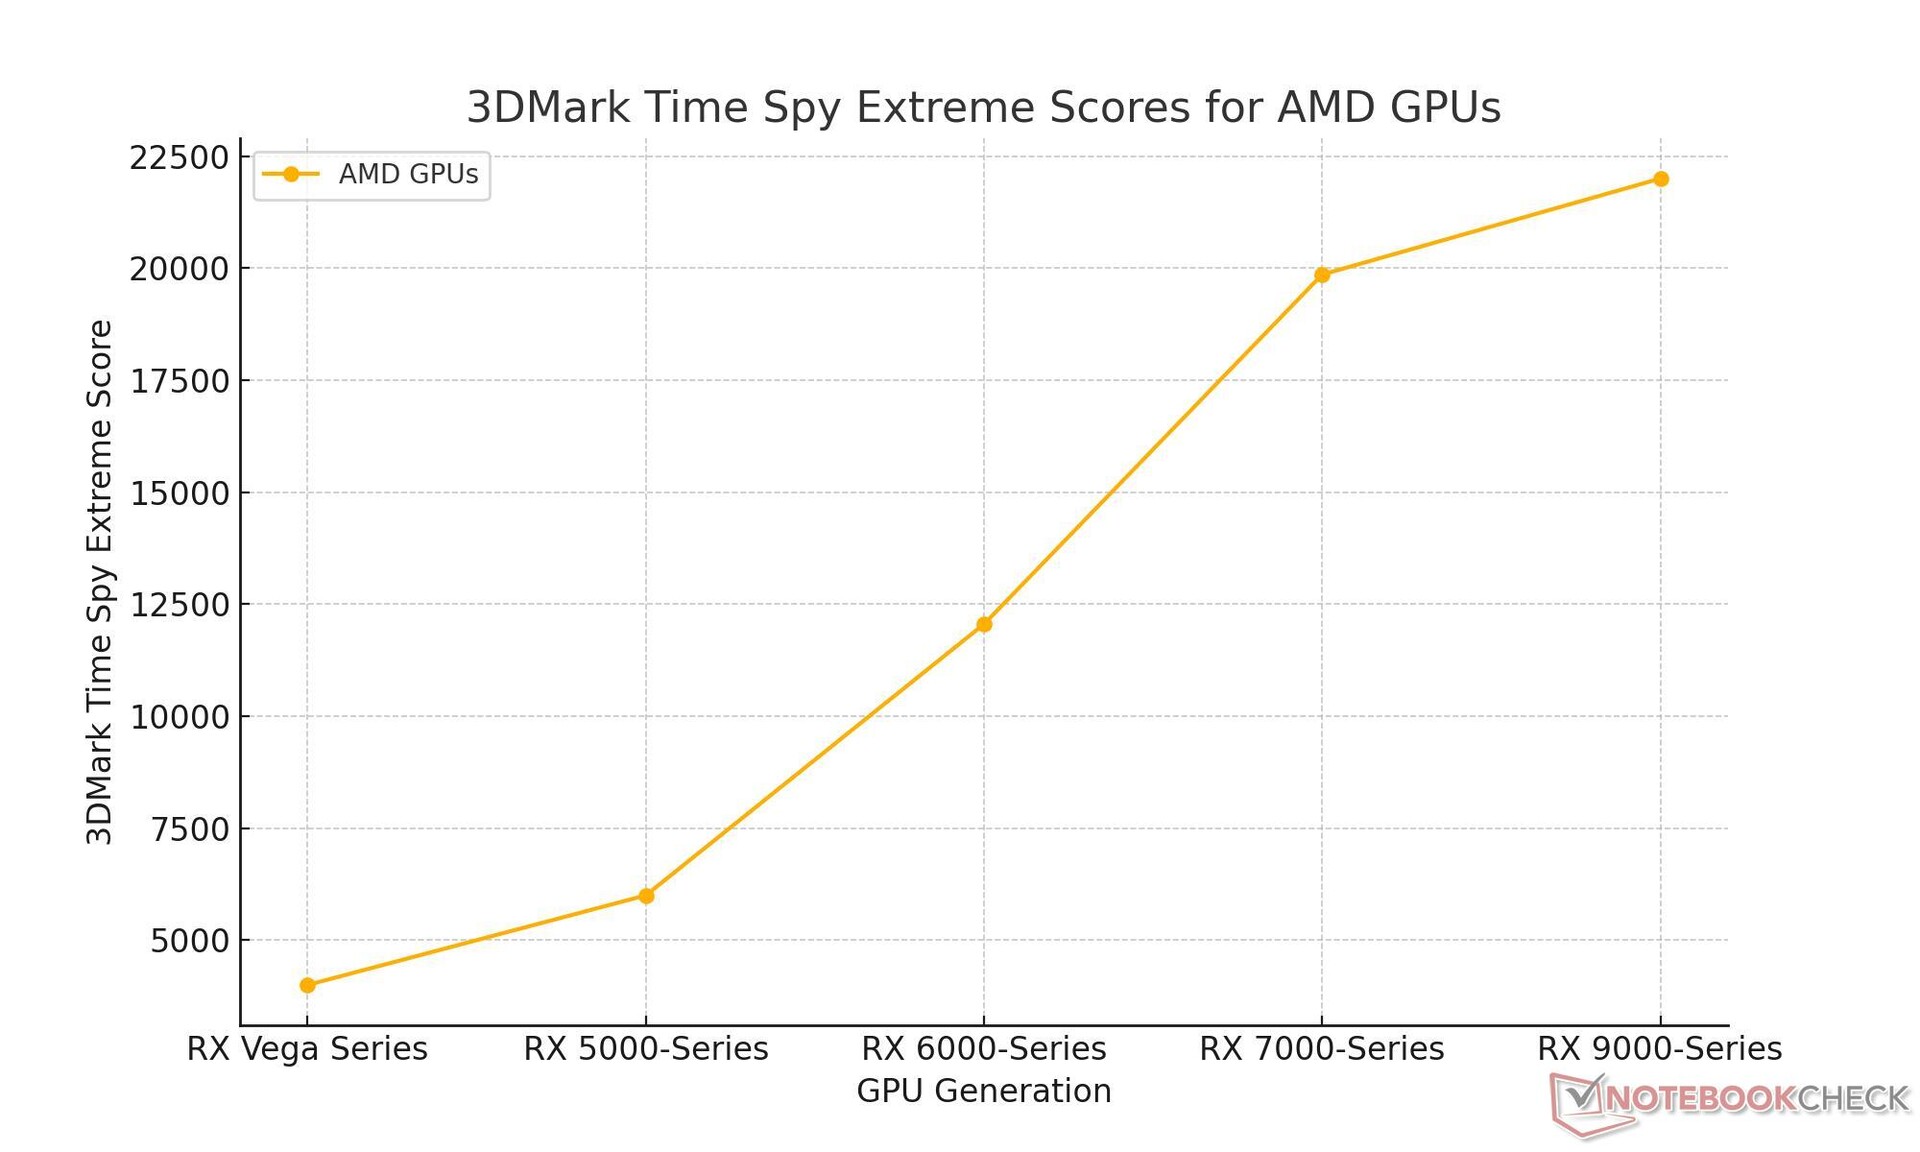
AMD GPU performance table
| GPU series | Architecture | Process node | 3DMark Time Spy Extreme score | % difference vs. previous gen | Months between launches | Monthly average % gain |
|---|---|---|---|---|---|---|
| AMD RX 9000 series | RDNA 4 | 4nm TSMC (N4P) | Estimated: 22,000 | +25% | Expected: 24 months | ~1.04% per month |
| AMD RX 7000 series | RDNA 3 | 5nm TSMC | 19,857 (RX 7900 XTX) | +65% | 25 months | ~2.60% per month |
| AMD RX 6000 series | RDNA 2 | 7nm TSMC | 12,054 (RX 6900 XT) | +100% | 16 months | ~6.25% per month |
| AMD RX 5000 series | RDNA | 7nm TSMC | 6,000 (RX 5700 XT) | +50% | 26 months | ~1.92% per month |
| AMD RX Vega series | Vega | 14nm | 4,000 (RX Vega 64) | N/A | 16 months | N/A |
Source(s)
