Notebookcheck Logo

Google Tensor vs Mediatek MT6735M vs Google Tensor G2

Google Tensor

► remove from comparison Google Tensor

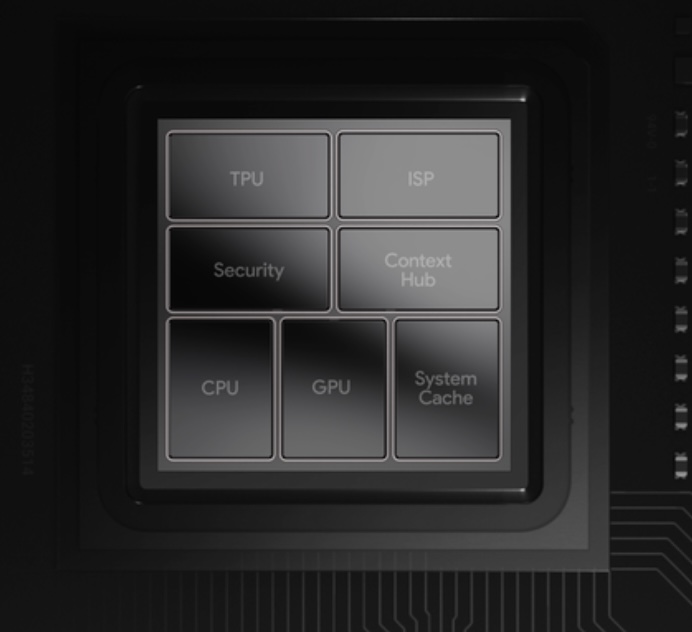
The Google Tensor SoC (G1, first generation) is the first smartphone processor from Google. It is positioned as a high end SoC and focuses on the integrated TPU for efficient AI and ML calculations. The CPU part integrates two fast and big ARM Cortex X1 cores at up to 2.8 GHz. A second cluster integrates 2 mid range Cortex-A76 cores at up to 2.25 GHz. Finally, four small ARM Cortex-A55 cores with up to 1.8 GHz are integrated for efficiency purposes. All cores can access the shared 4 MB L3 cache. 

The successors of the Tensor SoC are the Tensor G2 and G3.

The chip also integrates a Titan M2 security processor and a ARM Mali G78 MP20 GPU. The chip is manufactured in the modern 5nm process.

Mediatek MT6735M

► remove from comparison  MT6735M

The 1.5 GHz MediaTek MT6735M is a 64-bit ARM-based SoC launched in mid 2015 primarily for small budget to mainstream Android devices. The quad-core processor is manufactured in 28 nm and is based on the Cortex-A53 architecture. It integrates a cat.4 LTE modem with CDMA2000 and an ARM Mali-720 GPU capable of decoding and encoding videos of up to 1080p30. Compared to the MT6732, the MT6735M utilizes a slower graphics unit. Compared to the similar MediaTek MT6735, the "M"-version is significantly lower clocked (only 1 versus 1.5 GHz).

Processor

The Cortex-A53 is the successor to the popular Cortex-A7 design. In addition to the jump from 32-bit to 64-bit architecture (ARMv8 ISA) to address more than 4 GB of memory, the new design offers better branch prediction and higher performance-to-power ratio that rivals the Cortex-A9. The four cores of the MT6732 are clocked at up to 1 GHz and therefore the MT6735M is significantly slower than other A53 SoCs that are usually clocked at 1.4 GHz and up.

The power-efficient processor is still suited for low demanding tasks like browsing and running light applications.

Graphics

The integrated single-core Mali-T720 is an entry-level GPU clocked at up to 450 MHz. Most Android games will play at acceptable frame rates on medium resolutions and quality.

Features

The MT6732M SoC integrates a memory controller (32-bit LPDDR3, 6.4 GB/s), multiple radios (WLAN, Bluetooth, GPS), and a cellular modem (GSM, UMTS, GPRS, HSPA+, HSUPA, TD-SCDMA, EVDO, and LTE Cat 4). Its integrated video engine allows for 1080p playback at 30 FPS. Cameras are supported up to 13 MP.

Google Tensor G2

► remove from comparison Google Tensor G2

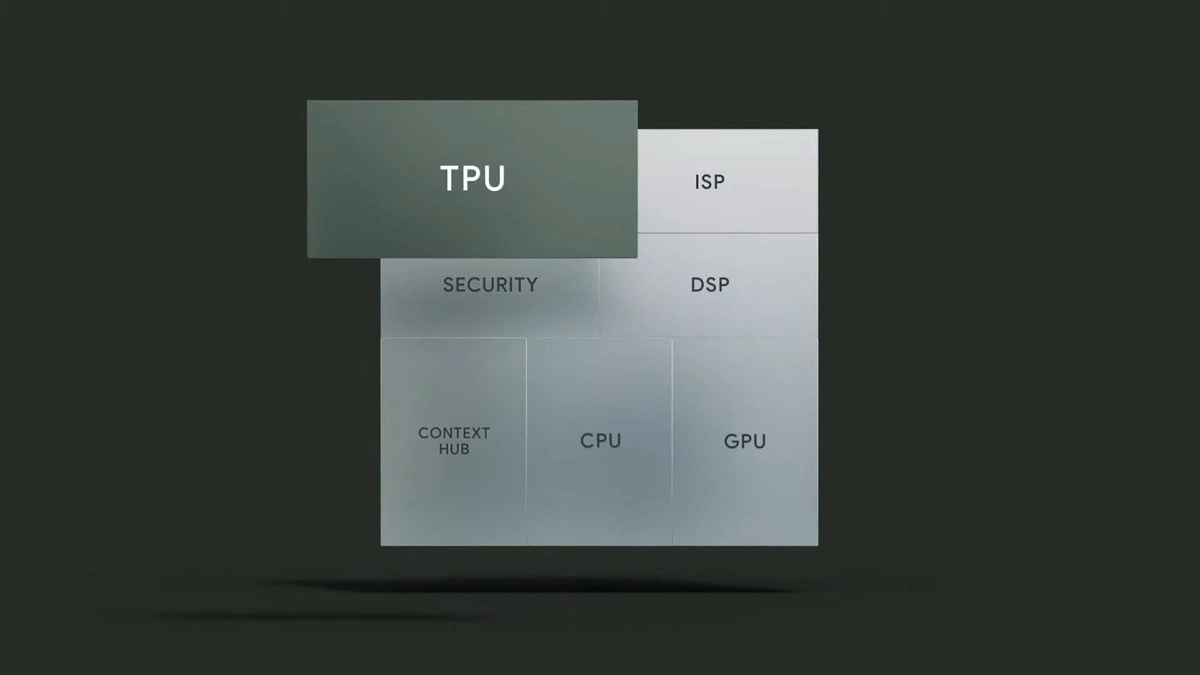
The Google Tensor G2 SoC is a chip that was developed by Google and Samsung for the Google Pixel smarthpones. It is the successor to the Google Tensor G1 and still integrates the same CPU cores. This processor part includes two fast ARM Cortex-X1 cores at up to 2.85 GHz (up from 2.8 GHz of the G1), two mid-range Cortex-A78 cores at up to 2.35 GHz and four small ARM Cortex-A55 efficiency cores with up to 1.8 GHz. The caches are identical with 4 MB CPU L3 cache and 8 MB system level cache. Therefore, the CPU performance is very similar to the first generation of the Tensor SoC.

A big upgrade is the new TPU, which should be more powerful and power efficient compared to its predecessor. In our tests, the AI performance is about 50% higher.

The iGPU was also improved, and now uses a more modern ARM Mali G710 architecture with 7 cores.

The chip also integrates a Titan M2 security processor, a LPDDR5 memory controller, and an ISP for 10-bit HDR / 4k/60 video and 108 MP cameras.

The SoC is manufactured in 5nm at Samsung.

ModelGoogle TensorMediatek MT6735MGoogle Tensor G2
CodenameExynos X1 / Cortex-A76 / A55Cortex-A53Cortex X1 / A76 / A55
Clock1800 - 2800 MHz1000 MHz1800 - 2850 MHz
L3 Cache4 MB4 MB
Cores / Threads8 / 84 / 48 / 8
Technology5 nm28 nm5 nm
FeaturesARM Mali-G78MP20 GPURel. 9, Cat. 4 LTE (FDD & TDD), DC-HSPA+, TD-SCDMA, CDMA2000 1x/EVDO Rev. A, EDGE, 802.11n Wi-Fi, Bluetooth 4.0, 13MP image signal-processor,ARM Mali-G78MP20 GPU
iGPUARM Mali-G78 MP20 ( - 848 MHz)ARM Mali-T720 ( - 450 MHz)ARM Mali-G710 MP7
ArchitectureARMARMARM
Announced
Manufacturerblog.googlestore.google.com
Series Mediatek
Series: Mediatek Cortex-A53
Mediatek Helio X10 MT67952.2 GHz8 / 8 cores Cortex-A53
Mediatek Helio P35 MT67651.8 - 2.3 GHz8 / 8 cores Cortex-A53
Mediatek Helio P22T MT8768T2.3 GHz8 / 8 cores Cortex-A53
Mediatek Helio P10 MT67552 GHz8 / 8 cores Cortex-A53
Mediatek MT87521.7 GHz8 / 8 cores Cortex-A53
Mediatek MT67521.7 GHz8 / 8 cores Cortex-A53
Mediatek MT67531.5 GHz8 / 8 cores Cortex-A53
Mediatek MT6750S1.5 GHz8 / 8 cores Cortex-A53
Mediatek MT6750N1.5 GHz8 / 8 cores Cortex-A53
Mediatek MT67501.5 GHz8 / 8 cores Cortex-A53
Mediatek MT6750T1.5 GHz8 / 8 cores Cortex-A53
Mediatek MT87321.5 GHz4 / 4 cores Cortex-A53
Mediatek MT81651.5 GHz4 / 4 cores Cortex-A53
Mediatek MT67391.5 GHz4 / 4 cores Cortex-A53
Mediatek MT6739WW1.5 GHz4 / 4 cores Cortex-A53
Mediatek MT67321.5 GHz4 / 4 cores Cortex-A53
Mediatek MT67351.5 GHz4 / 4 cores Cortex-A53
Mediatek MT87351.3 GHz4 / 4 cores Cortex-A53
Mediatek MT6737T1.5 GHz4 / 4 cores Cortex-A53
Mediatek MT67371.25 GHz4 / 4 cores Cortex-A53
Mediatek MT6735P1 GHz4 / 4 cores Cortex-A53
Mediatek MT6735M « 1 GHz4 / 4 cores Cortex-A53

Benchmarks

3DMark - 3DMark Ice Storm Unlimited Physics
100%
1 MT6735M +
7072 Points (6%)
3DMark - 3DMark Sling Shot Extreme (ES 3.1) Unlimited Physics
100%
1 Tensor +
min: 3643     avg: 3946     median: 3919 (37%)     max: 4277 Points
min: 4086     avg: 4596     median: 4672 (44%)     max: 4983 Points
3DMark - 3DMark Sling Shot (ES 3.0) Unlimited Physics
100%
1 Tensor +
min: 3393     avg: 4014     median: 4147 (47%)     max: 4501 Points
min: 4336     avg: 4765     median: 4875 (56%)     max: 4985 Points
Geekbench 6.5 - Geekbench 6.5 Single-Core
min: 1428     avg: 1452     median: 1450 (35%)     max: 1480 Points
Geekbench 6.5 - Geekbench 6.5 Multi-Core
min: 3383     avg: 3638     median: 3600 (14%)     max: 3967 Points
Geekbench 6.0 - Geekbench 6.0 Single-Core
1487 Points (47%)
Geekbench 6.0 - Geekbench 6.0 Multi-Core
3862 Points (16%)
Geekbench 5.5 - Geekbench 5.1 - 5.5 64 Bit Single-Core
100%
1 Tensor +
min: 1025     avg: 1041     median: 1041 (40%)     max: 1057 Points
min: 1036     avg: 1053     median: 1049 (40%)     max: 1078 Points
Geekbench 5.5 - Geekbench 5.1 - 5.5 64 Bit Multi-Core
100%
1 Tensor +
min: 2805     avg: 2895     median: 2940 (5%)     max: 2941 Points
min: 3093     avg: 3198     median: 3217 (6%)     max: 3265 Points
Geekbench 5.0 - Geekbench 5.0 64 Bit Single-Core
1069 Points (5%)
Geekbench 5.0 - Geekbench 5.0 64 Bit Multi-Core
min: 3272     avg: 3277     median: 3276.5 (10%)     max: 3281 Points
Geekbench 4.4 - Geekbench 4.1 - 4.4 64 Bit Single-Core
100%
1 Tensor +
4815 Points (48%)
min: 4771     avg: 4784     median: 4782 (48%)     max: 4800 Points
Geekbench 4.4 - Geekbench 4.1 - 4.4 64 Bit Multi-Core
100%
1 Tensor +
11589 Points (11%)
min: 12110     avg: 12684     median: 12839.5 (13%)     max: 12946 Points
Geekbench 4.0 - Geekbench 4.0 64 Bit Single-Core
4608 Points (51%)
431 Points (5%)
min: 4609     avg: 4625     median: 4624.5 (51%)     max: 4640 Points
Geekbench 4.0 - Geekbench 4.0 64 Bit Multi-Core
11058 Points (15%)
1209 Points (2%)
min: 12072     avg: 12113     median: 12112.5 (16%)     max: 12153 Points
Geekbench 3 - Geekbench 3 64 Bit Multi-Core
100%
1 Tensor +
9830 Points (15%)
min: 13256     avg: 13487     median: 13486.5 (21%)     max: 13717 Points
Geekbench 3 - Geekbench 3 64 Bit Single-Core
100%
1 Tensor +
3264 Points (49%)
min: 4061     avg: 4137     median: 4137 (62%)     max: 4213 Points
Mozilla Kraken 1.1 - Kraken 1.1 Total Score *
min: 915     avg: 1160     median: 1034 (1%)     max: 1531.6 ms
18130 ms (21%)
min: 919.6     avg: 992     median: 1011.5 (1%)     max: 1074.5 ms
Sunspider - Sunspider 1.0 Total Score *
min: 298     avg: 300.7     median: 300.7 (3%)     max: 303.3 ms
Octane V2 - Octane V2 Total Score
min: 33046     avg: 40152     median: 43376 (32%)     max: 44034 Points
1929 Points (1%)
min: 43817     avg: 45221     median: 44948 (33%)     max: 47939 Points
WebXPRT 4 - WebXPRT 4 Score
100%
1 Tensor +
72 Points (20%)
min: 90     avg: 98.6     median: 98 (27%)     max: 111 Points
WebXPRT 3 - WebXPRT 3 Score
100%
1 Tensor +
min: 77     avg: 97.3     median: 105 (19%)     max: 110 Points
min: 98     avg: 110     median: 98 (18%)     max: 134 Points
Vellamo 3.x - Vellamo 3.x Metal
100%
1 MT6735M +
668 Points (18%)
Vellamo 3.x - Vellamo 3.x Multicore Beta
100%
1 MT6735M +
1186 Points (26%)
Vellamo 3.x - Vellamo 3.x Browser
100%
1 MT6735M +
1630 Points (22%)
AnTuTu v6 - AnTuTu v6 Total Score
100%
1 MT6735M +
23464 Points (8%)
AnTuTu v8 - AnTuTu v8 UX
100%
1 Tensor +
80242 Points (67%)
AnTuTu v8 - AnTuTu v8 MEM
100%
1 Tensor +
91046 Points (73%)
AnTuTu v8 - AnTuTu v8 GPU
100%
1 Tensor +
266666 Points (49%)
AnTuTu v8 - AnTuTu v8 CPU
100%
1 Tensor +
173530 Points (63%)
AnTuTu v8 - AnTuTu v8 Total Score
100%
1 Tensor +
611484 Points (59%)
Antutu v9 - AnTuTu v9 Total Score
100%
1 Tensor +
min: 702981     avg: 713075     median: 715338 (35%)     max: 720905 Points
min: 619727     avg: 692109     median: 657414 (32%)     max: 773857 Points
Antutu v9 - AnTuTu v9 CPU
100%
1 Tensor +
min: 179373     avg: 186798     median: 189382 (47%)     max: 191638 Points
min: 148269     avg: 185009     median: 186042 (46%)     max: 206520 Points
PassMark PerformanceTest Mobile V1 - PerformanceTest Mobile V1 CPU Tests
100%
1 MT6735M +
14977 Points (2%)
PCMark for Android - PCM f. Android Storage 2.0 score
100%
1 Tensor +
min: 17485     avg: 22609     median: 22608.5 (10%)     max: 27732 Points
min: 23085     avg: 26691     median: 26679.5 (12%)     max: 30321 Points
PCMark for Android - PCM f. Android Work Score 3.0
100%
1 Tensor +
min: 9717     avg: 10577     median: 10409 (38%)     max: 11605 Points
min: 10530     avg: 11184     median: 11397 (42%)     max: 11736 Points
PCMark for Android - PCM f. Android Work Score
100%
1 MT6735M +
2125 Points (11%)
PCMark for Android - PCM f. Android Storage 2.0 random write internal
min: 58.7     avg: 60.1     median: 60.1 (41%)     max: 61.5 MB/s
PCMark for Android - PCM f. Android Storage 2.0 seq write internal
min: 511.8     avg: 513     median: 512.7 (14%)     max: 513.66 MB/s
PCMark for Android - PCM f. Android Storage 2.0 random read internal
min: 23.61     avg: 27.3     median: 27.3 (13%)     max: 30.92 MB/s
PCMark for Android - PCM f. Android Storage 2.0 seq read internal
min: 721.29     avg: 1148     median: 1147.6 (29%)     max: 1573.94 MB/s
CrossMark - CrossMark Overall
100%
1 Tensor +
min: 849     avg: 873     median: 865 (32%)     max: 906 Points
min: 886     avg: 900     median: 895 (33%)     max: 934 Points
Power Consumption - Geekbench 5.5 Power Consumption 150cd *
100%
1 Tensor +
min: 5.28     avg: 5.4     median: 5.4 (2%)     max: 5.64 Watt
min: 3.6     avg: 5.8     median: 6.5 (3%)     max: 7.34 Watt
Power Consumption - Idle Power Consumption 150cd 1min *
100%
1 Tensor +
min: 0.758     avg: 0.9     median: 0.8 (1%)     max: 1.013 Watt
min: 0.751     avg: 1.2     median: 1 (1%)     max: 2.18 Watt

Average Benchmarks Google Tensor → 100% n=4

Average Benchmarks Mediatek MT6735M → 8% n=4

Average Benchmarks Google Tensor G2 → 104% n=4

- Range of benchmark values for this graphics card
red legend - Average benchmark values for this graphics card
* Smaller numbers mean a higher performance
1 This benchmark is not used for the average calculation

v1.34
log 19. 00:47:22

#0 ran 0s before starting gpusingle class +0s ... 0s

#1 checking url part for id 14022 +0s ... 0s

#2 checking url part for id 8530 +0s ... 0s

#3 checking url part for id 14635 +0s ... 0s

#4 redirected to Ajax server, took 1760827642s time from redirect:0 +0s ... 0s

#5 did not recreate cache, as it is less than 5 days old! Created at Thu, 16 Oct 2025 05:21:56 +0200 +0s ... 0s

#6 composed specs +0.007s ... 0.007s

#7 did output specs +0s ... 0.007s

#8 getting avg benchmarks for device 14022 +0.001s ... 0.008s

#9 got single benchmarks 14022 +0.005s ... 0.013s

#10 getting avg benchmarks for device 8530 +0.001s ... 0.013s

#11 got single benchmarks 8530 +0.004s ... 0.017s

#12 getting avg benchmarks for device 14635 +0.001s ... 0.018s

#13 got single benchmarks 14635 +0.006s ... 0.024s

#14 got avg benchmarks for devices +0s ... 0.024s

#15 min, max, avg, median took s +0.026s ... 0.05s

#16 return log +0s ... 0.05s

Please share our article, every link counts!
Mail Logo
> Expert Reviews and News on Laptops, Smartphones and Tech Innovations > Benchmarks / Tech > Processor Comparison - Head 2 Head
Redaktion, 2017-09- 8 (Update: 2023-07- 1)