Tegra 4 and Project Shield coming in early summer 2013
NVIDIA recently held their quarterly earnings call, and CEO Jen-Hsun Huang had information to reveal about Tegra 4 and their Project Shield gaming console. According to Huang, production of the 28nm-based Tegra 4 has been ramped up and shipments are expected in the later part of Q2 2013. Unfortunately, the transition from Tegra 3 to Tegra 4 has negatively impacted sales, but leaps in future generations are expected to be less pronounced.
Reports have surfaced over the past month about the Tegra 4 pricing its way out of many devices, but NVIDIA's earnings reveal a different story. Quarterly revenue was indeed down 8% to $1.1 billion, but this was still 16% greater than Q1 of 2012.
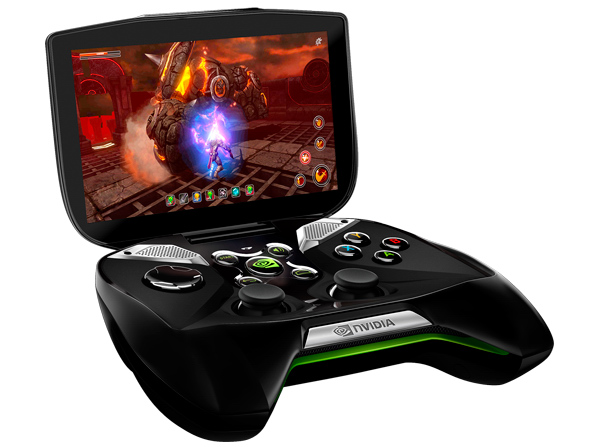
While the Tegra 4 is expected to power many smartphones and tablets, its biggest device may be the in-house produced Project Shield. The gaming console was introduced at CES earlier this year, and should ship in Q2 as the first Tegra 4 device. The console adds many features to mobile gaming, chief of which are dynamic shadows and PhysX. This performance was highlighted in a video showing Project Shield running "Dead on Arrival 2" and the results can clearly be seen below.
Source(s)
Pressemeldung
NVIDIA Reports Financial Results for Annual and Fourth Quarter Fiscal 2013
SANTA CLARA, CA, Feb 13, 2013 (MARKETWIRE via COMTEX) -- NVIDIA NVDA +0.24%
-- Full-year revenue increased 7.1 percent to a record $4.28 billion
-- Quarterly revenue decreased 8.1 percent sequentially to $1.11 billion;
year on year, revenue was up 16.1 percent
-- Quarterly GAAP diluted EPS of $0.28, off from $0.33 in Q3; non-GAAP
diluted EPS of $0.35, off from $0.39 in Q3
-- Quarterly GAAP gross margin of 52.9 percent; non-GAAP gross margin of
53.2 percent
NVIDIA NVDA +0.24% today reported revenue for fiscal 2013 ended Jan. 27, 2013, of a record $4.28 billion, up 7.1 percent from $4.00 billion in fiscal 2012.
GAAP earnings per share for the year were $0.90 per diluted share, a decrease of 4.3 percent from $0.94 in fiscal 2012. Non-GAAP earnings per diluted share were $1.17, down 1.7 percent from $1.19 in fiscal 2012.
During the quarter, NVIDIA repurchased $100.0 million of stock and paid a dividend of $0.075 per share, equivalent to $46.9 million.
"This year we did the best work in our company's history," said Jen-Hsun Huang, president and chief executive officer of NVIDIA. "We achieved record revenues, margins and cash, despite significant market headwinds.
"We grew our GPU and Tegra Processor businesses. We are sampling production silicon of the Tegra 4 platform which includes our 4G LTE modem. And we created new pillars for long term growth with Project SHIELD and NVIDIA GRID -- first-of-their-kind devices that will extend our leadership in visual computing into mobile and the cloud."
----------------------------------------------------------------------------
GAAP Annual Financial Comparison
----------------------------------------------------------------------------
(in millions except per
share data) FY13 FY12 Y/Y$ Y/Y%
----------------------------------------------------------------------------
Revenue $4,280.2 $3,997.9 up $282.3 up 7.1%
----------------------------------------------------------------------------
Gross Margin 52.0% 51.4% ------ up 0.6 p.p.
----------------------------------------------------------------------------
Operating Expenses $1,578.1 $1,408.2 up $169.9 up 12.1%
----------------------------------------------------------------------------
Net Income $562.5 $581.1 down $18.6 down 3.2%
----------------------------------------------------------------------------
Earnings Per Share $0.90 $0.94 down $0.04 down 4.3%
----------------------------------------------------------------------------
----------------------------------------------------------------------------
Non-GAAP* Annual Financial Comparison
----------------------------------------------------------------------------
(in millions except per
share data) FY13 FY12 Y/Y$ Y/Y%
----------------------------------------------------------------------------
Revenue $4,280.2 $3,997.9 up $282.3 up 7.1%
----------------------------------------------------------------------------
Gross Margin 52.3% 51.9% ------ up 0.4 p.p.
----------------------------------------------------------------------------
Operating Expenses $1,395.7 $1,245.7 up $150.0 up 12.0%
----------------------------------------------------------------------------
Net Income $728.4 $734.4 down $6.0 down 0.8%
----------------------------------------------------------------------------
Earnings Per Share $1.17 $1.19 down $0.02 down 1.7%
----------------------------------------------------------------------------
*Non-GAAP earnings excluded stock-based compensation, amortization of acquisition-related intangible assets, other acquisition-related costs, a contribution expense in the second quarter of fiscal 2013, a legal settlement charge in the fourth quarter of fiscal 2012, and the tax impact associated with such items.
----------------------------------------------------------------------------
GAAP Quarterly Financial Comparison
----------------------------------------------------------------------------
(in millions
except per Q4 FY13 Q3 FY13 Q4 FY12 Q/Q Y/Y
share data)
----------------------------------------------------------------------------
Revenue $1,106.9 $1,204.1 $953.2 down 8.1% up 16.1%
----------------------------------------------------------------------------
Gross margin 52.9% 52.9% 51.4% flat up 1.5 p.p
----------------------------------------------------------------------------
Operating
expenses $402.0 $384.4 $367.7 up 4.6% up 9.3%
----------------------------------------------------------------------------
Net income $174.0 $209.1 $116.0 down 16.8% up 50.0%
----------------------------------------------------------------------------
Earnings per
share $0.28 $0.33 $0.19 down 15.2% up 47.4%
----------------------------------------------------------------------------
----------------------------------------------------------------------------
Non-GAAP* Quarterly Financial Comparison
----------------------------------------------------------------------------
(in millions
except per Q4 FY13 Q3 FY13 Q4 FY12 Q/Q Y/Y
share data)
----------------------------------------------------------------------------
Revenue $1,106.9 $1,204.1 $953.2 down 8.1% up 16.1%
----------------------------------------------------------------------------
Gross margin 53.2% 53.1% 52.5% up 0.1 p.p up 0.7 p.p
----------------------------------------------------------------------------
Operating
expenses $360.4 $344.8 $325.2 up 4.5% up 10.8%
----------------------------------------------------------------------------
Net income $214.9 $245.5 $158.1 down 12.5% up 35.9%
----------------------------------------------------------------------------
Earnings per
share $0.35 $0.39 $0.26 down 10.3% up 34.6%
----------------------------------------------------------------------------
*Non-GAAP earnings excluded stock-based compensation, amortization of acquisition-related intangible assets, other acquisition-related costs, a legal settlement charge in the fourth quarter of fiscal 2012, and the tax impact associated with such items.
Our outlook for the first quarter of fiscal 2014 is as follows:
-- Revenue is expected to be $940 million, plus or minus two percent.
-- GAAP and non-GAAP gross margins are expected to be flat relative to
the prior quarter, at 52.9 percent and 53.2 percent, respectively.
-- GAAP operating expenses are expected to be approximately $430 million;
non-GAAP operating expenses are expected to be approximately $395
million.
-- GAAP and non-GAAP tax rates for the first quarter and annual fiscal
2014 are both expected to be 16 percent, plus or minus one percentage
point. This estimate excludes any discrete tax events that may occur
during a quarter which, if realized, may increase or decrease our
actual effective tax rates in such quarter.
We estimate depreciation and amortization for the first quarter to be approximately $59 million to $61 million. Capital expenditures are expected to be in the range of $55 million to $65 million.
Diluted shares for the first quarter are expected to be approximately 619 million.
Fourth Quarter Fiscal 2013 Highlights:
-- NVIDIA's customers brought three Windows RT devices to market -- Asus
VivoTab RT, IdeaPad Yoga 11 from Lenovo, and Microsoft Surface RT
-- NVIDIA announced Project SHIELD(TM), a unique Android gaming device
that will ship in the second quarter of fiscal 2014
-- NVIDIA launched Tegra(R) 4, the world's fastest mobile SOC and the
first quad-core A15 SOC
-- NVIDIA continued to drive the streaming of gaming from the cloud by
signing deals with six middleware providers that will supply
GRID(TM) gaming technology to service operators worldwide
-- NVIDIA officially launched the Tesla(R) K20 family of GPU
accelerators, making the technology behind the world's fastest
supercomputer, Titan, available to all
Dividend
NVIDIA will pay its next quarterly cash dividend of $0.075 cents per share on March 21, 2013 to all stockholders of record on February 28, 2013.
Reporting Segments During the fourth quarter of fiscal 2013, NVIDIA began reporting two primary financial reporting segments -- GPU and Tegra Processor. This change reflects the way NVIDIA is now managing its businesses internally. More information on this change is in NVIDIA's CFO Commentary.
CFO Commentary and Earnings Presentation Commentary on the quarter by Karen Burns, NVIDIA interim chief financial officer, and a presentation, are available at www.nvidia.com/ir .
Conference Call and webcast Information NVIDIA will conduct a conference call with analysts and investors to discuss its fourth quarter fiscal 2013 financial results and current financial prospects today at 2:00 p.m. Pacific Time (5:00 p.m. Eastern Time). To listen to the call, please dial (706) 679 2572. A live webcast (listen-only mode) of the conference call will be accessible at the NVIDIA investor relations web site www.nvidia.com/ir and at www.streetevents.com . The webcast will be recorded and available for replay until the company's conference call to discuss its financial results for its first quarter fiscal 2014.
Non-GAAP Measures To supplement NVIDIA's Condensed Consolidated Statements of Operations and Condensed Consolidated Balance Sheets presented in accordance with GAAP, the company uses non-GAAP measures of certain components of financial performance. These non-GAAP measures include non-GAAP gross profit, non-GAAP gross margin, non-GAAP operating expenses, non-GAAP income tax expense, non-GAAP net income, non-GAAP net income, or earnings, per share, and free cash flow. In order for NVIDIA's investors to be better able to compare its current results with those of previous periods, the company has shown a reconciliation of GAAP to non-GAAP financial measures. These reconciliations adjust the related GAAP financial measures to exclude stock-based compensation, amortization of acquisition-related intangible assets, other acquisition-related costs, a contribution expense, a legal settlement charge, and the associated tax impact of these items, where applicable. Free cash flow is calculated as GAAP net cash provided by operating activities less purchases of property and equipment and intangible assets. NVIDIA believes the presentation of its non-GAAP financial measures enhances the user's overall understanding of the company's historical financial performance. The presentation of the company's non-GAAP financial measures is not meant to be considered in isolation or as a substitute for the company's financial results prepared in accordance with GAAP, and our non-GAAP measures may be different from non-GAAP measures used by other companies.
About NVIDIA NVIDIA NVDA +0.24% awakened the world to computer graphics when it invented the GPU in 1999. Today, its processors power a broad range of products from smart phones to supercomputers. NVIDIA's mobile processors are used in cell phones, tablets and auto infotainment systems. PC gamers rely on GPUs to enjoy spectacularly immersive worlds. Professionals use them to create visual effects in movies and design everything from golf clubs to jumbo jets. And researchers utilize GPUs to advance the frontiers of science with high-performance computing. The company holds more than 5,500 issued, allowed or filed patents worldwide, including ones covering ideas essential to modern computing. For more information, see www.nvidia.com .
Certain statements in this press release including, but not limited to statements as to: the company's financial outlook for the first quarter of fiscal 2014; the company's tax rate for the first quarter and fiscal year 2014; the anticipated shipment of Project SHIELD in the second quarter; the extension of the company's visual computing expertise; the growth of the cloud and mobile markets; and the effects of the company's patents on modern computing are forward-looking statements that are subject to risks and uncertainties that could cause results to be materially different than expectations. Important factors that could cause actual results to differ materially include: global economic conditions; our reliance on third parties to manufacture, assemble, package and test our products; the impact of technological development and competition; development of new products and technologies or enhancements to our existing product and technologies; market acceptance of our products or our partners products; design, manufacturing or software defects; changes in consumer preferences or demands; changes in industry standards and interfaces; unexpected loss of performance of our products or technologies when integrated into systems; as well as other factors detailed from time to time in the reports NVIDIA files with the Securities and Exchange Commission, or SEC, including its Form 10-Q for the fiscal period ended October 28, 2012. Copies of reports filed with the SEC are posted on the company's website and are available from NVIDIA without charge. These forward-looking statements are not guarantees of future performance and speak only as of the date hereof, and, except as required by law, NVIDIA disclaims any obligation to update these forward-looking statements to reflect future events or circumstances.
(C) 2013 NVIDIA Corporation. All rights reserved. NVIDIA, the NVIDIA logo, GRID, Tegra, SHIELD and Tesla are trademarks and/or registered trademarks of NVIDIA Corporation in the U.S. and/or other countries. Other company and product names may be trademarks of the respective companies with which they are associated. Features, pricing, availability, and specifications are subject to change without notice.
NVIDIA CORPORATION
CONDENSED CONSOLIDATED STATEMENTS OF INCOME
(In thousands, except per share data)
(Unaudited)
Three Months Ended Twelve Months Ended
----------------------- -----------------------
January 27, January 29, January 27, January 29,
2013 2012 2013 2012
----------- ----------- ----------- -----------
Revenue $ 1,106,902 $ 953,194 $ 4,280,159 $ 3,997,930
Cost of revenue 521,300 463,181 2,053,816 1,941,413
----------- ----------- ----------- -----------
Gross profit 585,602 490,013 2,226,343 2,056,517
Operating expenses
Research and development 298,007 266,862 1,147,282 1,002,605
Sales, general and
administrative 104,022 100,834 430,822 405,613
----------- ----------- ----------- -----------
Total operating expenses 402,029 367,696 1,578,104 1,408,218
----------- ----------- ----------- -----------
Operating income 183,573 122,317 648,239 648,299
Interest and other income,
net 2,535 2,260 13,800 15,097
----------- ----------- ----------- -----------
Income before income tax
expense 186,108 124,577 662,039 663,396
Income tax expense 12,135 8,552 99,503 82,306
----------- ----------- ----------- -----------
Net income $ 173,973 $ 116,025 $ 562,536 $ 581,090
=========== =========== =========== ===========
Basic net income per share $ 0.28 $ 0.19 $ 0.91 $ 0.96
=========== =========== =========== ===========
Diluted net income per share $ 0.28 $ 0.19 $ 0.90 $ 0.94
=========== =========== =========== ===========
Shares used in basic per
share computation 620,169 611,432 619,324 603,646
Shares used in diluted per
share computation 622,018 618,599 624,957 616,371
NVIDIA CORPORATION
CONDENSED CONSOLIDATED BALANCE SHEETS
(In thousands)
(Unaudited)
January 27, January 29,
2013 2012
-------------- --------------
ASSETS
Current assets:
Cash, cash equivalents and marketable
securities $ 3,727,883 $ 3,129,576
Accounts receivable, net 454,252 336,143
Inventories 419,686 340,297
Prepaid expenses and other current assets 173,437 99,342
-------------- --------------
Total current assets 4,775,258 3,905,358
Property and equipment, net 576,144 560,072
Goodwill 641,030 641,030
Intangible assets, net 312,332 326,136
Other assets 107,481 120,332
-------------- --------------
Total assets $ 6,412,245 $ 5,552,928
============== ==============
LIABILITIES AND STOCKHOLDERS' EQUITY
Current liabilities:
Accounts payable $ 356,428 $ 335,072
Accrued liabilities and other current
liabilities 619,795 594,886
-------------- --------------
Total current liabilities 976,223 929,958
Other long-term liabilities 589,321 455,807
Capital lease obligations, long term 18,998 21,439
Stockholders' equity 4,827,703 4,145,724
-------------- --------------
Total liabilities and stockholders' equity $ 6,412,245 $ 5,552,928
============== ==============
NVIDIA CORPORATION
RECONCILIATION OF GAAP TO NON-GAAP FINANCIAL MEASURES
(In thousands, except per share data)
(Unaudited)
Three Months Ended Twelve Months Ended
----------------------------- ---------------------
January October January January January
27, 28, 29, 27, 29,
2013 2012 2012 2013 2012
--------- --------- --------- ---------- ----------
GAAP gross profit $ 585,602 $ 636,658 $ 490,013 $2,226,343 $2,056,517
GAAP gross margin 52.9% 52.9% 51.4% 52.0% 51.4%
Stock-based
compensation
expense included
in cost of revenue
(A) 2,826 2,489 3,048 10,490 11,322
Legal settlement
(B) - - 7,300 - 7,300
--------- --------- --------- ---------- ----------
Non-GAAP gross profit $ 588,428 $ 639,147 $ 500,361 $2,236,833 $2,075,139
========= ========= ========= ========== ==========
Non-GAAP gross margin 53.2% 53.1% 52.5% 52.3% 51.9%
GAAP operating expenses $ 402,029 $ 384,441 $ 367,696 $1,578,104 $1,408,218
Stock-based
compensation
expense included
in operating
expense (A) (32,943) (30,580) (32,388) (126,172) (125,032)
Amortization of
acquisition-
related intangible
assets (4,325) (4,402) (5,041) (17,134) (17,190)
Other acquisition-
related costs (C) (4,373) (4,666) (5,052) (19,004) (20,282)
Contribution
expense (D) - - - (20,127) -
--------- --------- --------- ---------- ----------
Non-GAAP operating
expenses $ 360,388 $ 344,793 $ 325,215 $1,395,667 $1,245,714
========= ========= ========= ========== ==========
GAAP net income $ 173,973 $ 209,080 $ 116,025 $ 562,536 $ 581,090
Total pre-tax
impact of non-GAAP
adjustments 44,467 42,137 52,829 192,927 181,126
Income tax impact
of non-GAAP
adjustments (3,507) (5,755) (10,718) (27,090) (27,810)
--------- --------- --------- ---------- ----------
Non-GAAP net income $ 214,933 $ 245,462 $ 158,136 $ 728,373 $ 734,406
========= ========= ========= ========== ==========
Diluted net income per
share
GAAP $ 0.28 $ 0.33 $ 0.19 $ 0.90 $ 0.94
========= ========= ========= ========== ==========
Non-GAAP $ 0.35 $ 0.39 $ 0.26 $ 1.17 $ 1.19
========= ========= ========= ========== ==========
Shares used in diluted
net income per share
computation 622,018 628,845 618,599 624,957 616,371
Metrics:
GAAP net cash flow
provided by
operating
activities $ 451,009 $ 181,485 $ 410,518 $ 824,172 $ 909,156
Purchase of
property and
equipment and
intangible assets (47,758) (44,684) (45,182) (183,309) (138,735)
--------- --------- --------- ---------- ----------
Free cash flow $ 403,251 $ 136,801 $ 365,336 $ 640,863 $ 770,421
========= ========= ========= ========== ==========
Graphics Processing
Unit (GPU) revenue $3,251,712 $3,186,764
Chipset product
revenue (24,309) (197,417)
---------- ----------
GPU revenue
excluding chipset
products $3,227,403 $2,989,347
========== ==========
(A) Excludes stock-
based compensation as
follows: Three Months Ended Twelve Months Ended
----------------------------- ---------------------
January October January January January
27, 28, 29, 27, 29,
2013 2012 2012 2013 2012
--------- --------- --------- ---------- ----------
Cost of revenue $ 2,826 $ 2,489 $ 3,048 $ 10,490 $ 11,322
Research and
development $ 22,009 $ 20,056 $ 20,908 $ 82,157 $ 80,502
Sales, general and
administrative $ 10,934 $ 10,524 $ 11,480 $ 44,015 $ 44,530
(B) On February 7, 2012, the Company and Rambus entered into a licensing
agreement and both parties also agreed to settle all outstanding legal
disputes. For accounting purposes, an additional charge of $7.3 million
associated with the fair value prescribed to the settlement portion was
recognized for the year ended January 29, 2012.
(C) Other acquisition-related costs are comprised of transaction costs,
compensation charges and restructuring costs related to the acquisition of
Icera, Inc. that was completed on June 10, 2011.
(D) Net present value of a $25 million charitable contribution pledged on
June 12, 2012 to Stanford Hospital and Clinic, payable over a ten year
period.
NVIDIA CORPORATION
RECONCILIATION OF GAAP TO NON-GAAP OUTLOOK
Q1 FY2014 Outlook
-------------------
GAAP gross margin 52.9%
Impact of stock-based compensation (A) 0.3%
-------------------
Non-GAAP gross margin 53.2%
===================
Q1 FY2014 Outlook
-------------------
(In millions)
GAAP operating expenses $ 430.0
Stock-based compensation expense included in
operating expense (28.0)
Amortization of acquisition-related intangible assets (4.0)
Other acquisition-related costs (B) (3.0)
-------------------
Non-GAAP operating expenses $ 395.0
===================
(A) Represents $2.6 million of stock-based compensation expense included in
cost of revenue.
(B) Other acquisition related costs are comprised primarily of compensation
charges related to the acquisition of Icera, Inc. that was completed on
June 10, 2011.
Related Articles
- NVIDIA Tegra Note 7 arrives on November 12 News @ 11/06/2013
- NVIDIA Shield to begin shipping on July 31st News @ 07/22/2013
- Nvidia Shield launch date postponed due to quality issues News @ 06/27/2013
- NVIDIA Shield now priced at just $299, coming June 27th News @ 06/20/2013
- Tegra 4i prototype smartphone shown off by NVIDIA News @ 06/11/2013
- Analyst claims Nvidia Tegra 4 ‘clearly outperforms’ Qualcomm Snapdragon 800 News @ 03/12/2013
- Nvidia Project Shield hands-on and video News @ 02/28/2013
- Qualcomm not backing down from NVIDIA's Tegra 4 News @ 02/28/2013
- Coby debuts the Kyros MID4331 mini Android 4.0 tablet News @ 02/22/2013
- IRiver outs the 7-inch WOWtab Jelly Bean tablet to take on Google’s Nexus 7? News @ 02/19/2013
- Toshiba first to adopt Tegra 4 in devices? News @ 02/01/2013
- Popular benchmark claims Tegra 4 is slower than both the iPad 4 and Nexus 10 News @ 01/11/2013
- Vizio shows off Tegra 4 tablets and AMD Z-60 for Android and Windows 8 News @ 01/09/2013
- Nvidia unveils Tegra 4 SoC News @ 01/07/2013