Notebookcheck Logo

Qualcomm Snapdragon 675 vs Qualcomm Snapdragon 712 vs Qualcomm Snapdragon 678

Qualcomm Snapdragon 675

► remove from comparison Qualcomm SD 675

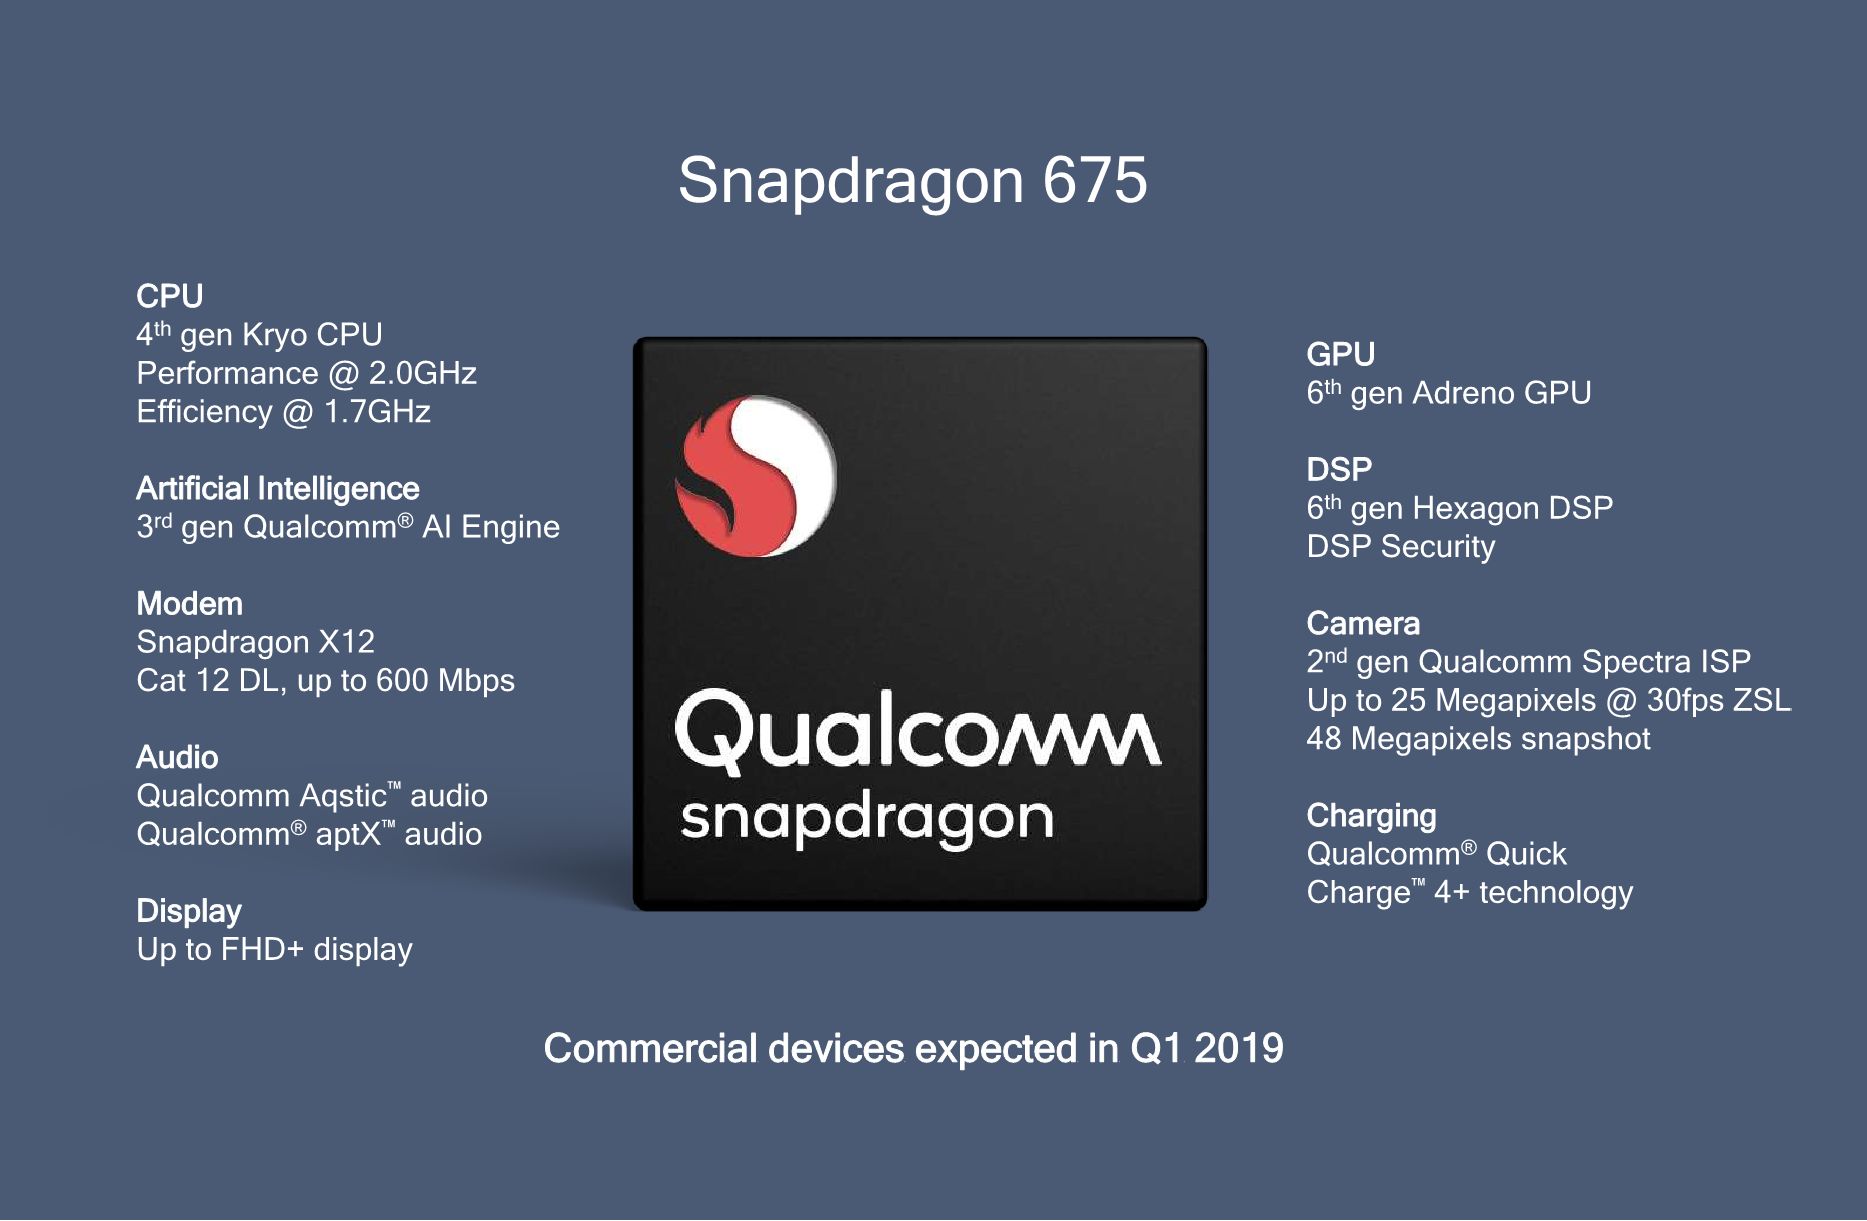
The Qualcomm Snapdragon 675 (SD675) is a fast mid-range ARM-based SoC largely found on Android tablets and smartphones. It features 8 Kryo 460 called cores (64-Bit capable) that are divided in two clusters. A fast cluster of two cores with up to 2 GHz and  based on the ARM Cortex-A76 design. And a power saving efficiency cluster with up to 1.6 GHz and based on much smaller ARM Cortex-A55 cores. Both clusters can also used together.

In addition to the 8 CPU cores, the SoC integrates a lower mid range Adreno 612 GPU, a X12 LTE Modem with up to 600 Mbps download (Cat 12) and 150 Mbps upload (Cat 13), a 802.11ac (Wifi 5) Wave 2 WLAN modem (up to 867 Mbps), a Bluetooth 5.0 radio, satellite positioning (GPS, QZSS, GLONASS, SBAS, Beidou and Galileo) and a video engine (up to 4k30 encoding and support for H.265, H.264, VP8 and VP9).

Performance

Thanks to the two fast Cortex-A76 based cores, the SD675 is able to even best the old high end Snapdragon 835 SoC in some benchmarks. The less powerful Snapdragon 670 e.g. only achieves 70 to 77% of the performance in Geekbench 4.3 (single - multi core test). Current high-end SoCs like the Snapdragon 855 however can still add 50-70% on top of the performance of the 675.

The Snapdragon 675 is produced in the new 11nm LPP (Low Power Plus) process at Samsung which is a combination of 14nm and 10nm. Compared to 14nm LPP, the 11nm LPP process should be able to increase performance by 15% and decrease the chip size by 10% according to Samsung.

Qualcomm Snapdragon 712

► remove from comparison Qualcomm SD 712

The Qualcomm Snapdragon 712 (SD712) is a fast mid-range ARM-based SoC largely found on Android tablets and smartphones. Compared to the Snapdragon 710 predecessor, the 712 offers a 10% faster CPU and GPU due to clock rate increases (100 MHz for the CPU e.g.). It was announced early 2019 and positions itself between the 600 series (e.g. Snapdragon 660) and 800 series (e.g. Snapdragon 845). It integrates 8 Kryo 360 cores devided in two big cores (most likely based on Cortex-A75 at up to 2.3 GHz) and six small cores (most likely based on Coretx-A55 at up to 1.7 or 1.8 GHz). The memory controller supports LPDDR4X and the integrated graphics card is called Adreno 616. The X15 LTE modem supports 4x4 MIMO with up to 800 MBbit/s download and 150 MBit/s upload.

The Snapdragon 712 is manufactured in the modern 10 nm process at Samsung (10LPP).

Qualcomm Snapdragon 678

► remove from comparison Qualcomm SD 678

The Qualcomm Snapdragon 678 (SD678) is a mid-range ARM-based SoC largely found on Android tablets and smartphones. It features 8 Kryo 460 called cores (64-Bit capable) that are divided in two clusters. A fast cluster of two cores with up to 2.2 GHz and  based on the ARM Cortex-A76 design. And a power saving efficiency cluster with up to 1.7 GHz and based on much smaller ARM Cortex-A55 cores. Both clusters can also used together. Compared to the old Snapdragon 675, the clock speed of the cores was increased by 200 MHz for the A76 and 100 MHz for the A55 cores.

In addition to the 8 CPU cores, the SoC integrates a lower mid range Adreno 612 GPU, a X12 LTE Modem with up to 600 Mbps download (Cat 12) and 150 Mbps upload (Cat 13), a 802.11ac (Wifi 5) Wave 2 WLAN modem (up to 867 Mbps), a Bluetooth 5.0 radio, satellite positioning (GPS, QZSS, GLONASS, SBAS, Beidou and Galileo) and a video engine (up to 4k30 encoding and support for H.265, H.264, VP8 and VP9).

Performance

Compared to the old Snapdragon 675, the 678 is only slightly faster in our benchmarks. Thanks to the two fast Cortex-A76 based cores, the SD678 is able to even best the old high end Snapdragon 835 SoC in some benchmarks.

The Snapdragon 678 is produced in the same 11nm LPP (Low Power Plus) process at Samsung as the 675 which is a combination of 14nm and 10nm. Compared to 14nm LPP, the 11nm LPP process should be able to increase performance by 15% and decrease the chip size by 10% according to Samsung.

ModelQualcomm Snapdragon 675Qualcomm Snapdragon 712Qualcomm Snapdragon 678
SeriesQualcomm SnapdragonQualcomm SnapdragonQualcomm Snapdragon
CodenameKryo 460 Gold (Cortex-A76) / Silver (Cortex-A55)Kryo 360Kryo 460 Gold (Cortex-A76) / Silver (Cortex-A55)
Series: Snapdragon Kryo 460 Gold (Cortex-A76) / Silver (Cortex-A55)
Qualcomm Snapdragon 6781.7 - 2.2 GHz8 / 8 cores Kryo 460 Gold (Cortex-A76) / Silver (Cortex-A55)
Qualcomm Snapdragon 675 « 1.6 - 2 GHz8 / 8 cores Kryo 460 Gold (Cortex-A76) / Silver (Cortex-A55)
Qualcomm Snapdragon 712 « 2.3 GHz8 / 8 cores Kryo 360
Qualcomm Snapdragon 7102.2 GHz8 / 8 cores Kryo 360
Qualcomm Snapdragon 678 « 1.7 - 2.2 GHz8 / 8 cores Kryo 460 Gold (Cortex-A76) / Silver (Cortex-A55)
Qualcomm Snapdragon 6751.6 - 2 GHz8 / 8 cores Kryo 460 Gold (Cortex-A76) / Silver (Cortex-A55)
Clock1600 - 2000 MHz2300 MHz1700 - 2200 MHz
Cores / Threads8 / 88 / 88 / 8
Technology11 nm10 nm11 nm
FeaturesAdreno 612 GPU, X12 LTE Modem, Hexagon 685 DSP, Spectra 250L ISPAdreno 616 GPU, X15 LTE Modem, Hexagon 685 DSP, Specra ISPAdreno 612 GPU, X12 LTE Modem, Hexagon 685 DSP, Spectra 250L ISP
iGPUQualcomm Adreno 612Qualcomm Adreno 616Qualcomm Adreno 612
ArchitectureARMARMARM
Announced
Manufacturerwww.qualcomm.comwww.qualcomm.comwww.qualcomm.com

Benchmarks

Performance Rating - Geekbench 5.5, PCM Work, Sling Shot Physics, Antutu v8 CPU - SD 678
0.6 pt (42%)
3DMark - 3DMark Ice Storm Unlimited Physics
min: 15461     avg: 17199     median: 16912 (14%)     max: 19511 Points
min: 13686     avg: 13692     median: 13692 (12%)     max: 13698 Points
19549 Points (16%)
3DMark - 3DMark Sling Shot Extreme (ES 3.1) Unlimited Physics
min: 1684     avg: 2448     median: 2548.5 (30%)     max: 3011 Points
min: 1982     avg: 2244     median: 2244 (26%)     max: 2506 Points
3156 Points (37%)
3DMark - 3DMark Sling Shot (ES 3.0) Unlimited Physics
min: 1657     avg: 2433     median: 2546 (29%)     max: 2984 Points
min: 1946     avg: 2226     median: 2226 (25%)     max: 2506 Points
2769 Points (32%)
Geekbench 5.5 - Geekbench 5.1 - 5.4 64 Bit Single-Core
100%
1 SD 675 +
486 Points (21%)
109%
1 SD 678 +
531 Points (22%)
Geekbench 5.5 - Geekbench 5.1 - 5.4 64 Bit Multi-Core
100%
1 SD 675 +
924 Points (2%)
167%
1 SD 678 +
1541 Points (3%)
Geekbench 5.0 - Geekbench 5.0 64 Bit Single-Core
100%
1 SD 675 +
min: 492     avg: 501     median: 504 (2%)     max: 506 Points
63%
1 SD 712 +
317 Points (1%)
Geekbench 5.0 - Geekbench 5.0 64 Bit Multi-Core
100%
1 SD 675 +
min: 939     avg: 1389     median: 1610 (5%)     max: 1618 Points
93%
1 SD 712 +
1491 Points (5%)
Geekbench 4.4 - Geekbench 4.1 - 4.4 64 Bit Single-Core
min: 2266     avg: 2323     median: 2323 (23%)     max: 2380 Points
1875 Points (19%)
2483 Points (25%)
Geekbench 4.4 - Geekbench 4.1 - 4.4 64 Bit Multi-Core
min: 5998     avg: 6222     median: 6222 (7%)     max: 6446 Points
5975 Points (7%)
6570 Points (7%)
Geekbench 4.0 - Geekbench 4.0 64 Bit Single-Core
2376 Points (32%)
0 Points (0%)
2570 Points (35%)
Geekbench 4.0 - Geekbench 4.0 64 Bit Multi-Core
100%
1 SD 675 +
6554 Points (16%)
97%
1 SD 678 +
6381 Points (16%)
Geekbench 3 - Geekbench 3 64 Bit Multi-Core
100%
1 SD 675 +
5667 Points (9%)
Geekbench 3 - Geekbench 3 64 Bit Single-Core
100%
1 SD 675 +
1893 Points (28%)
Geekbench 3 - Geekbench 3 32 Bit Single-Core
0 Points (0%)
100%
1 SD 678 +
2219 Points (43%)
Geekbench 3 - Geekbench 3 32 Bit Multi-Core
100%
1 SD 678 +
5674 Points (10%)
Geekbench 2 - 32 Bit - Geekbench Stream
2251 Points (18%)
2067 Points (17%)
2183 Points (18%)
Geekbench 2 - 32 Bit - Geekbench Memory
2956 Points (27%)
3044 Points (28%)
2812 Points (25%)
Geekbench 2 - 32 Bit - Geekbench Floating Point
11428 Points (22%)
12082 Points (24%)
12166 Points (24%)
Geekbench 2 - 32 Bit - Geekbench Integer
5292 Points (11%)
5511 Points (11%)
5669 Points (11%)
Geekbench 2 - 32 Bit - Geekbench Total Score
6668 Points (17%)
6973 Points (18%)
7022 Points (18%)
Mozilla Kraken 1.1 - Kraken 1.1 Total Score *
min: 2807     avg: 2849     median: 2848.5 (3%)     max: 2890 ms
min: 2912     avg: 3648     median: 3647.5 (4%)     max: 4383 ms
2750 ms (3%)
Octane V2 - Octane V2 Total Score
min: 15689     avg: 15703     median: 15702.5 (14%)     max: 15716 Points
min: 10328     avg: 11945     median: 11945 (11%)     max: 13562 Points
15828 Points (14%)
WebXPRT 3 - WebXPRT 3 Score
min: 70     avg: 76     median: 76 (16%)     max: 82 Points
min: 47     avg: 59.5     median: 59.5 (12%)     max: 72 Points
71 Points (15%)
AnTuTu v6 - AnTuTu v6 Total Score
100%
1 SD 675 +
130196 Points (44%)
111%
1 SD 712 +
144396 Points (49%)
AnTuTu v7 - AnTuTu v7 MEM
100%
1 SD 675 +
min: 9191     avg: 10080     median: 10079.5 (31%)     max: 10968 Points
85%
1 SD 712 +
8592 Points (26%)
AnTuTu v7 - AnTuTu v7 UX
100%
1 SD 675 +
min: 42419     avg: 43904     median: 43904 (54%)     max: 45389 Points
106%
1 SD 712 +
46430 Points (57%)
AnTuTu v7 - AnTuTu v7 GPU
100%
1 SD 675 +
min: 33571     avg: 33624     median: 33623.5 (10%)     max: 33676 Points
167%
1 SD 712 +
55997 Points (17%)
AnTuTu v7 - AnTuTu v7 CPU
100%
1 SD 675 +
min: 75583     avg: 77634     median: 77634 (48%)     max: 79685 Points
88%
1 SD 712 +
68334 Points (42%)
AnTuTu v7 - AnTuTu v7 Total Score
100%
1 SD 675 +
min: 159646     avg: 163741     median: 163741 (29%)     max: 167836 Points
110%
1 SD 712 +
179353 Points (32%)
AnTuTu v8 - AnTuTu v8 UX
100%
1 SD 712 +
38440 Points (32%)
134%
1 SD 678 +
51338 Points (43%)
AnTuTu v8 - AnTuTu v8 MEM
100%
1 SD 712 +
41759 Points (34%)
118%
1 SD 678 +
49402 Points (40%)
AnTuTu v8 - AnTuTu v8 GPU
100%
1 SD 712 +
61715 Points (11%)
51%
1 SD 678 +
31202 Points (6%)
AnTuTu v8 - AnTuTu v8 CPU
100%
1 SD 712 +
76522 Points (28%)
123%
1 SD 678 +
94453 Points (34%)
AnTuTu v8 - AnTuTu v8 Total Score
100%
1 SD 712 +
218436 Points (21%)
104%
1 SD 678 +
226395 Points (22%)
Antutu v9 - AnTuTu v9 Total Score
100%
1 SD 678 +
275441 Points (17%)
Antutu v9 - AnTuTu v9 CPU
100%
1 SD 678 +
101216 Points (28%)
PassMark PerformanceTest Mobile V1 - PerformanceTest Mobile V1 CPU Tests
190355 Points (25%)
185962 Points (24%)
2743 Points (0%)
PCMark for Android - PCM f. Android Computer Vision
min: 3707     avg: 3748     median: 3748 (20%)     max: 3789 Points
3481 Points (18%)
3846 Points (20%)
PCMark for Android - PCM f. Android Storage
min: 6738     avg: 8585     median: 8585 (18%)     max: 10432 Points
7059 Points (15%)
10456 Points (22%)
PCMark for Android - PCM f. Android Work Score 2.0
min: 7315     avg: 7660     median: 7688 (50%)     max: 7950 Points
min: 6832     avg: 7554     median: 7554 (49%)     max: 8276 Points
7011 Points (46%)
PCMark for Android - PCM f. Android Work Score
min: 9288     avg: 9371     median: 9304 (47%)     max: 9522 Points
min: 8346     avg: 9745     median: 9744.5 (49%)     max: 11143 Points
8220 Points (41%)
PCMark for Android - PCM f. Android Storage 2.0 score
100%
1 SD 678 +
11488 Points (18%)
PCMark for Android - PCM f. Android Work Score 3.0
100%
1 SD 678 +
7645 Points (35%)

Average Benchmarks Qualcomm Snapdragon 675 → 100% n=19

Average Benchmarks Qualcomm Snapdragon 712 → 88% n=19

Average Benchmarks Qualcomm Snapdragon 678 → 99% n=19

- Range of benchmark values for this graphics card
- Average benchmark values for this graphics card
* Smaller numbers mean a higher performance
1 This benchmark is not used for the average calculation

v1.26
log 27. 23:05:26

#0 checking url part for id 11403 +0s ... 0s

#1 checking url part for id 11301 +0s ... 0s

#2 checking url part for id 13220 +0s ... 0s

#3 not redirecting to Ajax server +0s ... 0s

#4 did not recreate cache, as it is less than 5 days old! Created at Thu, 25 Apr 2024 05:38:32 +0200 +0.001s ... 0.001s

#5 composed specs +0.037s ... 0.038s

#6 did output specs +0s ... 0.038s

#7 getting avg benchmarks for device 11403 +0.003s ... 0.04s

#8 got single benchmarks 11403 +0.018s ... 0.058s

#9 getting avg benchmarks for device 11301 +0.003s ... 0.06s

#10 got single benchmarks 11301 +0.012s ... 0.073s

#11 getting avg benchmarks for device 13220 +0.015s ... 0.087s

#12 got single benchmarks 13220 +0.007s ... 0.094s

#13 got avg benchmarks for devices +0s ... 0.094s

#14 No cached benchmark found, getting uncached values +0.09s ... 0.184s

#15 No cached benchmark found, getting uncached values +0.011s ... 0.195s

#16 min, max, avg, median took s +0.123s ... 0.317s

#17 return log +0s ... 0.317s

Please share our article, every link counts!
> Expert Reviews and News on Laptops, Smartphones and Tech Innovations > Benchmarks / Tech > Processor Comparison - Head 2 Head
Redaktion, 2017-09- 8 (Update: 2023-07- 1)