 Deutsch
 English
 Español
 Français
 Italiano
 Nederlands
 Polski
 Português
 Русский
 Türkçe
 Svenska
 Chinese
 Magyar
Rockchip RK3288 vs HiSilicon Kirin 658
Rockchip RK3288
► remove from comparison
The Rockchip RK3288 is a mid-range ARM SoC for Android and Chrome OS mobile systems. It integrates four Cortex-A12 cores clocked at up to 1.8 GHz. ARM calls these cores Cortex-A17 due to them having very similar performance levels. The SoC includes an ARM Mali-T760 MP4 (also called Mali-T764) GPU clocked at 600 MHz and a dual-channel DDR3, DDR3L, LPDDR2, LPDDR3 memory controller.
The ARM Cortex-A12 is the successor to the Cortex-A9 and is based on a 32 Bit ARMv7-A microarchitecture. A single A12 core should be roughly 40 % more powerful than an A9 core according to ARM.
The integrated video engine supports encoding of H.264, VP8, and MVC videos up to 1080p. Decoding is supported for videos up to 4K H.264 and 10 Bit H.265.
The chip is manufactured under a 28 nm HKMG process.
HiSilicon Kirin 658
► remove from comparison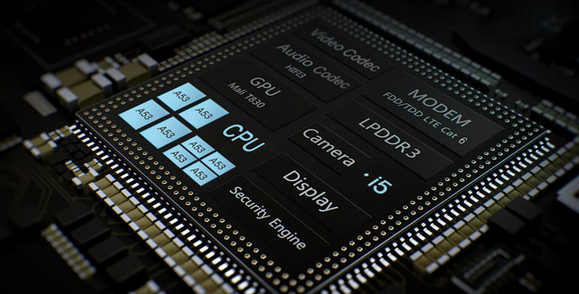
The HiSilicon Kirin 658 is an ARM-based octa-core SoC for mid-range smartphones and tablets. It was announced early 2017 and features eight ARM Cortex-A53 cores. Four cores can be clocked with up to 1.7 GHz (power saving cores) and four with up to 2.35 GHz (performance cores). The difference to the older Kirin 650 and Kirin 655 SoCs is the higher clock speed of the performance cores (2.35 versus 2.1 and 2.0 GHz).
Furthermore, a ARM Mali-T830 MP2 graphics card (at 900 MHz with 40.8 GFLOPS), a 64-Bit LPDDR3 memory controller and a dual-sim capable LTE Cat. 6 (max. 300 MBit/s and GSM, WCDMA, UMTS, HSPA+) radio are integrated in the SoC. The processor performance can be compared with the older Kirin 930 and therefore sufficient for daily usage as browsing and non demanding apps. High-end SoCs with Cortex-A57 or A72 cores however should be noticeably faster. The SoC is produced in a modern 16nm FinFET process and is therefore very power efficient.
| Model | Rockchip RK3288 | HiSilicon Kirin 658 | ||||||||||||||||||||||||||||||||||||||||||||||||||||||||||||||||||||||||||||||||||||||||||||||||||||||||||||||||||||||||||||
| Series | ||||||||||||||||||||||||||||||||||||||||||||||||||||||||||||||||||||||||||||||||||||||||||||||||||||||||||||||||||||||||||||||
| Series: Cortex-A53 |
|
| ||||||||||||||||||||||||||||||||||||||||||||||||||||||||||||||||||||||||||||||||||||||||||||||||||||||||||||||||||||||||||||
| Clock | 1800 MHz | 2350 MHz | ||||||||||||||||||||||||||||||||||||||||||||||||||||||||||||||||||||||||||||||||||||||||||||||||||||||||||||||||||||||||||||
| Cores / Threads | 4 / 4 | 8 / 8 | ||||||||||||||||||||||||||||||||||||||||||||||||||||||||||||||||||||||||||||||||||||||||||||||||||||||||||||||||||||||||||||
| Technology | 28 nm | 16 nm | ||||||||||||||||||||||||||||||||||||||||||||||||||||||||||||||||||||||||||||||||||||||||||||||||||||||||||||||||||||||||||||
| Features | ARM MAli-T624 at 600 MHz, dedicated 2D processor, 1080P H.264, VP8, MVC encoding, 4K H.264 and 10 Bits H.265 decoding, 1080p multi video decode, Dual-channel DDR3(L) memory controller, HDMI 2.0 | ARMv8-ISA, Mali-T830 MP2, Dual SIM LTE (Cat. 6), LPDDR3 Memory Controller | ||||||||||||||||||||||||||||||||||||||||||||||||||||||||||||||||||||||||||||||||||||||||||||||||||||||||||||||||||||||||||||
| iGPU | ARM Mali-T760 MP4 (600 MHz) | ARM Mali-T830 MP2 (900 MHz) | ||||||||||||||||||||||||||||||||||||||||||||||||||||||||||||||||||||||||||||||||||||||||||||||||||||||||||||||||||||||||||||
| Architecture | ARM | ARM | ||||||||||||||||||||||||||||||||||||||||||||||||||||||||||||||||||||||||||||||||||||||||||||||||||||||||||||||||||||||||||||
| Announced | ||||||||||||||||||||||||||||||||||||||||||||||||||||||||||||||||||||||||||||||||||||||||||||||||||||||||||||||||||||||||||||||
| Manufacturer | www.rk3288.com | |||||||||||||||||||||||||||||||||||||||||||||||||||||||||||||||||||||||||||||||||||||||||||||||||||||||||||||||||||||||||||||
| Codename | Cortex-A53 | |||||||||||||||||||||||||||||||||||||||||||||||||||||||||||||||||||||||||||||||||||||||||||||||||||||||||||||||||||||||||||||

