Vivante GC1000+ Dual-Core vs
Vivante GC1000+ Dual-Core ► remove from comparison
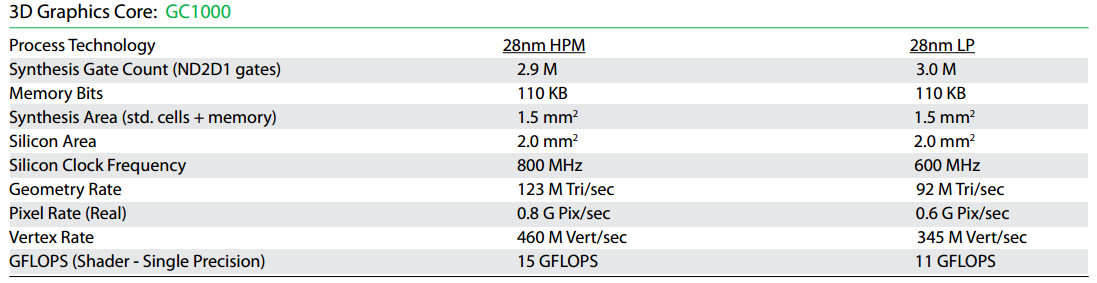
The Vivante GC1000+ Dual-Core is an integrated graphics card for ARM based SoCs. It supports Android, Windows Mobile 6, Windows CE and Linux and the standards OpenGL ES 2.0, OpenGL 2.1, OpenVG 1.1, and DirectX 11 (9_3). The chip is can be clocked with up to 600 MHz (28nm LP) or 800 MHz (28nm HPM). The theoretical calculating power of the GPU is 50 Mio triangles / s, 650 Mio pixels / s and 12 GFLOPS (according to cnx-software.com ). According to Vivante however the GC1000 is capable of 345 to 460 Mio triangles /s and 11 to 15 GFLOPS.
Vivante GC1000+ Dual-Core Series Shared Memory no Pipelines 2 - unified Core Speed 600 / 800 MHz API DirectX 9_3, OpenGL 2.1 / ES 2.0 Date of Announcement 12.09.2013
CPU in GPU Base Speed GPU Boost / Turbo NXP i.MX 6SLL 1 x 1000 MHz ? MHz ? MHz
Benchmarks 3DMark - 3DMark Time Spy Score
1415 Points (4%)
Model CPU GPU RAM Value Apple MacBook Pro 15 2019 i7 555X unknown unknown 1415
3DMark - 3DMark Time Spy Graphics
1257 Points (3%)
Model CPU GPU RAM Value Apple MacBook Pro 15 2019 i7 555X unknown unknown 1257
3DMark - 3DMark Ice Storm Unlimited Graphics
min: 2237 avg: 2329 median: 2373 (0%) max: 2377 Points
260552 Points (30%)
Model CPU GPU RAM Value Apple MacBook Pro 15 2019 i7 555X unknown unknown 260552
3DMark - 3DMark Ice Storm Extreme Graphics
min: 997 avg: 1177 median: 1207.5 (0%) max: 1295 Points
3DMark - 3DMark Cloud Gate Score
18705 Points (20%)
Model CPU GPU RAM Value Apple MacBook Pro 15 2019 i7 555X unknown unknown 18705
3DMark - 3DMark Cloud Gate Graphics
27236 Points (7%)
Model CPU GPU RAM Value Apple MacBook Pro 15 2019 i7 555X unknown unknown 27236
3DMark - 3DMark Fire Strike Standard Score
4075 Points (7%)
Model CPU GPU RAM Value Apple MacBook Pro 15 2019 i7 555X unknown unknown 4075
3DMark - 3DMark Ice Storm Graphics
min: 1912 avg: 2310 median: 2255 (0%) max: 2694 Points
3DMark - 3DMark Sling Shot Extreme (ES 3.1) Unlimited
min: 1817 avg: 5243 median: 5242.5 (26%) max: 8668 Points
Model CPU GPU RAM Value Vivo V40 SE 5G unknown unknown 8 GB 1817 Huawei Pura 70 Ultra unknown unknown 16 GB 8668
3DMark - 3DMark Sling Shot Extreme (ES 3.1) Unlimited Graphics
min: 1591 avg: 5760 median: 5759.5 (17%) max: 9928 Points
Model CPU GPU RAM Value Vivo V40 SE 5G unknown unknown 8 GB 1591 Huawei Pura 70 Ultra unknown unknown 16 GB 9928
3DMark - 3DMark Wild Life Unlimited
min: 665 avg: 3161 median: 3160.5 (2%) max: 5656 Points
Model CPU GPU RAM Value Vivo V40 SE 5G unknown unknown 8 GB 665 Huawei Pura 70 Ultra unknown unknown 16 GB 5656
3DMark - 3DMark Wild Life Extreme Unlimited
min: 155 avg: 847 median: 847 (1%) max: 1539 Points
Model CPU GPU RAM Value Vivo V40 SE 5G unknown unknown 8 GB 155 Huawei Pura 70 Ultra unknown unknown 16 GB 1539
GFXBench - GFXBench 5.0 4K Aztec Ruins High Tier Offscreen
min: 1.7 avg: 7.4 median: 7.4 (3%) max: 13 fps
Model CPU GPU RAM Value Vivo V40 SE 5G unknown unknown 8 GB 1.7 Huawei Pura 70 Ultra unknown unknown 16 GB 13
GFXBench - GFXBench 5.0 Aztec Ruins High Tier Offscreen
min: 4 avg: 17 median: 17 (3%) max: 30 fps
Model CPU GPU RAM Value Vivo V40 SE 5G unknown unknown 8 GB 4 Huawei Pura 70 Ultra unknown unknown 16 GB 30
GFXBench - GFXBench 5.0 Aztec Ruins Normal Tier Offscreen
min: 11 avg: 46.5 median: 46.5 (3%) max: 82 fps
Model CPU GPU RAM Value Vivo V40 SE 5G unknown unknown 8 GB 11 Huawei Pura 70 Ultra unknown unknown 16 GB 82
GFXBench - GFXBench Car Chase Offscreen
min: 9.6 avg: 32.3 median: 32.3 (4%) max: 55 fps
Model CPU GPU RAM Value Vivo V40 SE 5G unknown unknown 8 GB 9.6 Huawei Pura 70 Ultra unknown unknown 16 GB 55
GFXBench 3.1 - GFXBench Manhattan ES 3.1 Offscreen
min: 19 avg: 74 median: 74 (2%) max: 129 fps
Model CPU GPU RAM Value Vivo V40 SE 5G unknown unknown 8 GB 19 Huawei Pura 70 Ultra unknown unknown 16 GB 129
GFXBench 3.0 - GFXBench 3.0 Manhattan Offscreen
0 fps (0%)
min: 27 avg: 105 median: 105 (6%) max: 183 fps
Model CPU GPU RAM Value Vivo V40 SE 5G unknown unknown 8 GB 27 Huawei Pura 70 Ultra unknown unknown 16 GB 183
GFXBench (DX / GLBenchmark) 2.7 + Vivante GC1000+ Dual-Core GFXBench (DX / GLBenchmark) 2.7 - GFXBench T-Rex HD Offscreen C24Z16
min: 2.5 avg: 2.8 median: 2.7 (0%) max: 3.3 fps
GFXBench T-Rex HD Offscreen C24Z16 +
min: 54 avg: 198 median: 198 (2%) max: 342 fps
Model CPU GPU RAM Value Vivo V40 SE 5G unknown unknown 8 GB 54 Huawei Pura 70 Ultra unknown unknown 16 GB 342
AnTuTu 3DRating - Antutu 3DRating Off-screen
1651 Points (57%)
AnTuTu 3DRating - Antutu 3DRating Score
4981 Points (44%)
AnTuTu v3 - AnTuTu v3 GPU
5503 Points (57%)
Basemark ES 2.0 - Basemark ES 2.0
min: 13.87 avg: 18 median: 20.1 (33%) max: 20.09 fps
Basemark X 1.0 - Basemark X 1.0 Off-Screen
min: 1.246 avg: 1.8 median: 1.8 (8%) max: 2.262 fps
Basemark GPU 1.2 - Basemark GPU 1.2 Vulkan Official Medium Offscreen 1080
17.2 fps (0%)
Model CPU GPU RAM Value Vivo V40 SE 5G unknown unknown 8 GB 17.23
NenaMark2 - NenaMark2 Score
min: 38.2 avg: 48.8 median: 49.5 (74%) max: 58 fps
Geekbench 6.2 - Geekbench 6.2 GPU OpenCL
min: 411 avg: 2076 median: 2076 (1%) max: 3741 Points
Model CPU GPU RAM Value Vivo V40 SE 5G unknown unknown 8 GB 411 Huawei Pura 70 Ultra unknown unknown 16 GB 3741
Geekbench 6.2 - Geekbench 6.2 GPU Vulkan
626 Points (0%)
Model CPU GPU RAM Value Huawei Pura 70 Ultra unknown unknown 16 GB Vivo V40 SE 5G unknown unknown 8 GB 626
PassMark PerformanceTest Mobile V1 - PerformanceTest Mobile V1 2D Graphics Tests
min: 1549 avg: 1910 median: 1798 (2%) max: 2667 Points
PassMark PerformanceTest Mobile V1 - PerformanceTest Mobile V1 3D Graphics Tests
min: 682 avg: 707 median: 688 (1%) max: 753 Points
Smartbench 2012 - Smartbench 2012 Gaming Index
min: 1832 avg: 2304 median: 2322 (50%) max: 2758 Points
1254 Points (27%)
Model CPU GPU RAM Value Archos Arnova 10 unknown unknown 1254
Average Benchmarks Vivante GC1000+ Dual-Core → 0% n= Average Benchmarks → 0% n=
- Range of benchmark values for this graphics card
- Average benchmark values for this graphics card
* Smaller numbers mean a higher performance
1 This benchmark is not used for the average calculation
Game Benchmarks The following benchmarks stem from our benchmarks of review laptops. The performance depends on the used graphics memory, clock rate, processor, system settings, drivers, and operating systems. So the results don't have to be representative for all laptops with this GPU. For detailed information on the benchmark results, click on the fps number.
low med. high ultra QHD 4K Dead Trigger 2 56 < 30 fps < 60 fps < 120 fps ≥ 120 fps 1
For more games that might be playable and a list of all games and graphics cards visit our Gaming List
v1.27
log 17. 11:35:08
#0 checking url part for id 9963 +0s ... 0s
#1 checking url part for id 4572 +0s ... 0s
#2 checking url part for id 2375 +0s ... 0s
#3 not redirecting to Ajax server +0s ... 0s
#4 did not recreate cache, as it is less than 5 days old! Created at Sun, 16 Jun 2024 05:38:48 +0200 +0.001s ... 0.001s
#5 composed specs +0.103s ... 0.104s
#6 did output specs +0s ... 0.104s
#7 start showIntegratedCPUs +0s ... 0.104s
#8 getting avg benchmarks for device 9963 +0.039s ... 0.143s
#9 got single benchmarks 9963 +0.006s ... 0.149s
#10 getting avg benchmarks for device 4572 +0.002s ... 0.151s
#11 got single benchmarks 4572 +0.013s ... 0.164s
#12 getting avg benchmarks for device 2375 +0.002s ... 0.166s
#13 got single benchmarks 2375 +0.25s ... 0.416s
#14 got avg benchmarks for devices +0s ... 0.416s
#15 No cached benchmark found, getting uncached values +0.074s ... 0.489s
#16 min, max, avg, median took s +0.035s ... 0.524s
#17 before gaming benchmark output +0s ... 0.524s
#18 Got 1 rows for game benchmarks. +0.008s ... 0.532s
#19 composed SQL query for gamebenchmarks +0s ... 0.532s
#20 got data and put it in $dataArray +0s ... 0.533s
#21 benchmarks composed for output. +0.003s ... 0.535s
#22 calculated avg scores. +0s ... 0.535s
#23 return log +0.002s ... 0.537s
Please share our article, every link counts!
Redaktion, 2017-09- 8 (Update: 2023-07- 1)
 Deutsch
 English
 Español
 Français
 Italiano
 Nederlands
 Polski
 Português
 Русский
 Türkçe
 Svenska
 Chinese
 Magyar