ARM Mali-T880 MP12 vs Qualcomm Adreno 512
ARM Mali-T880 MP12 ► remove from comparison
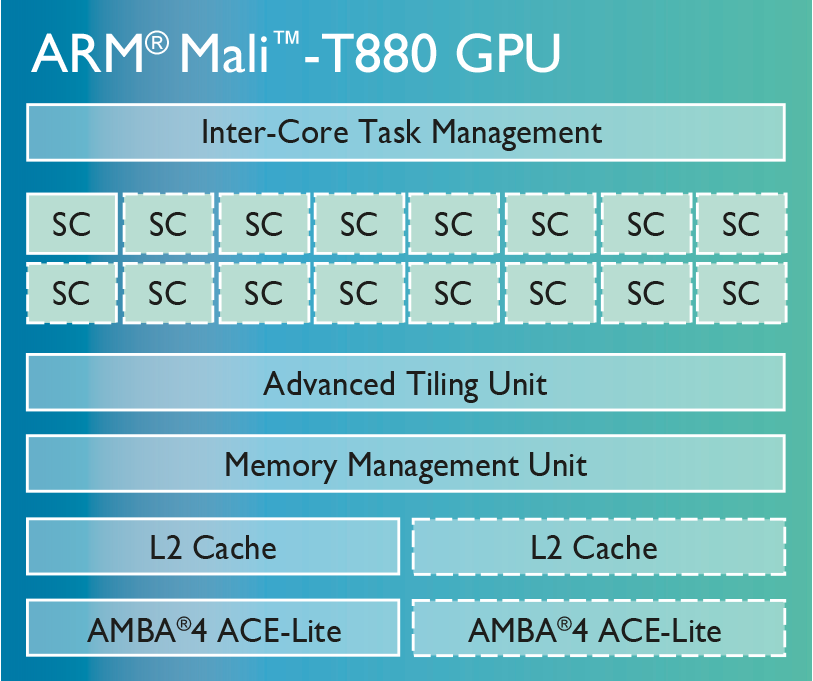
The ARM Mali-T880 MP12 is a mobile graphics solution that can be found in ARM SoCs like the Samsung Exynos 8890. The chip is available since Q1/2016 (e.g. in some of the Galaxy S7 variants) and supports OpenGL ES 3.1, OpenCL 1.2 and DirectX 11.2 (FL 11_2). The Mali-T880 can be built with 1 to 16 clusters, where the MP12 version features 12 clusters/cores.
The MP12 version that is used in the Samsung Exynos 8890 is clocked with up to 650 MHz and is a bit slower than the Adreno 530 in the Snapdragon 820 SoC . However, it still belongs to the high-end graphics cards for ARM based SoCs.
Qualcomm Adreno 512 ► remove from comparison
The Qualcomm Adreno 512 is a mobile graphics card for mid-range smartphones and tablets (mostly Android based). It is included in the Qualcomm Snapdragon 660 SoCs and based on the Adreno 500 architecture (like the Adreno 520 in the S820, which should be fully compatible in software).
According to Qualcomm up to 30% faster than the previous generation (Adreno 510?).
The GPU supports modern standards like Vulkan 1.0 (according to Wikipedia), OpenGL ES 3.1 + AE (3.2 in other sources), OpenCL 2.0 and DirectX 12 (FL 12.1 according to Wikipedia, 11.1 according to Qualcomm). Furthermore, the GPU supports Universal Bandwidth Compression (UBWC) to save memory bandwidth.
ARM Mali-T880 MP12 Qualcomm Adreno 512 Adreno 500 Series Codename Midgard (4th Generation) Architecture Midgard (4rd-gen) Adreno 500 Pipelines 12 - unified Core Speed 650 (Boost) MHz Shared Memory no yes API DirectX 11.2 (FL 11_2), OpenGL ES 3.1 DirectX 12.1, OpenGL ES 3.2, Vulkan technology 14 nm 14 nm Features OpenGL ES 3.1, OpenCL 1.2, DirectX 11.2 (FL 11_2) OpenGL ES 3.2, OpenCL 2.0, Direct3D 12 (FL 12_1) Date of Announcement 24.02.2016 15.12.2015 Link to Manufacturer Page www.arm.com
Benchmarks 3DMark - 3DMark Ice Storm Unlimited Graphics
min: 23431 avg: 29937 median: 33031 (4%) max: 33348 Points
min: 25561 avg: 28454 median: 29060 (3%) max: 29496 Points
3DMark - 3DMark Sling Shot (ES 3.0) Unlimited
min: 2641 avg: 2644 median: 2644 (11%) max: 2647 Points
min: 1887 avg: 2062 median: 2120 (9%) max: 2161 Points
3DMark - 3DMark Sling Shot (ES 3.0) Unlimited Graphics
min: 3059 avg: 3065 median: 3065 (7%) max: 3071 Points
min: 1734 avg: 1942 median: 2001 (4%) max: 2033 Points
3DMark - 3DMark Sling Shot Extreme (ES 3.1) Unlimited
min: 2060 avg: 2147 median: 2147 (11%) max: 2234 Points
min: 1270 avg: 1400 median: 1432 (7%) max: 1442 Points
3DMark - 3DMark Sling Shot Extreme (ES 3.1) Unlimited Graphics
min: 2257 avg: 2326 median: 2325.5 (7%) max: 2394 Points
min: 1134 avg: 1237 median: 1257 (4%) max: 1268 Points
GFXBench - GFXBench 5.0 Aztec Ruins High Tier Offscreen
min: 3 avg: 3.2 median: 3.2 (1%) max: 3.3 fps
GFXBench - GFXBench 5.0 Aztec Ruins Normal Tier Offscreen
min: 7.9 avg: 8.6 median: 8.6 (1%) max: 8.8 fps
GFXBench - GFXBench Car Chase Offscreen
15 fps (2%)
min: 8 avg: 8.8 median: 9 (1%) max: 9.1 fps
GFXBench 3.1 - GFXBench Manhattan ES 3.1 Offscreen
min: 26 avg: 27.3 median: 28 (1%) max: 28 fps
min: 8.2 avg: 13.6 median: 15 (0%) max: 15 fps
GFXBench 3.0 - GFXBench 3.0 Manhattan Offscreen
min: 38 avg: 39 median: 39 (2%) max: 40 fps
min: 20 avg: 22.1 median: 22.5 (1%) max: 23 fps
GFXBench (DX / GLBenchmark) 2.7 + ARM Mali-T880 MP12 GFXBench (DX / GLBenchmark) 2.7 - GFXBench T-Rex HD Offscreen C24Z16
min: 80 avg: 82 median: 82 (1%) max: 84 fps
GFXBench T-Rex HD Offscreen C24Z16 + Qualcomm Adreno 512 min: 43 avg: 48.4 median: 50 (0%) max: 51 fps
Basemark X 1.1 - Basemark X 1.1 High Quality
min: 19134 avg: 27168 median: 30097 (68%) max: 32273 Points
Basemark X 1.1 - Basemark X 1.1 Medium Quality
min: 40252 avg: 40672 median: 40671.5 (90%) max: 41091 Points
Basemark GPU 1.2 - Basemark GPU 1.2 Vulkan Official Medium Offscreen 1080
12.8 fps (0%)
PassMark PerformanceTest Mobile V1 - PerformanceTest Mobile V1 2D Graphics Tests
min: 5864 avg: 6100 median: 6055 (6%) max: 6382 Points
min: 6741 avg: 13532 median: 6900 (7%) max: 26954 Points
PassMark PerformanceTest Mobile V1 - PerformanceTest Mobile V1 3D Graphics Tests
min: 2094 avg: 2132 median: 2131 (4%) max: 2172 Points
min: 2286 avg: 6896 median: 2290 (4%) max: 16113 Points
Average Benchmarks ARM Mali-T880 MP12 → 100% n=11 Average Benchmarks Qualcomm Adreno 512 → 73% n=11
- Range of benchmark values for this graphics card
- Average benchmark values for this graphics card
* Smaller numbers mean a higher performance
1 This benchmark is not used for the average calculation
Game Benchmarks The following benchmarks stem from our benchmarks of review laptops. The performance depends on the used graphics memory, clock rate, processor, system settings, drivers, and operating systems. So the results don't have to be representative for all laptops with this GPU. For detailed information on the benchmark results, click on the fps number.
Adreno 512:
24 30 ~ 27 fps
Adreno 512:
30 [X] Nokia 7 Plus Qualcomm Snapdragon 660 2.2GHz
Adreno 512
min:
28 fps, max:
31 fps
60 [X] Xiaomi Mi 6X Qualcomm Snapdragon 660 2.2GHz
Adreno 512
min:
45 fps, max:
60 fps
~ 45 fps
Adreno 512:
30 60 [X] BlackBerry Key2 1.23.1.2
Qualcomm Snapdragon 660 2.2GHz
Adreno 512
min:
47 fps, max:
60 fps
60 ~ 50 fps
Adreno 512:
60 [X] BlackBerry Key2 1.11.1
Qualcomm Snapdragon 660 2.2GHz
Adreno 512
min:
25 fps, max:
60 fps
fps
100%
Mali-T880 MP12:
55 56 56 ~ 56 fps
54%
Adreno 512:
30 [X] Nokia 7 Plus Qualcomm Snapdragon 660 2.2GHz
Adreno 512
min:
29 fps, max:
31 fps
30 [X] Xiaomi Mi 6X Qualcomm Snapdragon 660 2.2GHz
Adreno 512
min:
27 fps, max:
31 fps
~ 30 fps
100%
Mali-T880 MP12:
30 30 ~ 30 fps
100%
Mali-T880 MP12:
30 30 31 ~ 30 fps
97%
Adreno 512:
28 [X] Xiaomi Mi 6X Qualcomm Snapdragon 660 2.2GHz
Adreno 512
min:
27 fps, max:
30 fps
29 [X] Nokia 7 Plus Qualcomm Snapdragon 660 2.2GHz
Adreno 512
min:
26 fps, max:
30 fps
30 ~ 29 fps
Adreno 512:
28 28 ~ 28 fps
100%
Mali-T880 MP12:
44 fps
100%
Mali-T880 MP12:
60 fps
Average Gaming ARM Mali-T880 MP12 → 100% Average Gaming 30-70 fps → 100%
Average Gaming Qualcomm Adreno 512 → 75% ARM Mali-T880 MP12 low med. high ultra QHD 4K Dead Trigger 2 56 Asphalt 8: Airborne 30 30 Real Racing 3 44 Temple Run 2 60 < 30 fps < 60 fps < 120 fps ≥ 120 fps 1 3 1
For more games that might be playable and a list of all games and graphics cards visit our Gaming List
v1.26
log 29. 13:33:39
#0 checking url part for id 7237 +0s ... 0s
#1 checking url part for id 8778 +0s ... 0s
#2 not redirecting to Ajax server +0s ... 0s
#3 did not recreate cache, as it is less than 5 days old! Created at Sun, 28 Apr 2024 05:41:30 +0200 +0.001s ... 0.001s
#4 composed specs +0.084s ... 0.085s
#5 did output specs +0s ... 0.085s
#6 start showIntegratedCPUs +0s ... 0.085s
#7 getting avg benchmarks for device 7237 +0.025s ... 0.11s
#8 got single benchmarks 7237 +0.014s ... 0.124s
#9 getting avg benchmarks for device 8778 +0.002s ... 0.126s
#10 got single benchmarks 8778 +0.034s ... 0.16s
#11 got avg benchmarks for devices +0s ... 0.16s
#12 min, max, avg, median took s +0.071s ... 0.231s
#13 before gaming benchmark output +0s ... 0.231s
#14 Got 36 rows for game benchmarks. +0.011s ... 0.242s
#15 composed SQL query for gamebenchmarks +0s ... 0.242s
#16 got data and put it in $dataArray +0.004s ... 0.246s
#17 benchmarks composed for output. +0.021s ... 0.267s
#18 calculated avg scores. +0s ... 0.267s
#19 return log +0.043s ... 0.309s
Please share our article, every link counts!
Redaktion, 2017-09- 8 (Update: 2023-07- 1)
 Deutsch
 English
 Español
 Français
 Italiano
 Nederlands
 Polski
 Português
 Русский
 Türkçe
 Svenska
 Chinese
 Magyar