ARM Mali-T830 MP2 vs Qualcomm Adreno 302
ARM Mali-T830 MP2 ► remove from comparison
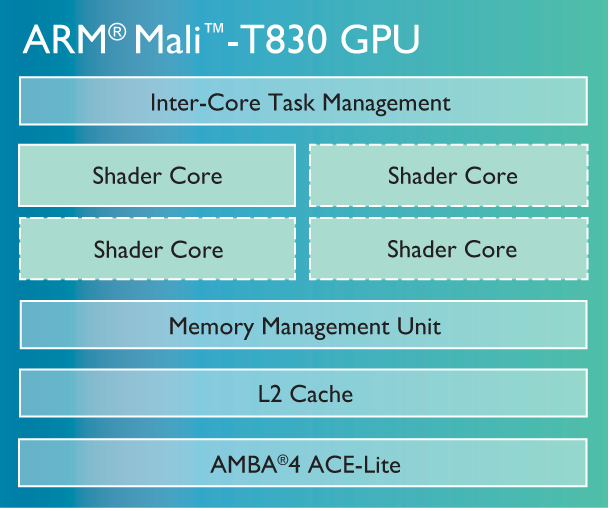
The ARM Mali-T830 MP2 is an integrated graphics card for smartphones and tablets. It first appeared in the HiSilicon Kirin 650 in the beginning of 2016. The chip features two clusters and supports OpenGL ES 3.2, OpenCL 1.2 and DirectX 11 (FL 9_3).
The performance should be similar to the old ARM Mali-450 MP4 and therefore non demanding Android games should run fluently.
The ARM Mali-T830 MP2 in the Kirin 650 is manufactured at TSMC at 16nm FF+ and therefore also suited for smaller smartphones.
Qualcomm Adreno 302 ► remove from comparison
The Qualcomm Adreno 302 is an integrated graphics card for smartphones and tablets that is used for entry-level SoCs of the Qualcomm Snapdragon 200 series (e. g. MSM8210 ). The Adreno 302 is a slightly lower clocked version of the Adreno 305 . Very demanding Android games of 2013 may not run completely smooth, but simple titles like Angry Birds and the usual multimedia tasks are no problem. The GPU offers unified shaders and supports OpenGL ES 3.0, OpenCL and DirectX 9.3.
Source: Qualcomm
ARM Mali-T830 MP2 Qualcomm Adreno 302 Adreno 300 Series Pipelines 2 - unified 6 - unified Core Speed 600 (Boost) MHz 400 MHz Shared Memory no yes API DirectX 11 (FL 9_3), OpenGL ES 3.2 DirectX 9.3, OpenGL ES 3.0 technology 16 nm 28 nm Features OpenGL ES 3.2, OpenCL 1.2, DirectX 11 (FL 9_3) Date of Announcement 01.04.2016 20.06.2013 Link to Manufacturer Page www.arm.com
Benchmarks 3DMark - 3DMark Ice Storm Unlimited Graphics
min: 5376 avg: 10021 median: 11147 (1%) max: 11713 Points
min: 3543 avg: 3599 median: 3592 (0%) max: 3678 Points
3DMark - 3DMark Ice Storm Extreme Graphics
min: 4548 avg: 6301 median: 6960 (1%) max: 7395 Points
min: 1951 avg: 1991 median: 1986 (0%) max: 2033 Points
3DMark - 3DMark Ice Storm Graphics
8002 Points (1%)
min: 4095 avg: 4219 median: 4171 (1%) max: 4482 Points
3DMark - 3DMark Sling Shot (ES 3.0) Unlimited
min: 465 avg: 594 median: 598 (3%) max: 721 Points
3DMark - 3DMark Sling Shot (ES 3.0) Unlimited Graphics
min: 387 avg: 504 median: 509 (1%) max: 618 Points
3DMark - 3DMark Sling Shot Extreme (ES 3.1) Unlimited
min: 297 avg: 398.3 median: 404 (2%) max: 483 Points
3DMark - 3DMark Sling Shot Extreme (ES 3.1) Unlimited Graphics
min: 241 avg: 327.9 median: 333 (1%) max: 401 Points
GFXBench - GFXBench 5.0 Aztec Ruins High Tier Offscreen
min: 0.96 avg: 1 median: 1 (0%) max: 1.1 fps
GFXBench - GFXBench 5.0 Aztec Ruins Normal Tier Offscreen
min: 2.6 avg: 2.7 median: 2.8 (0%) max: 2.8 fps
GFXBench - GFXBench Car Chase Offscreen
min: 1.8 avg: 2.7 median: 2.9 (0%) max: 3.2 fps
GFXBench 3.1 - GFXBench Manhattan ES 3.1 Offscreen
min: 1.7 avg: 4.1 median: 4.5 (0%) max: 5.4 fps
GFXBench 3.0 - GFXBench 3.0 Manhattan Offscreen
min: 4.6 avg: 7.1 median: 7.9 (0%) max: 8.8 fps
1.3 fps (0%)
GFXBench (DX / GLBenchmark) 2.7 + ARM Mali-T830 MP2 GFXBench (DX / GLBenchmark) 2.7 - GFXBench T-Rex HD Offscreen C24Z16
min: 12 avg: 16.7 median: 18.5 (0%) max: 20 fps
GFXBench T-Rex HD Offscreen C24Z16 + Qualcomm Adreno 302 min: 3.3 avg: 4.1 median: 4.4 (0%) max: 4.5 fps
Basemark ES 2.0 - Basemark ES 2.0
57.8 fps (95%)
34.3 fps (57%)
Basemark X 1.1 - Basemark X 1.1 High Quality
min: 8323 avg: 8545 median: 8542 (19%) max: 8774 Points
1316 Points (3%)
Basemark X 1.1 - Basemark X 1.1 Medium Quality
min: 15988 avg: 16554 median: 16613 (37%) max: 17001 Points
3442 Points (8%)
NenaMark2 - NenaMark2 Score
49.7 fps (74%)
PassMark PerformanceTest Mobile V1 - PerformanceTest Mobile V1 2D Graphics Tests
min: 3565 avg: 3703 median: 3639 (4%) max: 3967 Points
min: 2172 avg: 2356 median: 2297 (2%) max: 2780 Points
PassMark PerformanceTest Mobile V1 - PerformanceTest Mobile V1 3D Graphics Tests
min: 1076 avg: 1184 median: 1160.5 (2%) max: 1339 Points
min: 540 avg: 574 median: 584 (1%) max: 591 Points
Smartbench 2012 - Smartbench 2012 Gaming Index
min: 2536 avg: 2656 median: 2655.5 (58%) max: 2775 Points
Average Benchmarks ARM Mali-T830 MP2 → 100% n=10 Average Benchmarks Qualcomm Adreno 302 → 36% n=10
- Range of benchmark values for this graphics card
- Average benchmark values for this graphics card
* Smaller numbers mean a higher performance
1 This benchmark is not used for the average calculation
Game Benchmarks The following benchmarks stem from our benchmarks of review laptops. The performance depends on the used graphics memory, clock rate, processor, system settings, drivers, and operating systems. So the results don't have to be representative for all laptops with this GPU. For detailed information on the benchmark results, click on the fps number.
100%
Mali-T830 MP2:
13 fps
100%
Mali-T830 MP2:
31 31 ~ 31 fps
100%
Mali-T830 MP2:
26 31 31 ~ 29 fps
100%
Mali-T830 MP2:
25 26 ~ 26 fps
100%
Mali-T830 MP2:
58 fps
Average Gaming ARM Mali-T830 MP2 → 100% Average Gaming 30-70 fps → 100%
ARM Mali-T830 MP2 low med. high ultra QHD 4K PUBG Mobile 13 Arena of Valor 31 29 Dead Trigger 2 40 Asphalt 8: Airborne 30 24 Real Racing 3 26 Subway Surfers 58 < 30 fps < 60 fps < 120 fps ≥ 120 fps 2 1 2 2 1
For more games that might be playable and a list of all games and graphics cards visit our Gaming List
v1.26
log 28. 20:12:15
#0 checking url part for id 7310 +0s ... 0s
#1 checking url part for id 5509 +0s ... 0s
#2 not redirecting to Ajax server +0s ... 0s
#3 did not recreate cache, as it is less than 5 days old! Created at Tue, 28 May 2024 05:35:22 +0200 +0.001s ... 0.001s
#4 composed specs +0.11s ... 0.111s
#5 did output specs +0s ... 0.111s
#6 start showIntegratedCPUs +0s ... 0.111s
#7 getting avg benchmarks for device 7310 +0.042s ... 0.153s
#8 got single benchmarks 7310 +0.05s ... 0.203s
#9 getting avg benchmarks for device 5509 +0.002s ... 0.205s
#10 got single benchmarks 5509 +0.025s ... 0.23s
#11 got avg benchmarks for devices +0s ... 0.23s
#12 min, max, avg, median took s +0.089s ... 0.318s
#13 before gaming benchmark output +0s ... 0.318s
#14 Got 50 rows for game benchmarks. +0.021s ... 0.34s
#15 composed SQL query for gamebenchmarks +0s ... 0.34s
#16 got data and put it in $dataArray +0.003s ... 0.342s
#17 benchmarks composed for output. +0.015s ... 0.358s
#18 calculated avg scores. +0s ... 0.358s
#19 return log +0.04s ... 0.398s
Please share our article, every link counts!
Redaktion, 2017-09- 8 (Update: 2023-07- 1)
 Deutsch
 English
 Español
 Français
 Italiano
 Nederlands
 Polski
 Português
 Русский
 Türkçe
 Svenska
 Chinese
 Magyar