

Apple M2 8-Core GPU vs Apple M4 8-core GPU
Apple M2 8-Core GPU
► remove from comparison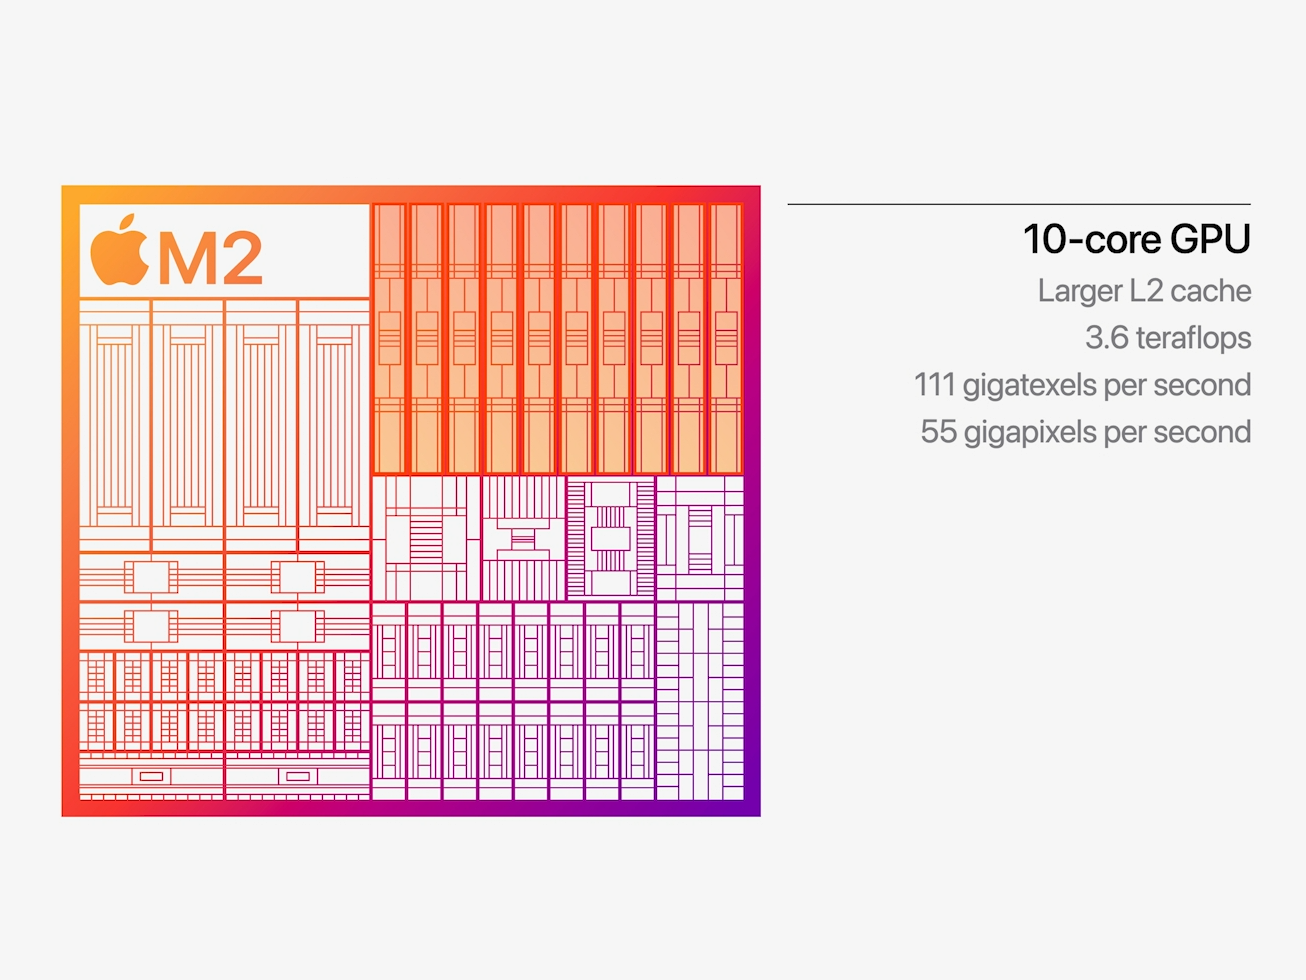
The Apple M2 8-core GPU is an integrated graphics card offering 8 of the 10 cores designed by Apple and integrated in the Apple M2 SoC. It uses the unified memory architecture of the M2 SoC (up to 24 GB LPDDR5-6400 with 100 GB/s bandwidth) and should offer 128 execution units.
The performance is positioned right between the old 8-core model in the M1 GPU and the higher end 10-core model in the M2. The theoretical performance should be around 2.9 Teraflops, as the 8-core version offers the same 1,398 MHz maximum clock rate as the 10-core version. Compared to other iGPUs from AMD and Intel, the M2 benefits greatly from the unified memory architecture and the high bandwidth.
The M2 chip is manufactured in the second generation 5nm process at TSMC (most likely N5P). The power consumption is around 10 Watt (in our tests under load of the MBP13) compared to the 13.5W of the 10-core version.
Apple M4 8-core GPU
► remove from comparison
The 8-core Apple M4 GPU is a graphics adapter built into the smallest Apple M4 series SoC that debuted in October 2024 alongside the new iMac. It isn't clear if this is a 10-core M4 GPU with two cores disabled, or if Apple actually makes an entirely new M4 SoC now that has fewer CPU and GPU cores by design.
A few popular video codecs can be HW-decoded and HW-encoded here but the list is nowhere near as long as what current AMD iGPUs deliver, let alone Intel iGPUs. However, there is a healthy selection of modern technologies such as ray tracing on offer.
Just like the rest of the Apple M4 chip, the graphics adapter is manufactured on a "second generation 3 nm" TSMC process that's still cutting-edge, as of late 2024. It has access to the 16 or 24 gigabytes of fast on-package LPDDR5x-7500 RAM and, apart from the iMac's internal display, allows one to connect one more monitor with an "up to 6K" resolution whereas the 10-core M4 GPU can drive 2 such monitors.
Its performance is slated to be around 15% lower than that of the 10-core M4 GPU. Still, it's going to be at least as fast as the Radeon 760M in many tasks, including gaming.
| Apple M2 8-Core GPU | Apple M4 8-core GPU | |||||||||||||||||||||||||||||||||||||
| Apple M4 Series |
|
| ||||||||||||||||||||||||||||||||||||
| Pipelines | 8 - unified | 8 - unified | ||||||||||||||||||||||||||||||||||||
| Core Speed | 1398 (Boost) MHz | |||||||||||||||||||||||||||||||||||||
| Memory Type | LPDDR5-6400 | LPDDR5X-7500 | ||||||||||||||||||||||||||||||||||||
| Shared Memory | no | yes | ||||||||||||||||||||||||||||||||||||
| Power Consumption | 10 Watt | 4 Watt | ||||||||||||||||||||||||||||||||||||
| technology | 5 nm | 3 nm | ||||||||||||||||||||||||||||||||||||
| Date of Announcement | 06.06.2022 | 28.10.2024 | ||||||||||||||||||||||||||||||||||||
| Predecessor | M1 8-Core GPU | M3 8-Core GPU |
| |||||||||
Benchmarks
Cinebench R15 OpenGL 64 Bit + Apple M2 8-Core GPU
GFXBench T-Rex HD Offscreen C24Z16 + Apple M2 8-Core GPU
Average Benchmarks Apple M2 8-Core GPU → 100% n=8
Average Benchmarks Apple M4 8-core GPU → 115% n=8
* Smaller numbers mean a higher performance
1 This benchmark is not used for the average calculation
Game Benchmarks
The following benchmarks stem from our benchmarks of review laptops. The performance depends on the used graphics memory, clock rate, processor, system settings, drivers, and operating systems. So the results don't have to be representative for all laptops with this GPU. For detailed information on the benchmark results, click on the fps number.

Civilization 7
2025
Total War Pharaoh
2023

Baldur's Gate 3
2023
Borderlands 3
2019

Average Gaming Apple M2 8-Core GPU → 100%
Average Gaming 30-70 fps → 100%
Average Gaming Apple M4 8-core GPU → 149%
Average Gaming 30-70 fps → 140%
| Apple M2 8-Core GPU | Apple M4 8-core GPU | |||||||||||||
|---|---|---|---|---|---|---|---|---|---|---|---|---|---|---|
| low | med. | high | ultra | QHD | 4K | low | med. | high | ultra | QHD | 4K | |||
| Civilization 7 | 98 | 78.2 | 62.9 | |||||||||||
| Total War Pharaoh | 53.2 | 46.3 | 40.7 | 28.7 | ||||||||||
| Cyberpunk 2077 2.2 Phantom Liberty | 25.9 | 20.3 | 17 | 14.3 | ||||||||||
| Baldur's Gate 3 | 39.7 | 27.8 | 23.1 | 22.6 | ||||||||||
| Shadow of the Tomb Raider | 62 | 28 | 24 | 20 | 103 | 39 | 34 | 30 | ||||||
| Apple M2 8-Core GPU | Apple M4 8-core GPU | |||||||||||||
| low | med. | high | ultra | QHD | 4K | low | med. | high | ultra | QHD | 4K | < 30 fps < 60 fps < 120 fps ≥ 120 fps | 1 | 1 | 1 | 1 | | | < 30 fps < 60 fps < 120 fps ≥ 120 fps | 1 2 2 | 2 2 1 | 2 2 1 | 3 1 | | |
For more games that might be playable and a list of all games and graphics cards visit our Gaming List