Notebookcheck Logo

Apple M1 Pro vs Qualcomm Snapdragon 850 vs Apple M2 Pro

Apple M1 Pro

► remove from comparison Apple M1 Pro

The Apple M1 Pro is a System on a Chip (SoC) from Apple that is found in the late 2021 MacBook Pro 14 and 16-inch models. It offers  all 10 cores available in the chip divided in eight performance cores (P-cores with 600 - 3220 MHz) and two power-efficiency cores (E-cores with 600 - 2064 MHz). There is no Turbo Boost for single cores or short burst periods. The cores are similar to the cores in the Apple M1. The entry level model offers only 8 cores.

The big cores (codename Firestorm) offer 192 KB instruction cache, 128 KB data cache, and 24 MB shared L2 cache (up from 12 MB in the M1). The four efficiency cores (codename Icestorm) are a lot smaller and offer only 128 KB instruction cache, 64 KB data cache, and 4 MB shared cache. CPU and GPU can both use the 24 MB SLC (System Level Cache). The efficiency cores (E cluster) clock with 600 - 2064 MHz, the performance cores (P cluster) with 600 - 3228 MHz.

The unified memory (16 or 32 GB LPDDR5-6400) next to the chip is connected by a 256 bit memory controller (200 GB/s bandwidth) and can be used by the GPU and CPU.

The integrated graphics card in the M1 Pro offers all 16 cores.

Furthermore, the SoC integrates a fast 16 core neural engine, a secure enclave (e.g., for encryption), a unified memory architecture, Thunderbolt 4 controller, an ISP, and media de- and encoders (including ProRes).

The M1 Pro is manufactured in 5 nm at TSMC and integrates 33.7 billion transistors. The peak power consumption of the chip was advertised around 30W for CPU intensive tasks. In the Prime95 benchmark the chip uses in our tests (with a MBP16) 33.6W package power and 31W for the CPU part. In idle the SoC only reports 1W package power.

Qualcomm Snapdragon 850

► remove from comparison Qualcomm SD 850

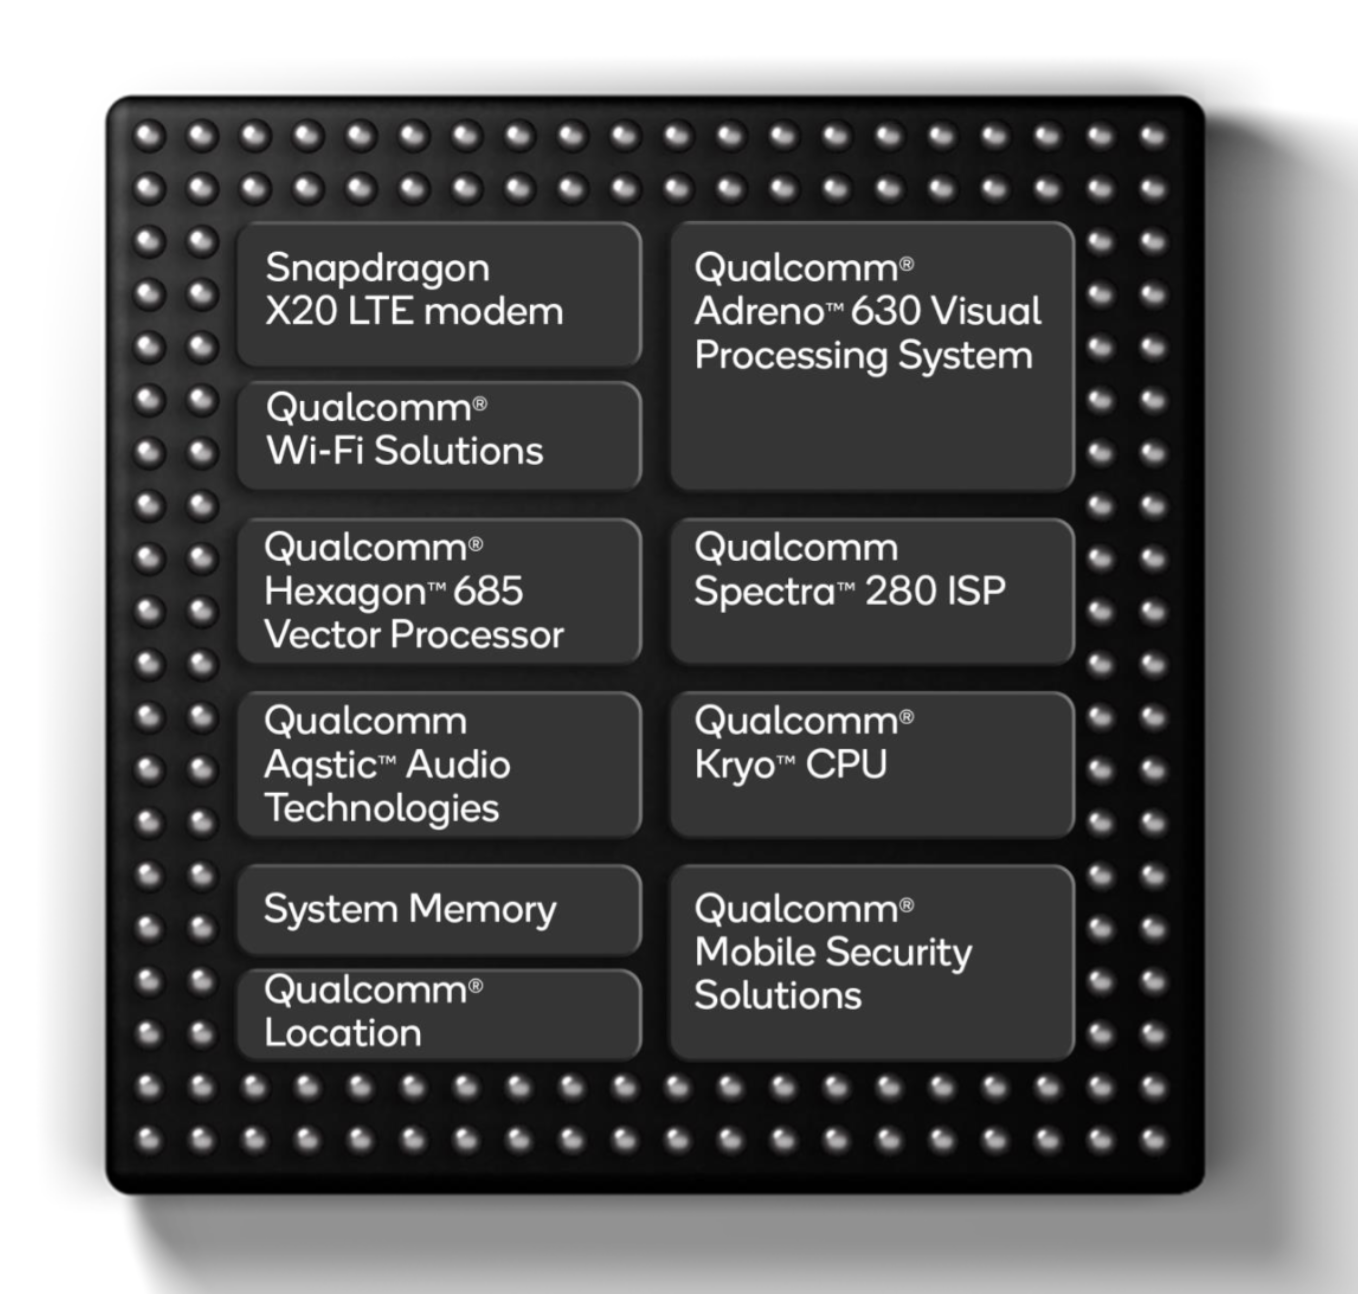
The Qualcomm Snapdragon 850 Mobile Compute Platform (or SD850) is a ARM based SoC for Windows laptops. It is a higher clocked version (3 versus 2.8 GHz) of the Snapdragon 845 for smartphones and also manufactured in 10 nm LPP FinFET at TSMC. It integrates 4x Kryo 385 cores (Cortex-A75) at up to 2.95 GHz (max) for performance and 4x Kryo 385 (at 1.8 GHz?) for efficiency. Furthermore offers an X20 LTE modem (Cat. 18 1.2 Gbps downlink, Cat 13 150 Mbps uplink), ac-WiFi and a dual-channel 32-Bit 1866 MHz LPDDR4x memory controller.

The performance of the Snapdragon 850 in Windows is in theory similar to a Intel Core i5 of the Y-series (e.g. Core i5-7y54). However, this is only the case for native ARM64 compiled applications and games. 32-bit applications that are not compiled for the ARM architecture only run in an emulation and perform much worse (e.g. see Cinebench R11.5 benchmark). 64-bit Intel/AMD apps are not supported at all.

The chip is very power efficient as its produced at TSMC in the modern 10nm LPP process. Therefore, laptops using the Snapdragon 850 can be passively cooled (no fan) and should not throttle under constant load.

Apple M2 Pro

► remove from comparison Apple M2 Pro

The Apple M2 Pro is a System on a Chip (SoC) from Apple that is found in the early 2023 MacBook Pro 14 and 16-inch models. It offers all 12 cores available in the chip divided in eight performance cores (P-cores) and four power-efficiency cores (E-cores). The E-cores clock with up to 3.4 GHz, the P-Cores up to 3.7 GHz (mostly 3.3 GHz in multi-threaded workloads and 3.4 GHz in single threaded).

The big cores (codename Avalanche) offer 192 KB instruction cache, 128 KB data cache, and 36 MB shared L2 cache (up from 24 MB in the M1 Pro). The four efficiency cores (codename Blizzard) are a lot smaller and offer only 128 KB instruction cache, 64 KB data cache, and 4 MB shared cache. CPU and GPU can both use the 24 MB SLC (System Level Cache). 

The unified memory (16 or 32 GB LPDDR5-6400) next to the chip is connected by a 256 Bit memory controller (200 GB/s bandwidth) and can be used by the GPU and CPU.

Apple states that the M2 Pro has a 25% higher performance than the M1 Pro in Xcode compiling.

The integrated graphics card in the M1 Pro offers all 19 cores.

Furthermore, the SoC integrates a fast 16 core neural engine (faster than M1 Pro), a secure enclave (e.g., for encryption), a unified memory architecture, Thunderbolt 4 controller, an ISP, and media de- and encoders (including ProRes).

The M2 Pro is manufactured in 5 nm at TSMC (second generation) and integrates 40 billion transistors. 

ModelApple M1 ProQualcomm Snapdragon 850Apple M2 Pro
SeriesApple Apple M-SeriesQualcomm SnapdragonApple Apple M2
Series: Apple M2
Apple M1 Max2.06 - 3.22 GHz10 / 10 cores48 MB L3
Apple M1 Pro « 2.06 - 3.22 GHz10 / 10 cores24 MB L3
Apple M1 Pro 8-Core2.06 - 3.22 GHz8 / 8 cores16 MB L3
Apple M12.06 - 3.22 GHz8 / 8 cores8 MB L3
Qualcomm Snapdragon 850 « 2.75 - 2.96 GHz8 / 8 cores2 MB L3 Cortex-A75 / A55 (Kryo 385)
Qualcomm Snapdragon 8452.8 GHz8 / 8 cores2 MB L3 Cortex-A75 / A55 (Kryo 385)
Apple M2 Max2.42 - 3.7 GHz12 / 12 cores48 MB L3
Apple M2 Pro « 2.42 - 3.5 GHz12 / 12 cores24 MB L3
Apple M2 Pro 10-Core2.42 - 3.7 GHz10 / 10 cores24 MB L3
Apple M22.42 - 3.48 GHz8 / 8 cores8 MB L3
Clock2064 - 3220 MHz2750 - 2960 MHz2424 - 3504 MHz
L1 Cache2.9 MB768 KB3.3 MB
L2 Cache28 MB1.5 MB36 MB
L3 Cache24 MB2 MB24 MB
Cores / Threads10 / 108 / 812 / 12
Transistors33700 Million40000 Million
Technology5 nm10 nm5 nm
FeaturesARMv8 Instruction SetX20 LTE Modem, Adreno 630 GPUARMv8 Instruction Set
iGPUApple M1 Pro 16-Core GPUQualcomm Adreno 630Apple M2 Pro 19-Core GPU
ArchitectureARMARMARM
Announced
CodenameCortex-A75 / A55 (Kryo 385)
Manufacturerwww.qualcomm.com

Benchmarks

Cinebench 2024 - CB24 CPU Single Core
100%
1 M1 Pro +
112 Points (78%)
109%
1 M2 Pro +
122 Points (85%)
Cinebench 2024 - CB24 CPU Multi Core
100%
1 M1 Pro +
824 Points (15%)
125%
1 M2 Pro +
1028 Points (19%)
Cinebench R23 - Cinebench R23 Multi Core
100%
1 M1 Pro +
12370 Points (11%)
120%
1 M2 Pro +
min: 14787     avg: 14795     median: 14794.5 (14%)     max: 14802 Points
Cinebench R23 - Cinebench R23 Single Core
100%
1 M1 Pro +
1534 Points (65%)
107%
1 M2 Pro +
min: 1647     avg: 1648     median: 1647.5 (70%)     max: 1648 Points
Cinebench R20 - Cinebench R20 CPU (Single Core)
100%
1 M1 Pro +
393 Points (44%)
114%
1 M2 Pro +
min: 446     avg: 446.5     median: 446.5 (50%)     max: 447 Points
Cinebench R20 - Cinebench R20 CPU (Multi Core)
100%
1 M1 Pro +
2721 Points (7%)
148%
1 M2 Pro +
min: 4018     avg: 4031     median: 4031 (10%)     max: 4044 Points
Cinebench R15 - Cinebench R15 CPU Multi 64 Bit
100%
1 M1 Pro +
1690 Points (11%)
122%
1 M2 Pro +
2069 Points (13%)
Cinebench R15 - Cinebench R15 CPU Single 64 Bit
100%
1 M1 Pro +
209 Points (63%)
110%
1 M2 Pro +
230 Points (69%)
Cinebench R10 - Cinebench R10 Rend. Single (32bit)
100%
1 SD 850 +
1166 Points (7%)
Cinebench R10 - Cinebench R10 Rend. Multi (32bit)
100%
1 SD 850 +
2284 Points (2%)
wPrime 2.10 - wPrime 2.0 1024m *
100%
1 SD 850 +
1456 s (17%)
wPrime 2.10 - wPrime 2.0 32m *
100%
1 SD 850 +
37 s (7%)
WinRAR - WinRAR 4.0
100%
1 SD 850 +
4745 Points (8%)
X264 HD Benchmark 4.0 - x264 Pass 2
100%
1 SD 850 +
4.9 fps (2%)
X264 HD Benchmark 4.0 - x264 Pass 1
100%
1 SD 850 +
28 fps (6%)
Blender - Blender 3.3 Classroom CPU *
100%
1 M2 Pro +
331 Seconds (4%)
Blender - Blender 2.79 BMW27 CPU *
100%
1 M1 Pro +
183.3 Seconds (1%)
R Benchmark 2.5 - R Benchmark 2.5 *
100%
1 SD 850 +
2.3 sec (51%)
184%
1 M2 Pro +
0.4 sec (9%)
Super Pi mod 1.5 XS 1M - Super Pi mod 1.5 XS 1M *
100%
1 SD 850 +
34 s (7%)
Super Pi mod 1.5 XS 2M - Super Pi mod 1.5 XS 2M *
100%
1 SD 850 +
75 s (3%)
Super Pi Mod 1.5 XS 32M - Super Pi mod 1.5 XS 32M *
100%
1 SD 850 +
1678 s (7%)
3DMark - 3DMark Ice Storm Physics
100%
1 SD 850 +
13397 Points (11%)
3DMark - 3DMark Ice Storm Extreme Physics
100%
1 SD 850 +
12345 Points (10%)
3DMark - 3DMark Ice Storm Unlimited Physics
100%
1 SD 850 +
16059 Points (14%)
3DMark - 3DMark Cloud Gate Physics
100%
1 SD 850 +
1116 Points (3%)
3DMark - 3DMark Fire Strike Standard Physics
100%
1 SD 850 +
2132 Points (4%)
Geekbench 6.2 - Geekbench 6.2 Single-Core
100%
1 M1 Pro +
2409 Points (65%)
111%
1 M2 Pro +
2663 Points (72%)
Geekbench 6.2 - Geekbench 6.2 Multi-Core
100%
1 M1 Pro +
12440 Points (49%)
117%
1 M2 Pro +
14568 Points (57%)
Geekbench 5.5 - Geekbench 5.1 - 5.4 64 Bit Single-Core
1768 Points (75%)
488 Points (21%)
min: 1952     avg: 1957     median: 1957 (83%)     max: 1961 Points
Geekbench 5.5 - Geekbench 5.1 - 5.4 64 Bit Multi-Core
12499 Points (22%)
1923 Points (3%)
min: 14859     avg: 14961     median: 15010 (27%)     max: 15013 Points
Geekbench 4.4 - Geekbench 4.1 - 4.4 64 Bit Single-Core
100%
1 SD 850 +
2269 Points (23%)
Geekbench 4.4 - Geekbench 4.1 - 4.4 64 Bit Multi-Core
100%
1 SD 850 +
7118 Points (8%)
Mozilla Kraken 1.1 - Kraken 1.1 Total Score *
405.4 ms (0%)
2836 ms (3%)
443.8 ms (1%)
Sunspider - Sunspider 1.0 Total Score *
100%
1 M1 Pro +
75.6 ms (1%)
Octane V2 - Octane V2 Total Score
66203 Points (60%)
13947 Points (13%)
76205 Points (69%)
WebXPRT 4 - WebXPRT 4 Score
100%
1 M2 Pro +
253 Points (73%)
WebXPRT 3 - WebXPRT 3 Score
100%
1 M1 Pro +
342 Points (71%)
113%
1 M2 Pro +
386 Points (80%)
CrossMark - CrossMark Overall
100%
1 M1 Pro +
1556 Points (60%)
116%
1 M2 Pro +
min: 1797     avg: 1805     median: 1804.5 (69%)     max: 1812 Points
Power Consumption - Prime95 Power Consumption - external Monitor *
100%
1 M1 Pro +
41.5 Watt (7%)
Power Consumption - Cinebench R15 Multi Power Consumption - external Monitor *
100%
1 M1 Pro +
48.3 Watt (9%)
Power Consumption - Geekbench 5.5 Power Consumption 150cd *
100%
1 M1 Pro +
19.9 Watt (9%)
Power Consumption - Idle Power Consumption - external Monitor *
100%
1 M1 Pro +
6.4 Watt (4%)
Power Consumption - Idle Power Consumption 150cd 1min *
100%
1 M1 Pro +
9.9 Watt (11%)
Power Consumption - Cinebench R15 Multi Power Efficiency - external Monitor
100%
1 M1 Pro +
35 Points per Watt (26%)

Average Benchmarks Apple M1 Pro → 100% n=4

Average Benchmarks Qualcomm Snapdragon 850 → 40% n=4

Average Benchmarks Apple M2 Pro → 111% n=4

- Range of benchmark values for this graphics card
- Average benchmark values for this graphics card
* Smaller numbers mean a higher performance
1 This benchmark is not used for the average calculation

v1.27
log 17. 13:36:53

#0 checking url part for id 13845 +0s ... 0s

#1 checking url part for id 11391 +0s ... 0s

#2 checking url part for id 14973 +0s ... 0s

#3 not redirecting to Ajax server +0s ... 0s

#4 did not recreate cache, as it is less than 5 days old! Created at Sun, 16 Jun 2024 05:37:17 +0200 +0.001s ... 0.001s

#5 composed specs +0.027s ... 0.028s

#6 did output specs +0s ... 0.028s

#7 getting avg benchmarks for device 13845 +0.003s ... 0.031s

#8 got single benchmarks 13845 +0.007s ... 0.038s

#9 getting avg benchmarks for device 11391 +0.003s ... 0.042s

#10 got single benchmarks 11391 +0.007s ... 0.049s

#11 getting avg benchmarks for device 14973 +0.003s ... 0.052s

#12 got single benchmarks 14973 +0.008s ... 0.06s

#13 got avg benchmarks for devices +0s ... 0.06s

#14 min, max, avg, median took s +0.232s ... 0.292s

#15 return log +0s ... 0.292s

Please share our article, every link counts!
> Expert Reviews and News on Laptops, Smartphones and Tech Innovations > Benchmarks / Tech > Processor Comparison - Head 2 Head
Redaktion, 2017-09- 8 (Update: 2023-07- 1)