Notebookcheck Logo

HiSilicon Kirin 970 vs Qualcomm Snapdragon 820 MSM8996

HiSilicon Kirin 970

► remove from comparison

The HiSilicon Kirin 970 is an ARM based high-end octa-core SoC for smartphones and tablet, which was introduced with the Huawei Mate 10 in late 2017. Besides 8 CPU cores (4x Cortex-A73, 4x Cortex-A53), the SoC is also equipped with a modern Mali-G72 MP12 graphics adapter, a dual-channel LPDDR4 memory controller as well as an LTE (4x4 MIMO, 5-band-carrier-aggregation, QAM-256, up to 1.2 Gbit/s) modem.

The performance cluster is clocked at up to 2.4 GHz and the four A53 power saving cores with up to 1.8 GHz. The performance should improve by about 20 percent according to Huawei and the power consumption reduced by 20 percent.

On the chip HiSilicon also included a dedicated Neural Processing Unit (NPU) for running machine learning tasks very efficiently compared to the CPU cores.

Qualcomm Snapdragon 820 MSM8996

► remove from comparison Qualcomm 820 MSM8996

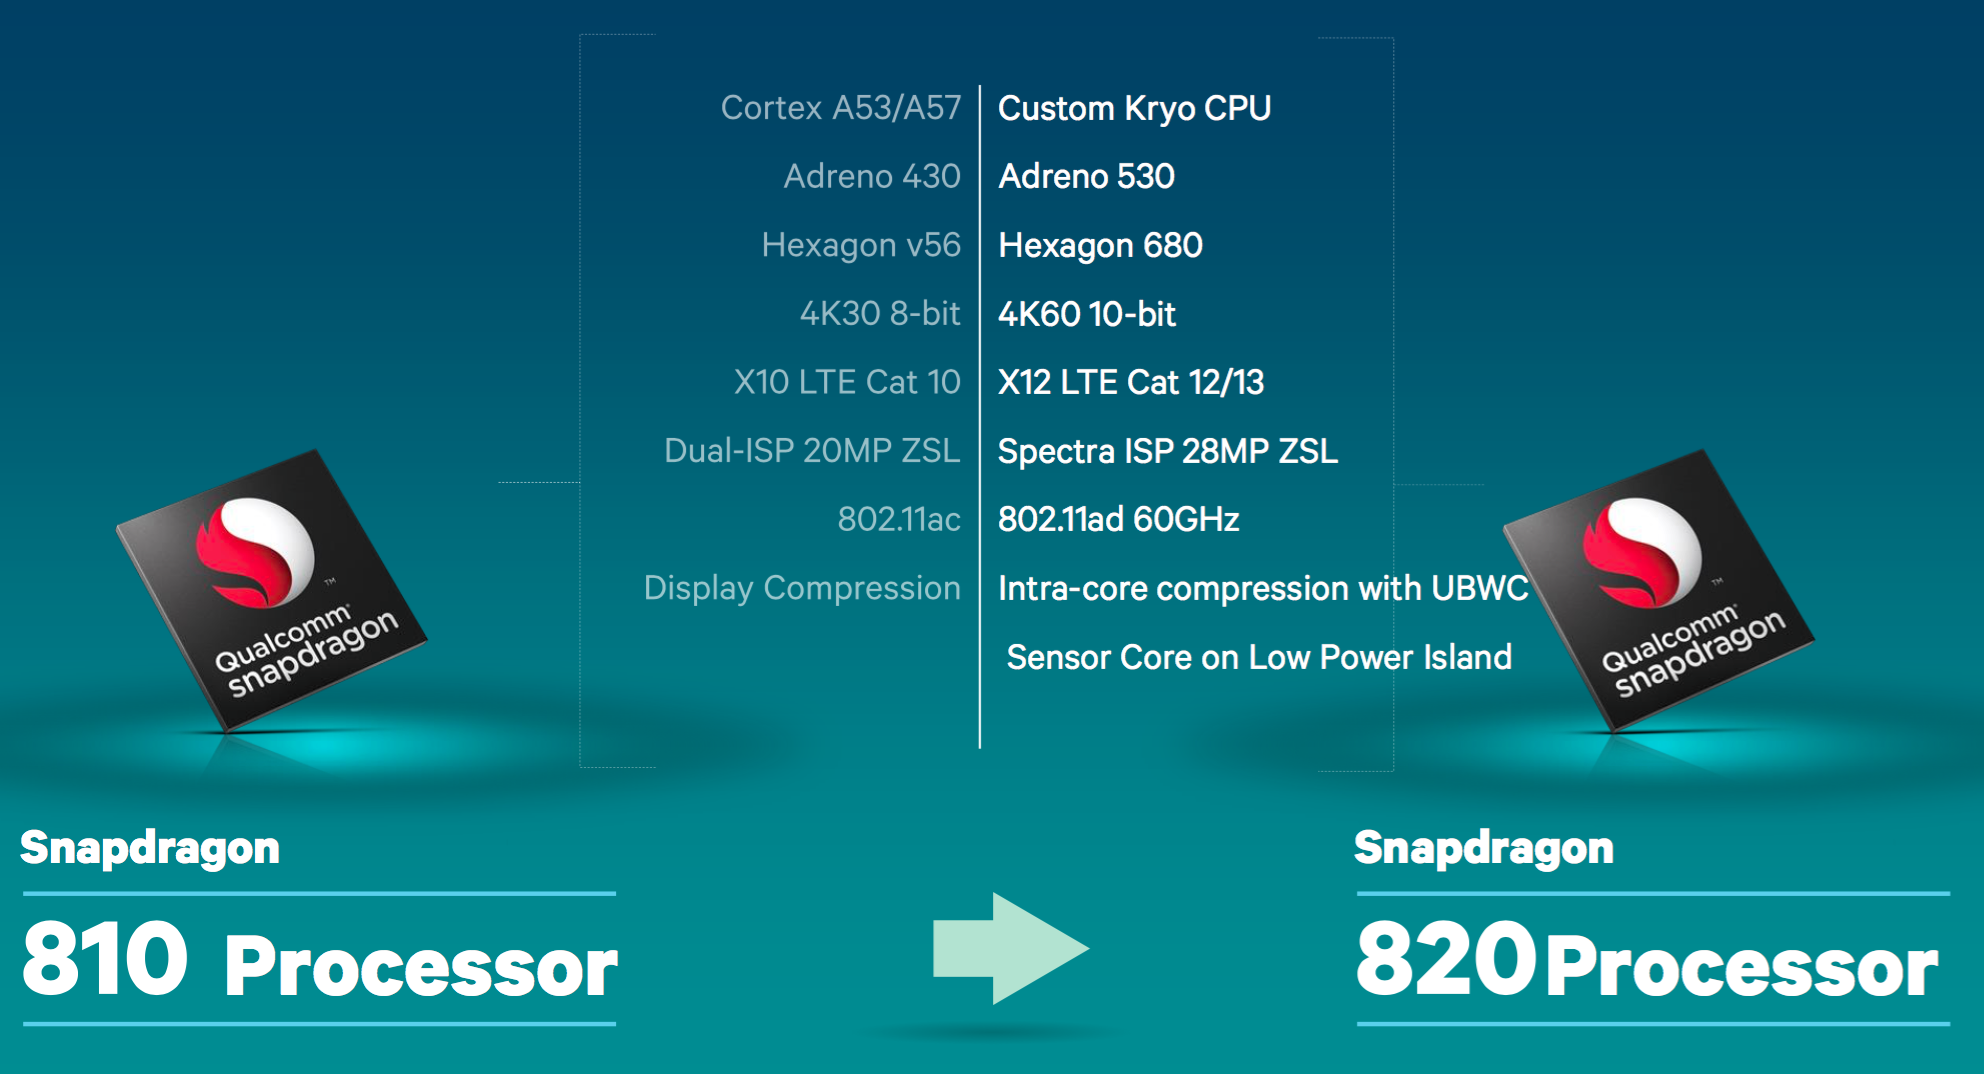
The Qualcomm Snapdragon 820 MSM8996 is a high-end ARM-based SoC largely found on Android tablets and smartphones. Announced in December 2015, the S820 is the successor to the Snapdragon 810 and should start shipping in the first half of 2016. In addition to 4 CPU cores (two slower clocked and two faster clocked Kryo cores), the SoC integrates an Adreno 530 GPU with a LPDDR4 memory controller  and supports Wi-Fi (802.11ad + MIMO), Bluetooth 4.1, and LTE.

CPU

The Snapdragon 820 is based on a similar concept as ARM's big.LITTLE, which combines a low power CPU cluster (2x Kyro clocked at up to 1.6 GHz) and a performance CPU cluster (2x Kyro clocked at up to 2.15 GHz). The clock speed of each cluster can be individually adjusted (but not per core) and the lowest clock speed is 310 MHz. The performance cluster features 1.5 MB L2 cache and the power saving one 512 KB. Both should be using the same architecture and fully support the ARMv8-ISA instruction set.

Although only four cores are used, the performance of the 820 is located in the high end of mobile CPUs for smartphones and tablets.

GPU

The Adreno 530 outperforms the previous Adreno 430 especially in high demanding benchmarks. Therefore it is well suited of modern 3D games on Android devices and should rank slightly below the Tegra X1 GPU.

Features

The Snapdragon 820 offers numerous wireless technologies such as Bluetooth 4.1, WLAN 802.11a/b/g/n/ac/ad (60 GHz) + MIMO as well as a dual-SIM cellular modem supporting LTE cat. 12/13 .

The SoC can encode and decode 4K videos using dedicated hardware (H.264 and H.265).

Power Consumption

Thanks to the new 14 nm process, the energy efficiency has been improved noticeably compared to its 20 nm predecessors.

ModelHiSilicon Kirin 970Qualcomm Snapdragon 820 MSM8996
Series Qualcomm Snapdragon
CodenameCortex-A73/-A53Kryo
Series: Snapdragon Kryo
HiSilicon Kirin 970 « 2.4 GHz8 / 8 cores Cortex-A73/-A53
HiSilicon Kirin 960 compare2.4 GHz8 / 8 cores Cortex-A73/-A53
HiSilicon Kirin 960s compare2.1 GHz8 / 8 cores Cortex-A73/-A53
HiSilicon Kirin 710 compare2.2 GHz8 / 8 cores Cortex-A73/-A53
HiSilicon Kirin 710A compare2 GHz8 / 8 cores Cortex-A73/-A53
Qualcomm Snapdragon 821 MSM8996 Pro compare2.4 GHz4 / 4 cores Kryo
Qualcomm Snapdragon 820 MSM8996 « 2.2 GHz4 / 4 cores Kryo
Clock2400 MHz2200 MHz
Cores / Threads8 / 84 / 4
Transistors5500 Million
Technology10 nm14 nm
FeaturesARM Mali-G71 MP12 GPU, 4x Cortex-A73 (2.4 GHz) + 4x Cortex-A53 (1.8 GHz, big.LITTLE), 2x LTE Dual-SIM (4x4-MIMO, QAM-256, up to 1,2 Gbit/s)Adreno 530, LTE Hexagon 680 DSP, UMTS, GSM, WCDMA, Dual-SIM, eMMC 5.0, UHS-I, 802.11a/b/g/n/ac (2.4/5 GHz) + MIMO, Bluetooth 4.1, USB 3.0, Dual-Channel LPDDR4 Memory Controller
iGPUARM Mali-G72 MP12Qualcomm Adreno 530 ( - 624 MHz)
ArchitectureARMARM
Announced
L2 Cache1.5 MB
Manufacturerwww.qualcomm.com

Benchmarks

3DMark - 3DMark Ice Storm Unlimited Physics
min: 14556     avg: 21027     median: 22026 (19%)     max: 23046 Points
min: 20344     avg: 21095     median: 20948 (18%)     max: 21886 Points
3DMark - 3DMark Sling Shot Extreme (ES 3.1) Unlimited Physics
min: 1897     avg: 2707     median: 2819 (33%)     max: 3002 Points
min: 1232     avg: 1650     median: 1709.5 (20%)     max: 1935 Points
3DMark - 3DMark Sling Shot (ES 3.0) Unlimited Physics
min: 1891     avg: 2732     median: 2836 (32%)     max: 2983 Points
min: 1098     avg: 1596     median: 1709.5 (20%)     max: 1912 Points
Geekbench 5.0 - Geekbench 5.0 64 Bit Single-Core
386 Points (2%)
Geekbench 5.0 - Geekbench 5.0 64 Bit Multi-Core
min: 1655     avg: 1712     median: 1711.5 (5%)     max: 1768 Points
Geekbench 4.4 - Geekbench 4.1 - 4.4 64 Bit Single-Core
min: 1883     avg: 1901     median: 1901 (19%)     max: 1922 Points
min: 1345     avg: 1629     median: 1662 (17%)     max: 1745 Points
Geekbench 4.4 - Geekbench 4.1 - 4.4 64 Bit Multi-Core
min: 6557     avg: 6697     median: 6714.5 (7%)     max: 6792 Points
min: 3534     avg: 3980     median: 4021 (4%)     max: 4201 Points
Geekbench 4.0 - Geekbench 4.0 64 Bit Single-Core
min: 2009     avg: 2010     median: 2010 (27%)     max: 2011 Points
min: 1280     avg: 1584     median: 1657.5 (23%)     max: 1754 Points
Geekbench 4.0 - Geekbench 4.0 64 Bit Multi-Core
min: 6512     avg: 6519     median: 6519 (16%)     max: 6526 Points
min: 3701     avg: 3888     median: 3875.5 (9%)     max: 4097 Points
Geekbench 3 - Geekbench 3 64 Bit Multi-Core
min: 6160     avg: 6205     median: 6204.5 (10%)     max: 6249 Points
min: 5117     avg: 5426     median: 5450 (9%)     max: 5645 Points
Geekbench 3 - Geekbench 3 64 Bit Single-Core
min: 1926     avg: 1933     median: 1933 (29%)     max: 1940 Points
min: 2080     avg: 2305     median: 2376 (36%)     max: 2398 Points
Geekbench 2 - 32 Bit - Geekbench Stream
min: 1993     avg: 2317     median: 2316.5 (19%)     max: 2640 Points
Geekbench 2 - 32 Bit - Geekbench Memory
min: 3758     avg: 3857     median: 3857 (35%)     max: 3956 Points
Geekbench 2 - 32 Bit - Geekbench Floating Point
min: 11044     avg: 11246     median: 11245.5 (22%)     max: 11447 Points
Geekbench 2 - 32 Bit - Geekbench Integer
min: 5485     avg: 5541     median: 5540.5 (11%)     max: 5596 Points
Geekbench 2 - 32 Bit - Geekbench Total Score
min: 6800     avg: 6878     median: 6877.5 (18%)     max: 6955 Points
Mozilla Kraken 1.1 - Kraken 1.1 Total Score *
min: 3591     avg: 4378     median: 3875.5 (5%)     max: 6221 ms
min: 2244     avg: 3136     median: 3121.5 (4%)     max: 4398 ms
Sunspider - Sunspider 1.0 Total Score *
654 ms (7%)
Octane V2 - Octane V2 Total Score
min: 6692     avg: 10111     median: 11085 (10%)     max: 11838 Points
min: 7771     avg: 8880     median: 8987 (8%)     max: 9731 Points
WebXPRT 3 - WebXPRT 3 Score
69 Points (14%)
Vellamo 3.x - Vellamo 3.x Metal
min: 3487     avg: 3554     median: 3526.5 (95%)     max: 3675 Points
Vellamo 3.x - Vellamo 3.x Multicore Beta
min: 3039     avg: 3495     median: 3580.5 (80%)     max: 3780 Points
Vellamo 3.x - Vellamo 3.x Browser
min: 5344     avg: 5668     median: 5643.5 (75%)     max: 6039 Points
Quadrant Standard Edition 2.0 - Quadrant Standard 2.0 Total Score
37627 points (87%)
AnTuTu v6 - AnTuTu v6 Total Score
min: 173653     avg: 177915     median: 178490 (61%)     max: 181973 Points
min: 115867     avg: 129628     median: 129257 (44%)     max: 144426 Points
AnTuTu v7 - AnTuTu v7 MEM
min: 9493     avg: 13104     median: 13673 (42%)     max: 14768 Points
AnTuTu v7 - AnTuTu v7 UX
min: 28440     avg: 42105     median: 44676.5 (55%)     max: 45397 Points
AnTuTu v7 - AnTuTu v7 GPU
min: 68813     avg: 75722     median: 76492.5 (24%)     max: 81761 Points
AnTuTu v7 - AnTuTu v7 CPU
min: 46027     avg: 66879     median: 70808.5 (43%)     max: 72307 Points
AnTuTu v7 - AnTuTu v7 Total Score
min: 152773     avg: 197811     median: 206548 (36%)     max: 212278 Points
AndEBench - AndEBench Java
1945 Iter./s (60%)
AndEBench - AndEBench Native
19884 Iter./s (65%)
PassMark PerformanceTest Mobile V1 - PerformanceTest Mobile V1 CPU Tests
202050 Points (27%)
min: 162632     avg: 172040     median: 170521 (22%)     max: 182968 Points
PCMark for Android - PCM f. Android Work 2.0 Battery Life
596 min (11%)
min: 383     avg: 425.2     median: 393 (7%)     max: 482 min
PCMark for Android - PCM f. Android Computer Vision
min: 4617     avg: 4787     median: 4730 (25%)     max: 5015 Points
3105 Points (16%)
PCMark for Android - PCM f. Android Storage
min: 14120     avg: 14492     median: 14670 (31%)     max: 14687 Points
2884 Points (6%)
PCMark for Android - PCM f. Android Work Score 2.0
min: 6293     avg: 6860     median: 6957 (45%)     max: 7046 Points
min: 4549     avg: 5246     median: 5288.5 (35%)     max: 5765 Points
PCMark for Android - PCM f. Android Work Score
min: 8115     avg: 8537     median: 8484.5 (42%)     max: 9326 Points
min: 4589     avg: 5925     median: 5608 (28%)     max: 7637 Points

Average Benchmarks HiSilicon Kirin 970 → 100% n=18

Average Benchmarks Qualcomm Snapdragon 820 MSM8996 → 75% n=18

- Range of benchmark values for this graphics card
- Average benchmark values for this graphics card
* Smaller numbers mean a higher performance
1 This benchmark is not used for the average calculation

Add one or more devices and compare

In the following list you can select (and also search for) devices that should be added to the comparison. You can select more than one device.

restrict list:

show all (including archived), 2024, 2023
v1.26
log 26. 08:10:18

#0 checking url part for id 9236 +0s ... 0s

#1 checking url part for id 7889 +0s ... 0s

#2 not redirecting to Ajax server +0s ... 0s

#3 did not recreate cache, as it is less than 5 days old! Created at Thu, 25 Apr 2024 05:38:32 +0200 +0.001s ... 0.001s

#4 composed specs +0.047s ... 0.049s

#5 did output specs +0s ... 0.049s

#6 getting avg benchmarks for device 9236 +0.003s ... 0.051s

#7 got single benchmarks 9236 +0.021s ... 0.073s

#8 getting avg benchmarks for device 7889 +0.003s ... 0.076s

#9 got single benchmarks 7889 +0.035s ... 0.11s

#10 got avg benchmarks for devices +0s ... 0.11s

#11 No cached benchmark found, getting uncached values +0.091s ... 0.201s

#12 No cached benchmark found, getting uncached values +0.014s ... 0.215s

#13 No cached benchmark found, getting uncached values +0.011s ... 0.226s

#14 No cached benchmark found, getting uncached values +0.001s ... 0.227s

#15 min, max, avg, median took s +0.019s ... 0.246s

#16 return log +0.024s ... 0.27s

Please share our article, every link counts!
> Expert Reviews and News on Laptops, Smartphones and Tech Innovations > Benchmarks / Tech > Processor Comparison - Head 2 Head
Redaktion, 2017-09- 8 (Update: 2023-07- 1)