


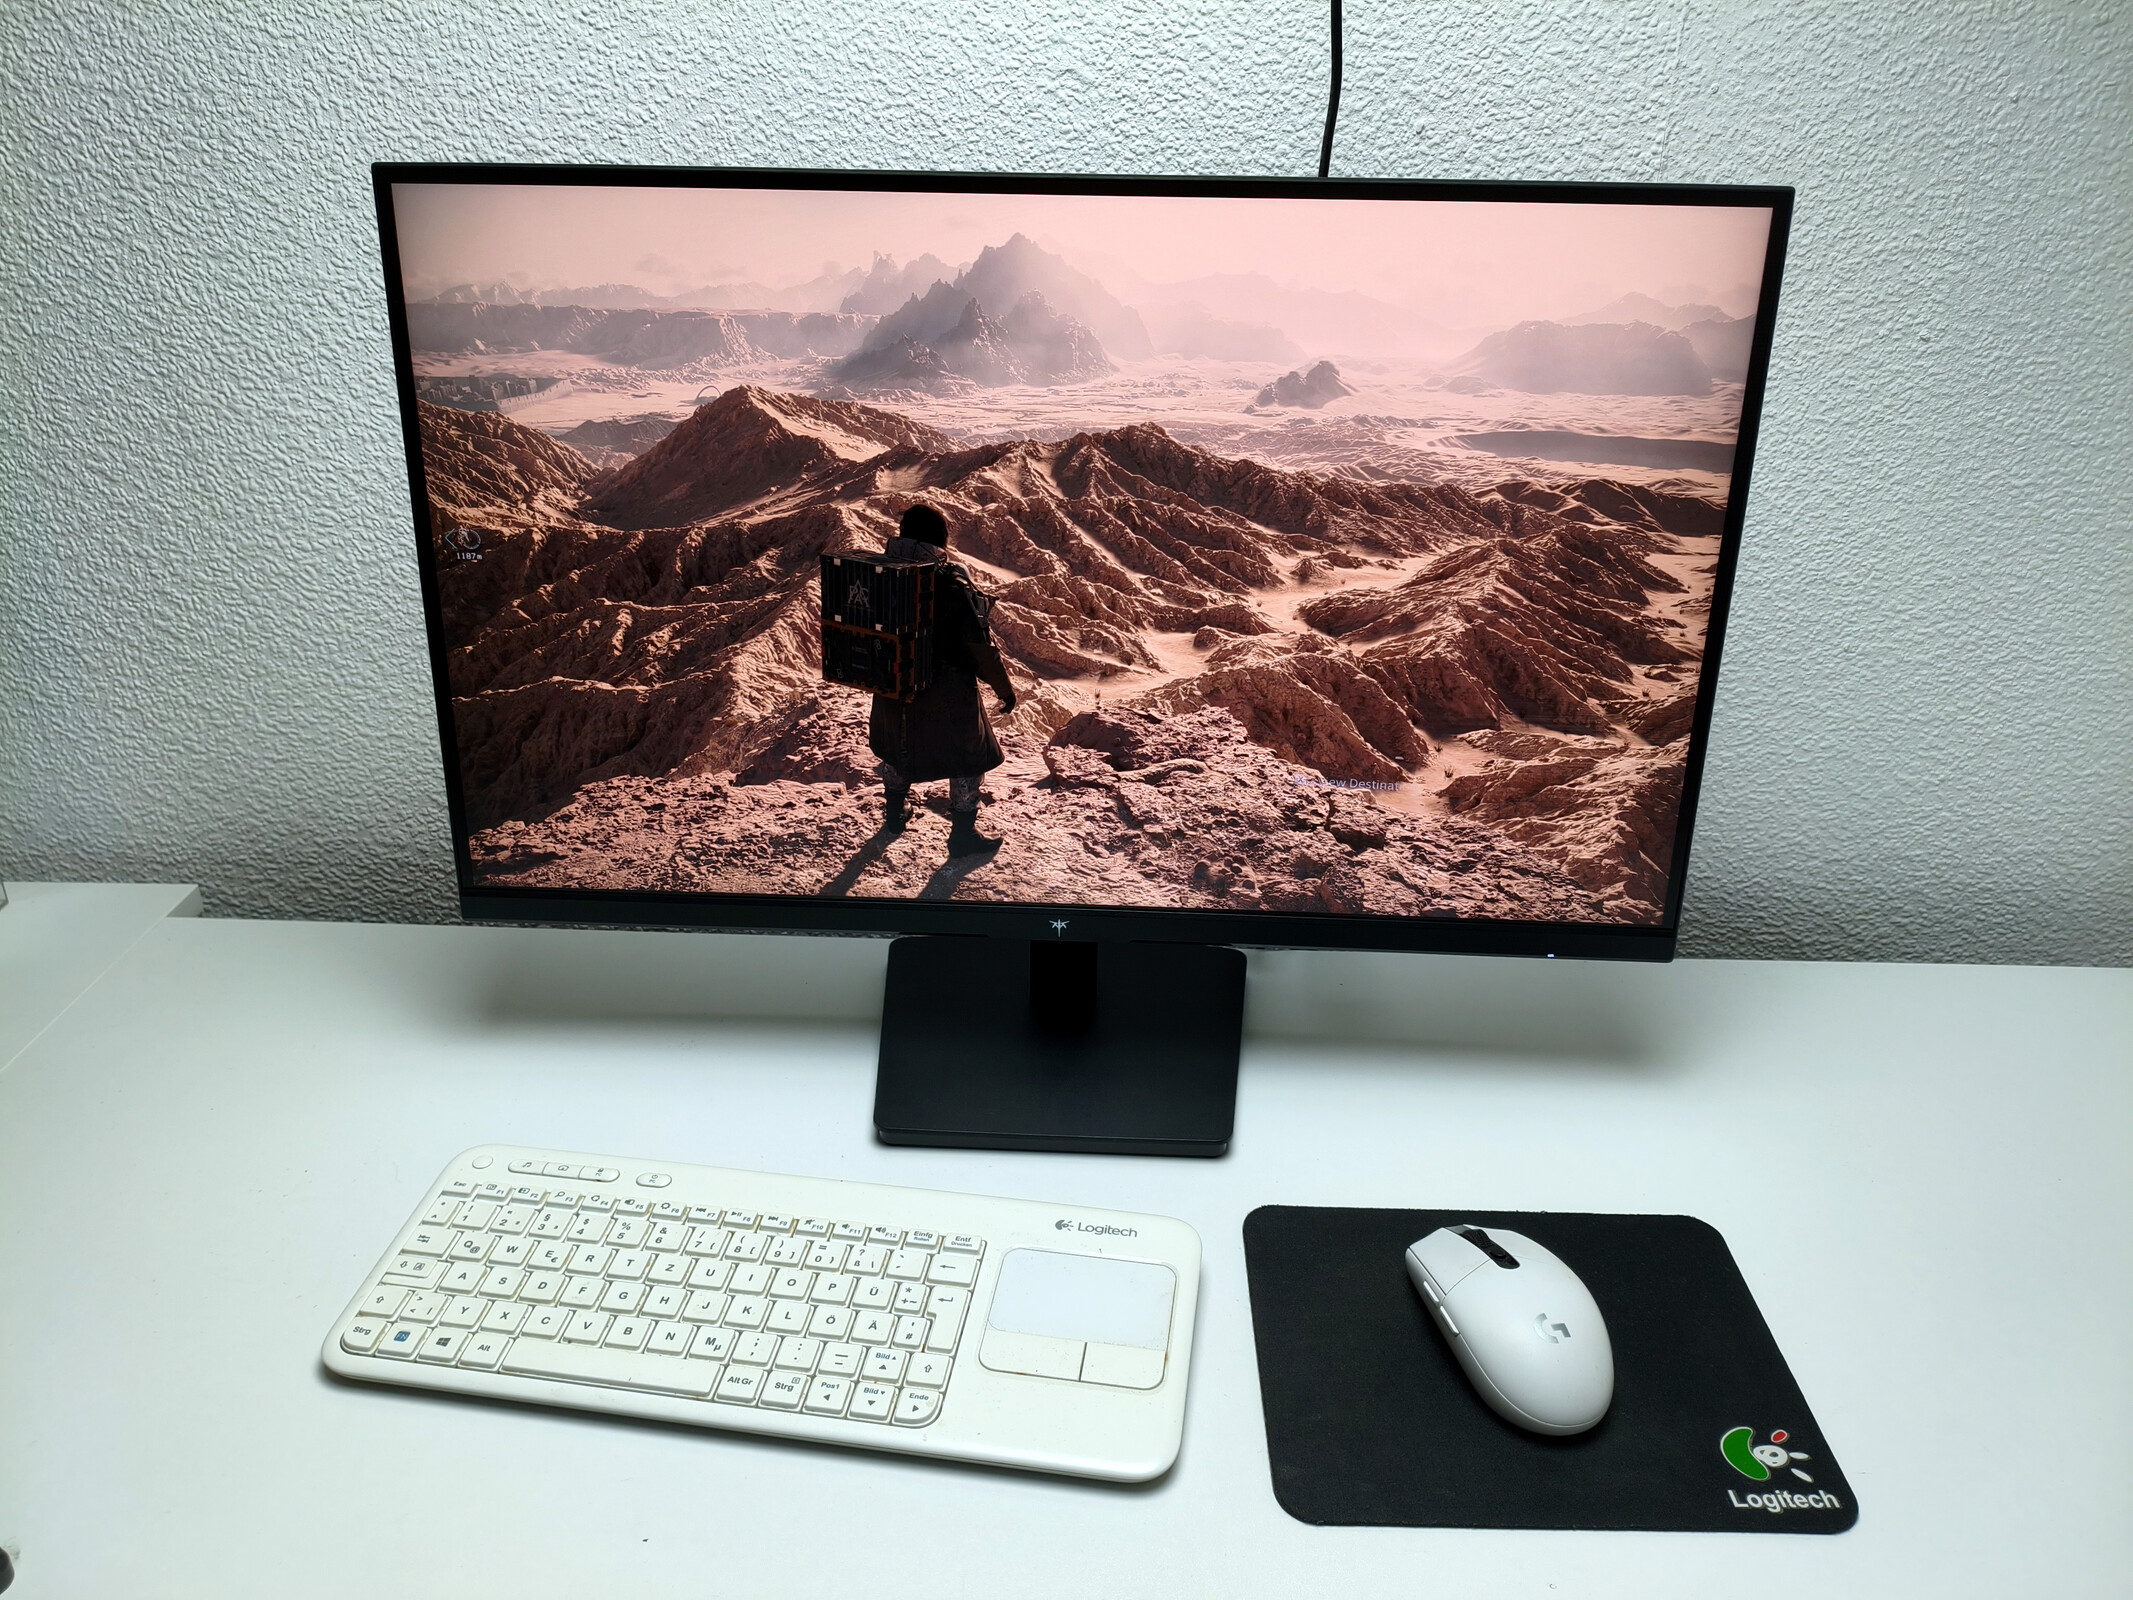
Verdict
At its current price of $135 on Amazon, the KTC H27D9 makes a solid case for itself. Although our measurements show that the 27-inch monitor falls short of some of the manufacturer’s specifications (more on that later in the article), it delivers a fairly well-rounded performance that should appeal to office users, multimedia enthusiasts, and gamers alike. Instead of the VA technology often used in budget monitors, it features an IPS panel that fully covers at least the sRGB color space and delivers rich colors and solid viewing angles. However, spending a little more gets you better models from the same manufacturer, such as the KTC H27E6S, which we also reviewed recently and have included in the comparison table below.
Pros
Cons

Table of Contents
Specifications
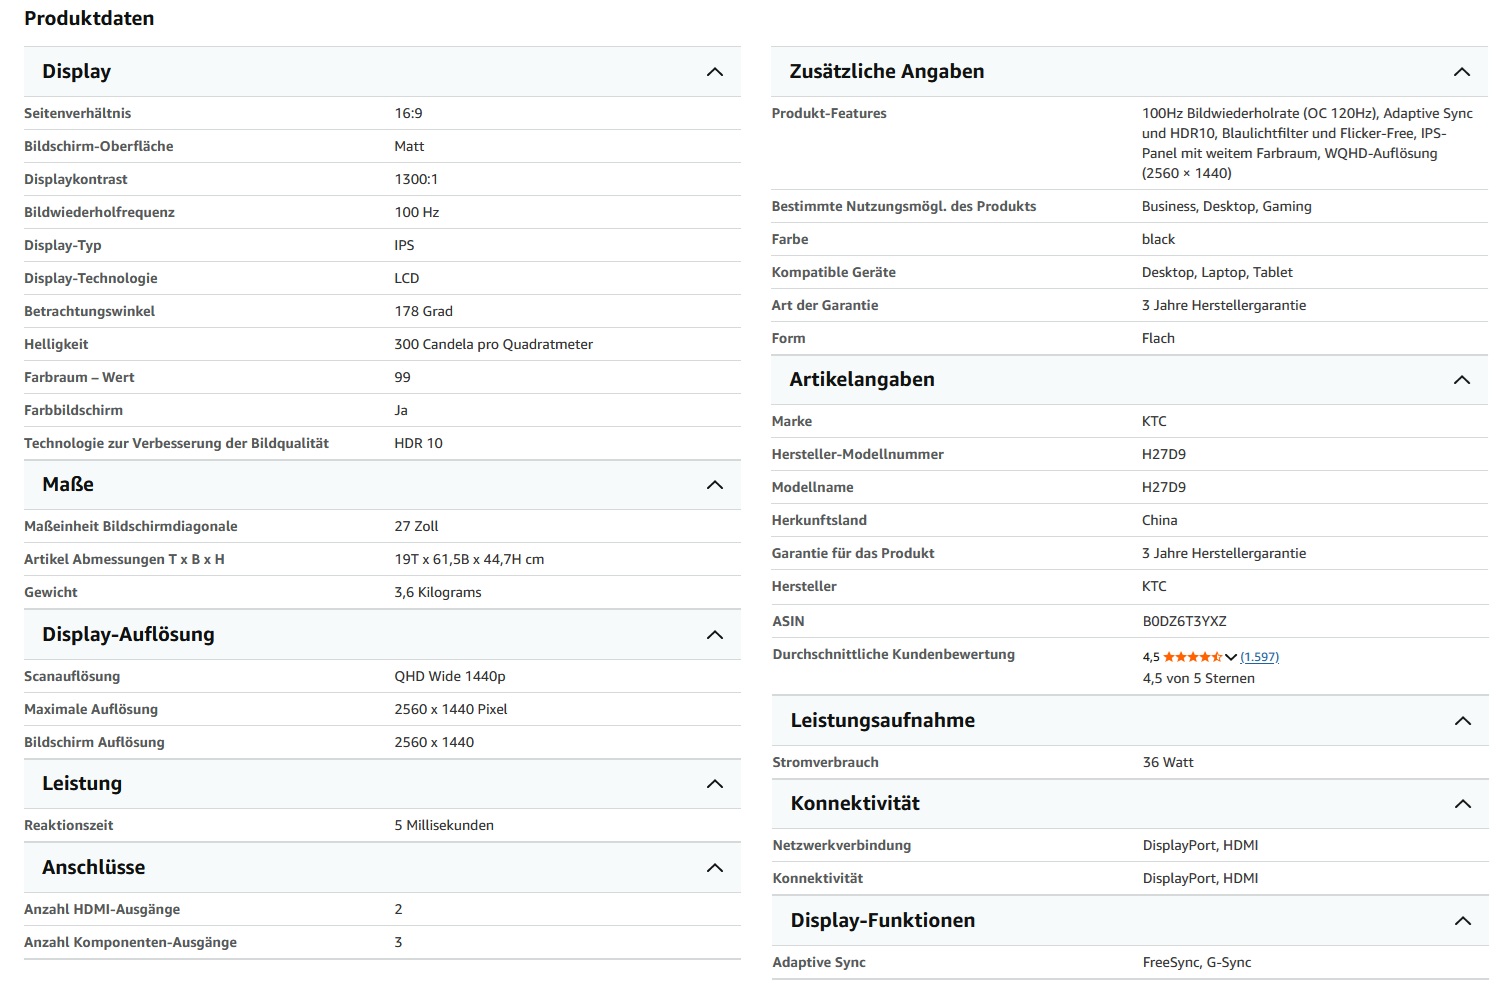
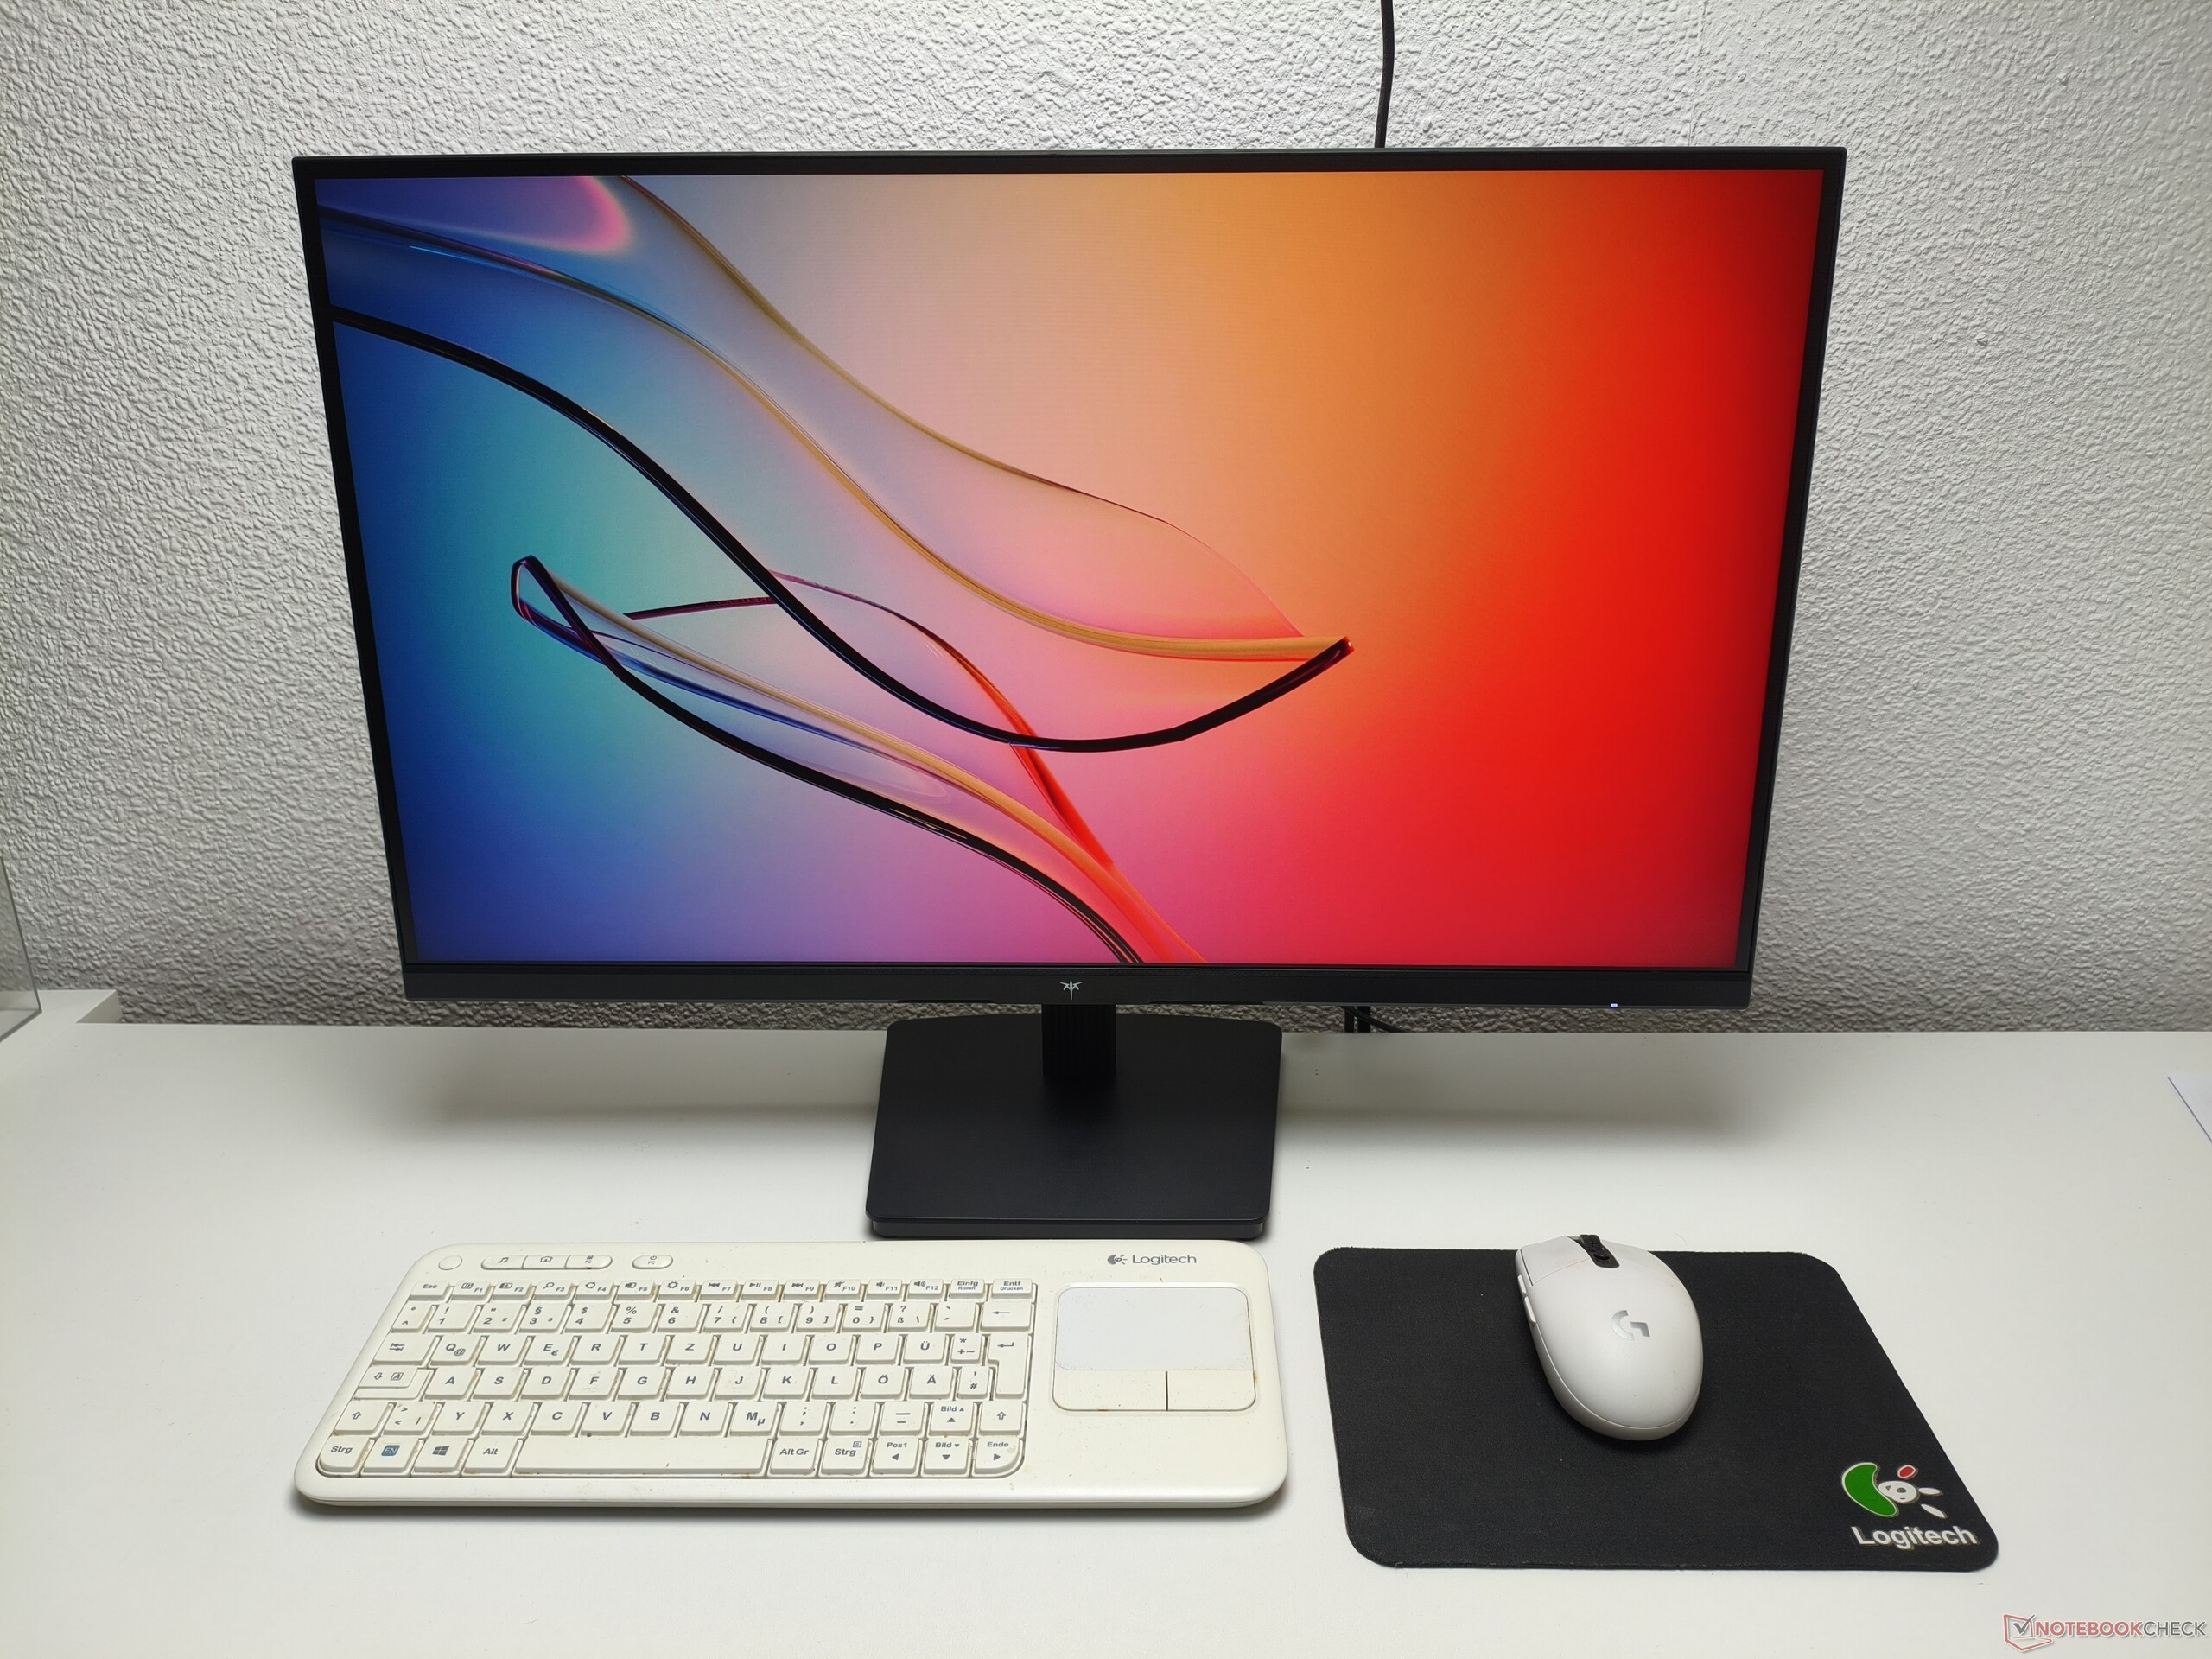
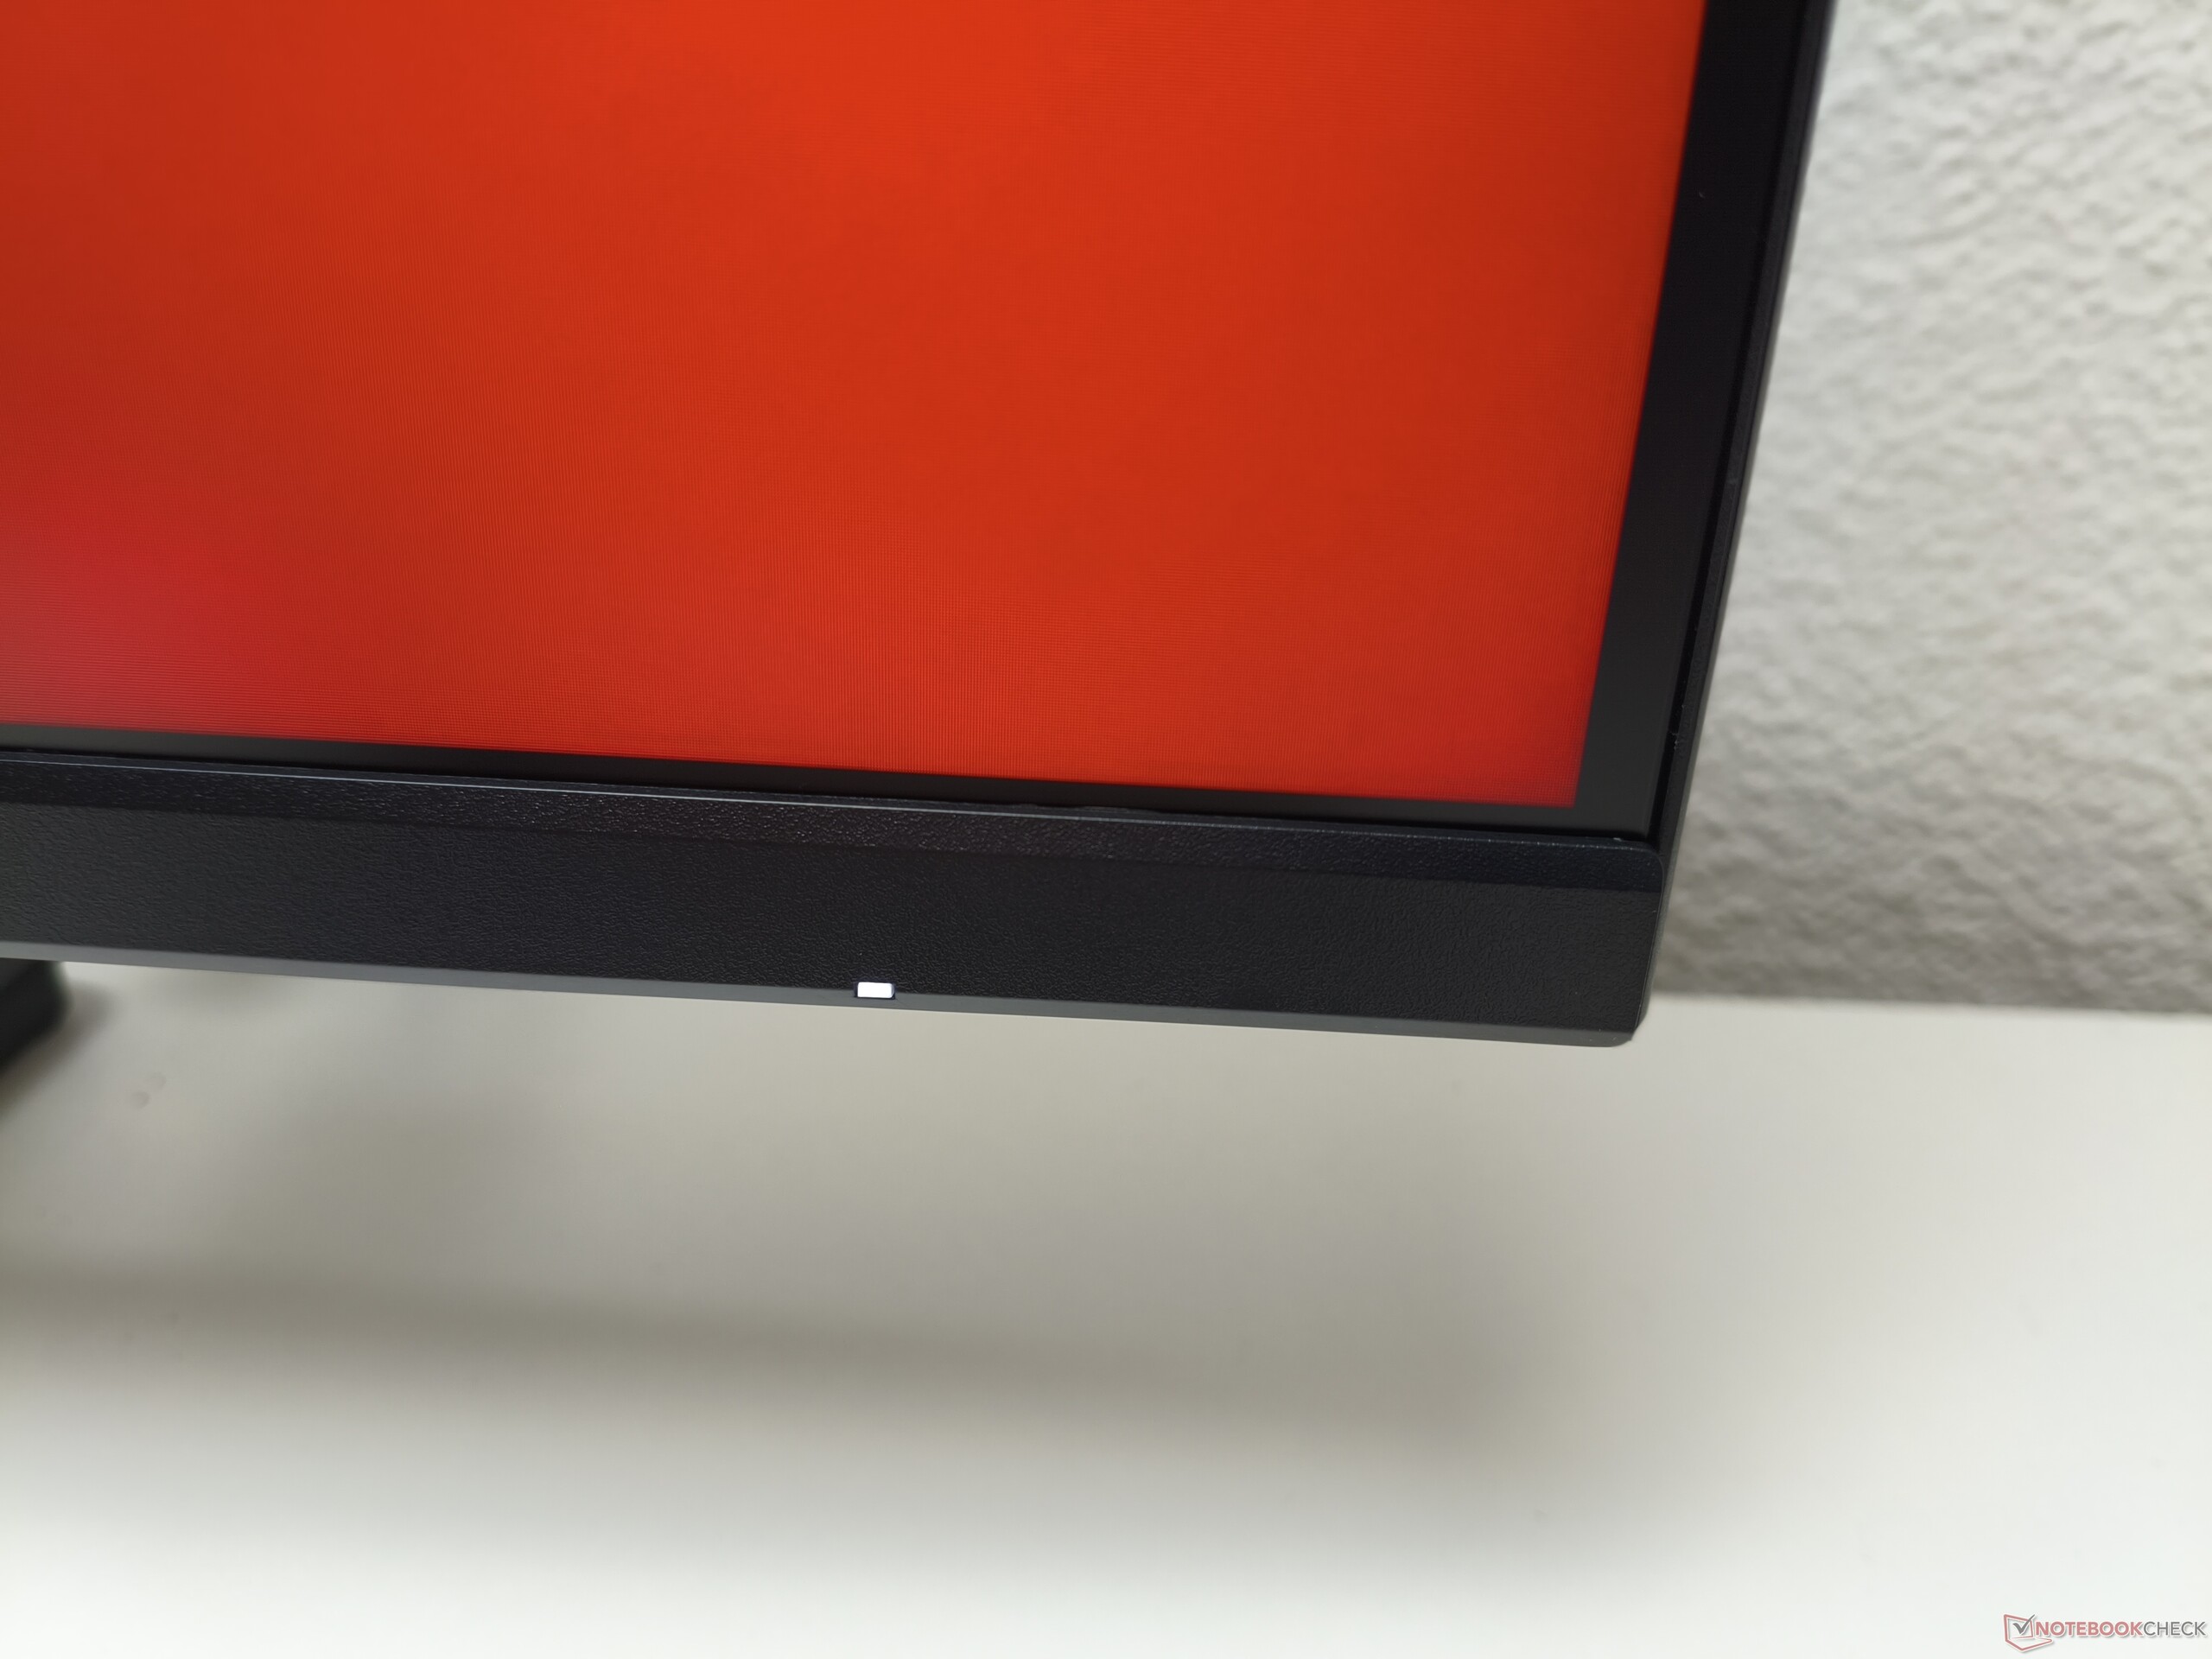
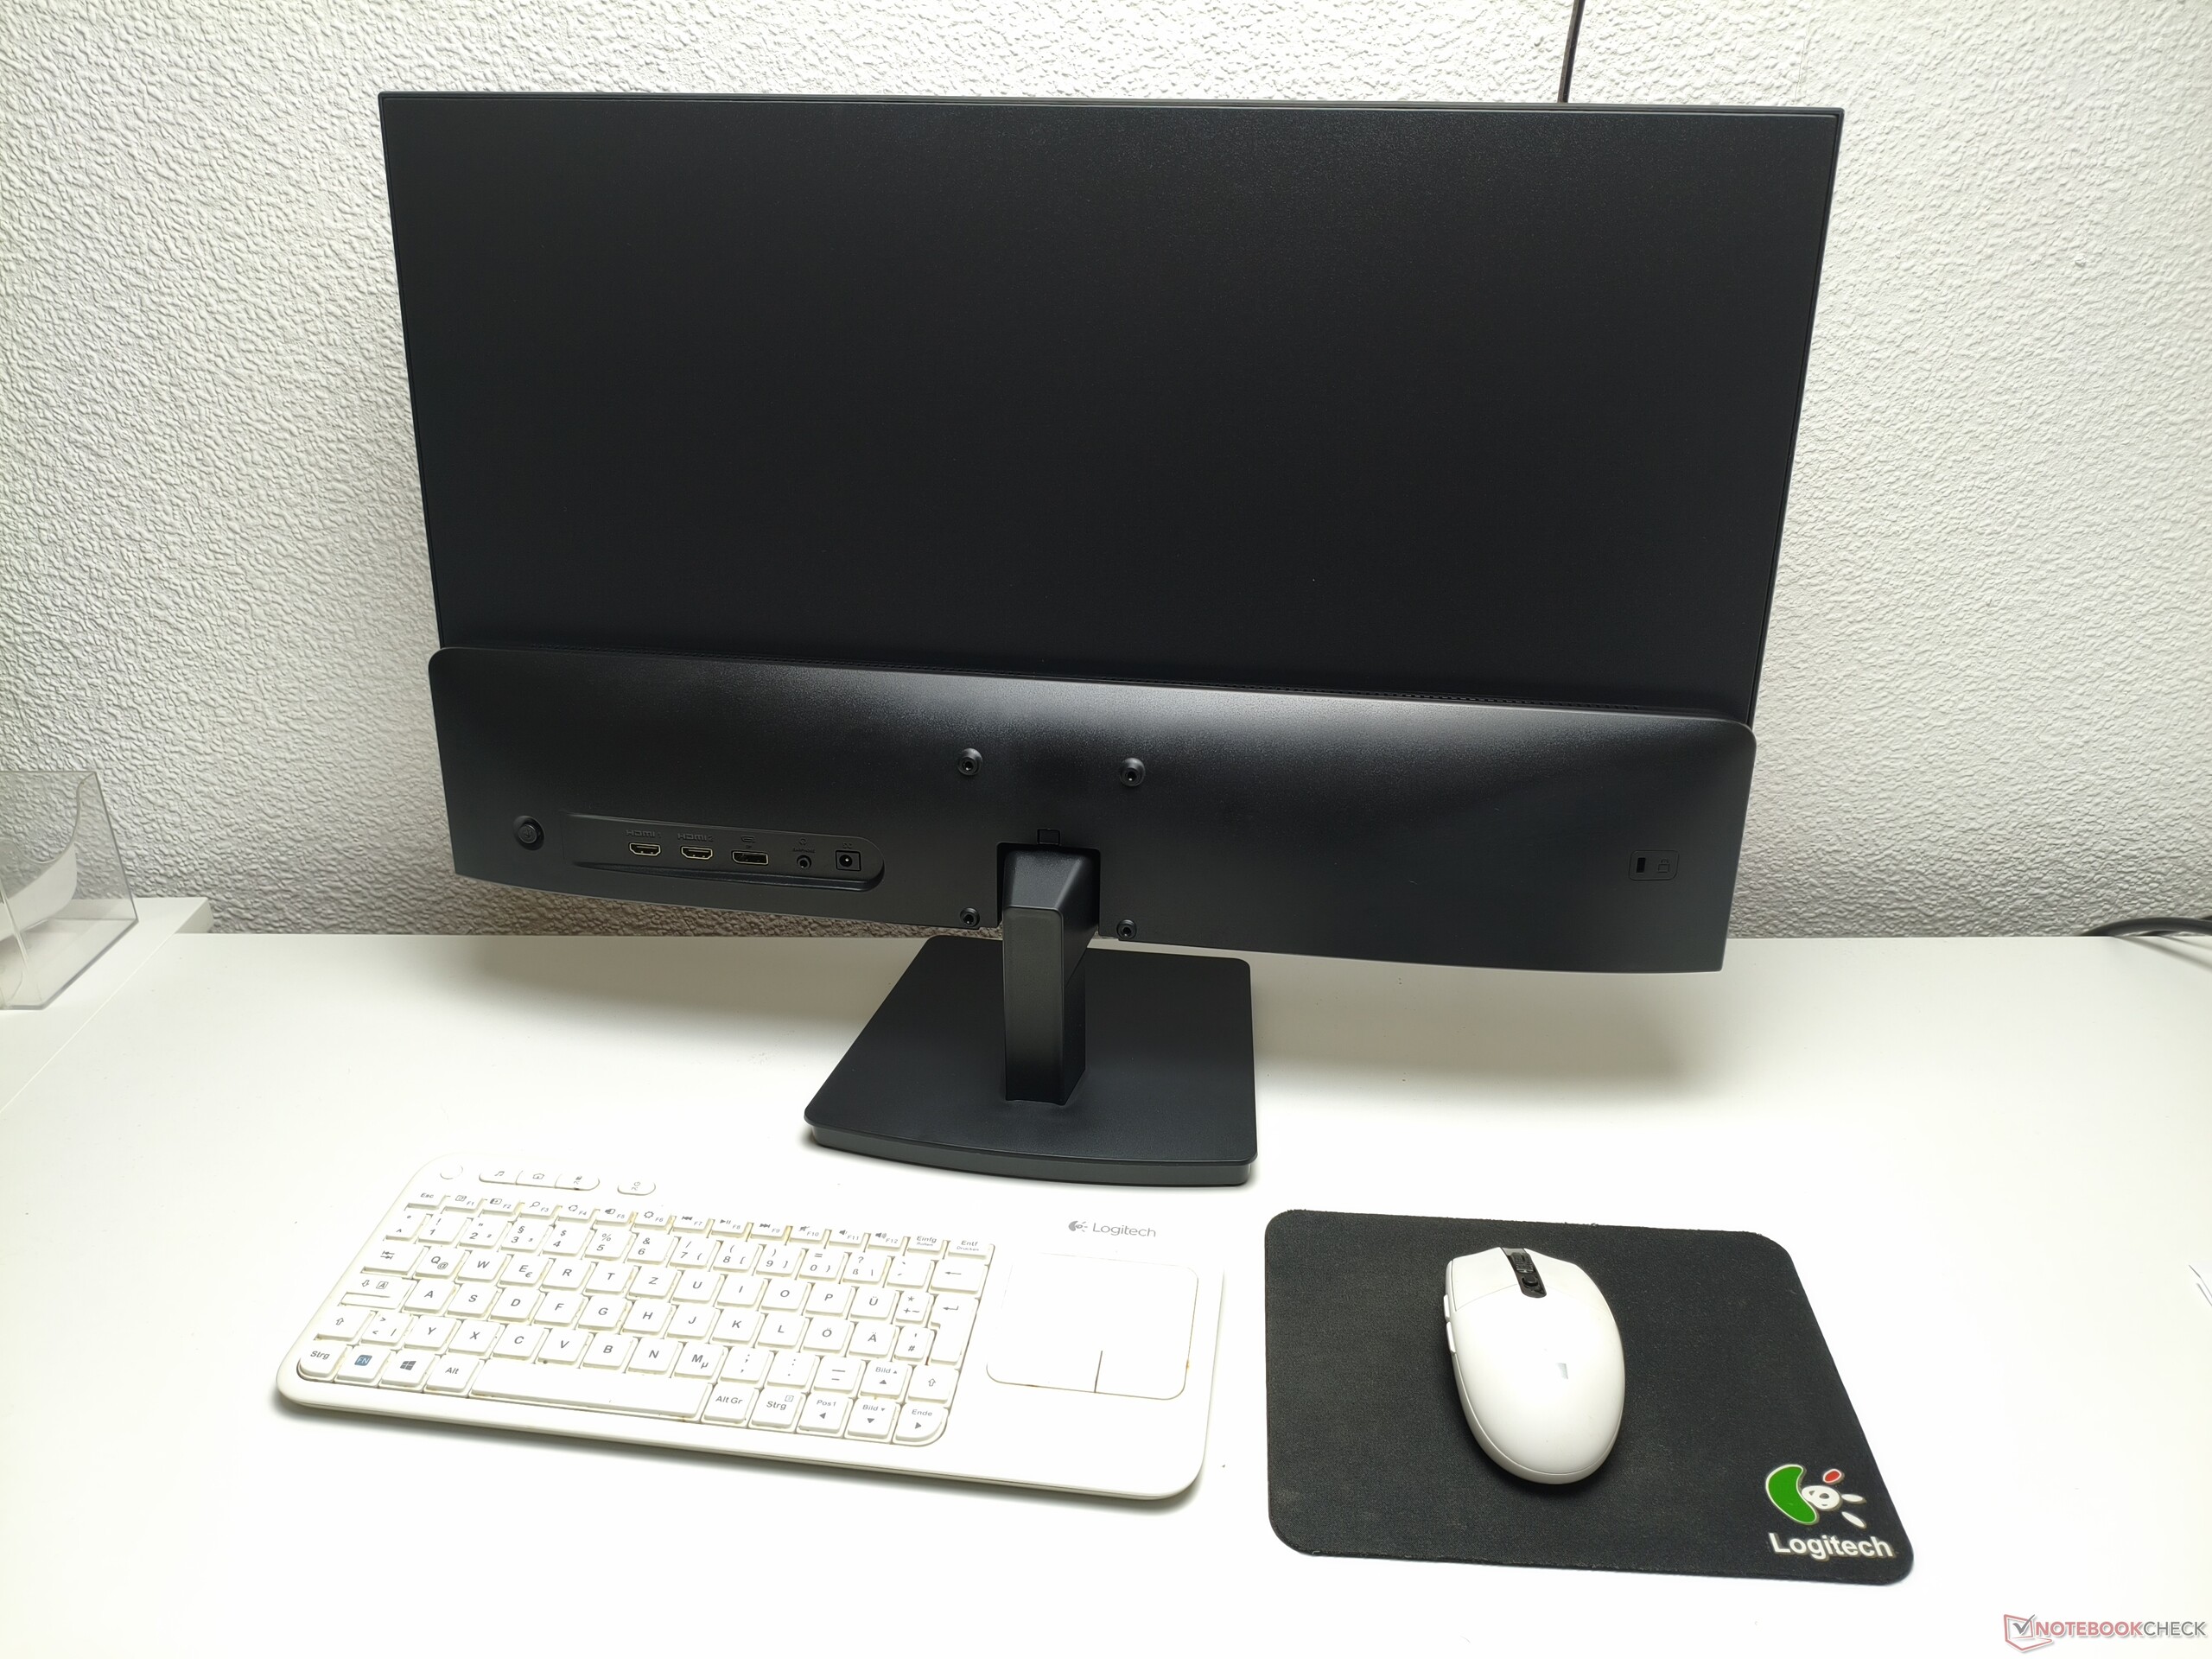
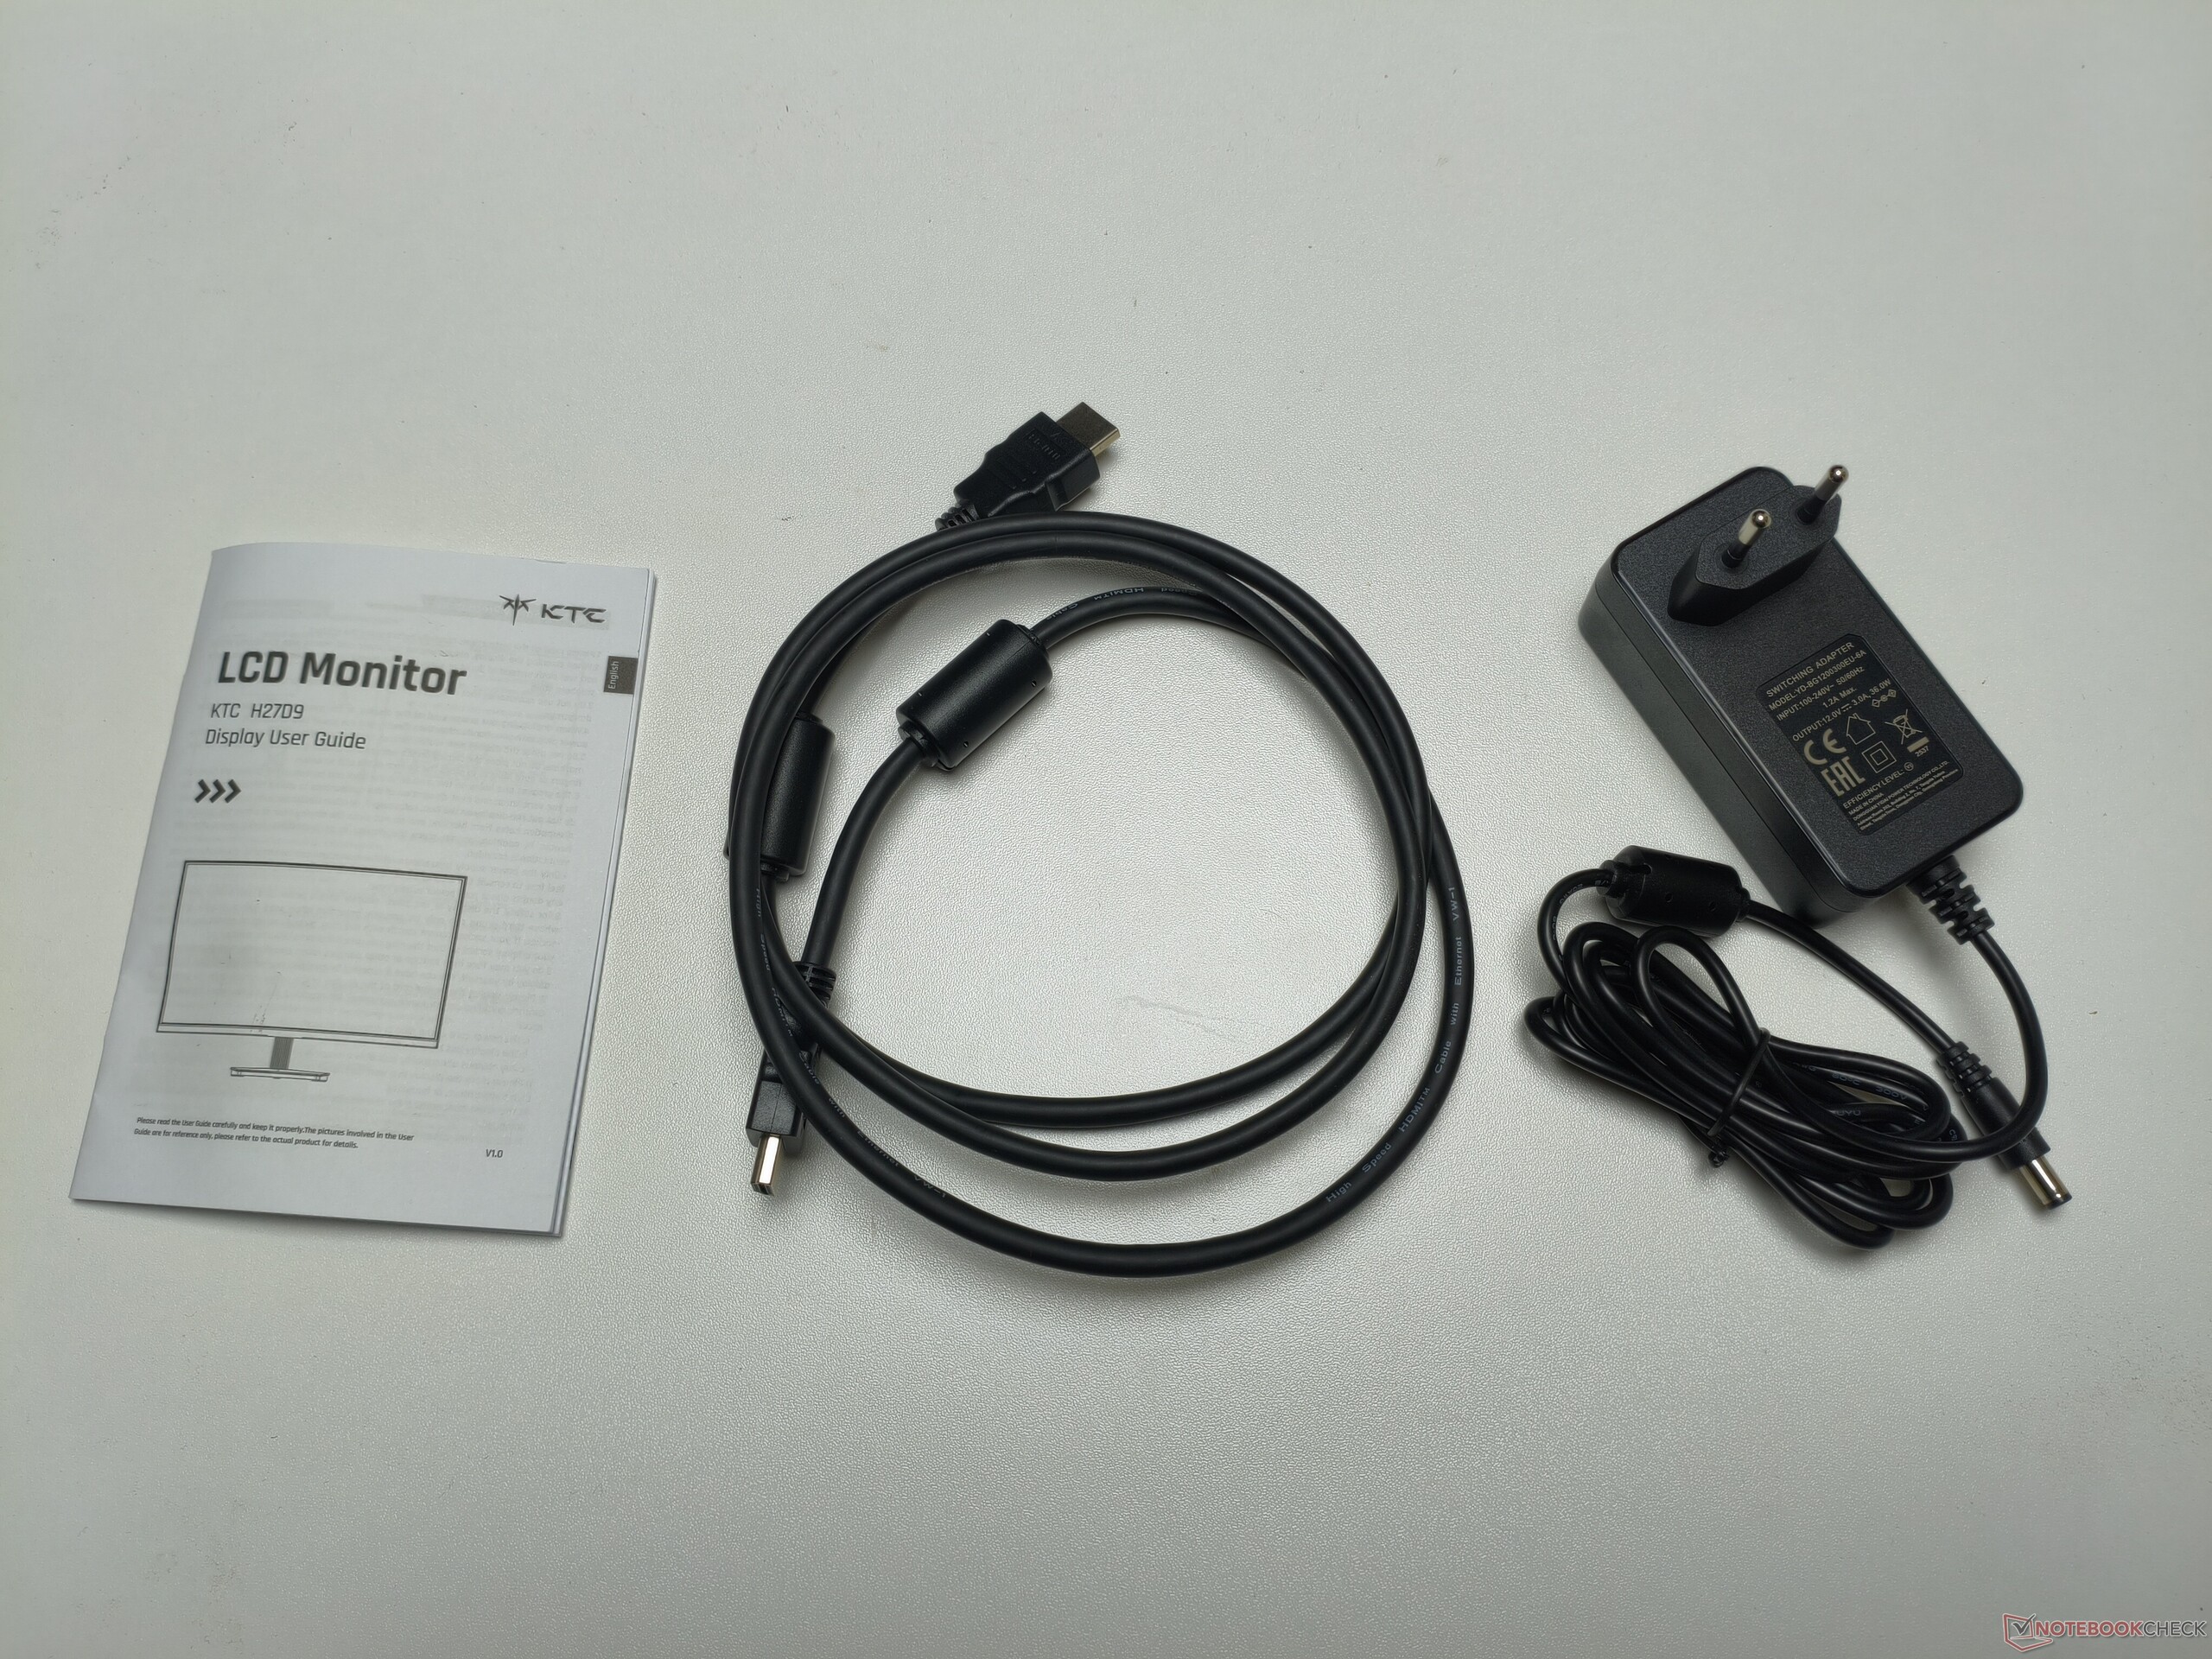
The KTC H27D9 has a 16:9 aspect ratio, a 100 Hz refresh rate, and a resolution of 2,560 × 1,440 pixels—a good fit for its 27-inch screen. It also supports HDR and Adaptive Sync (FreeSync/G-Sync). At 3.6 kg, the monitor feels fairly light. Power comes from an external adapter rated at 36 watts, with relatively modest power consumption compared with other monitors. We particularly liked the slim top and side bezels. As the photos show, the plastic housing has a fairly understated design.
Features
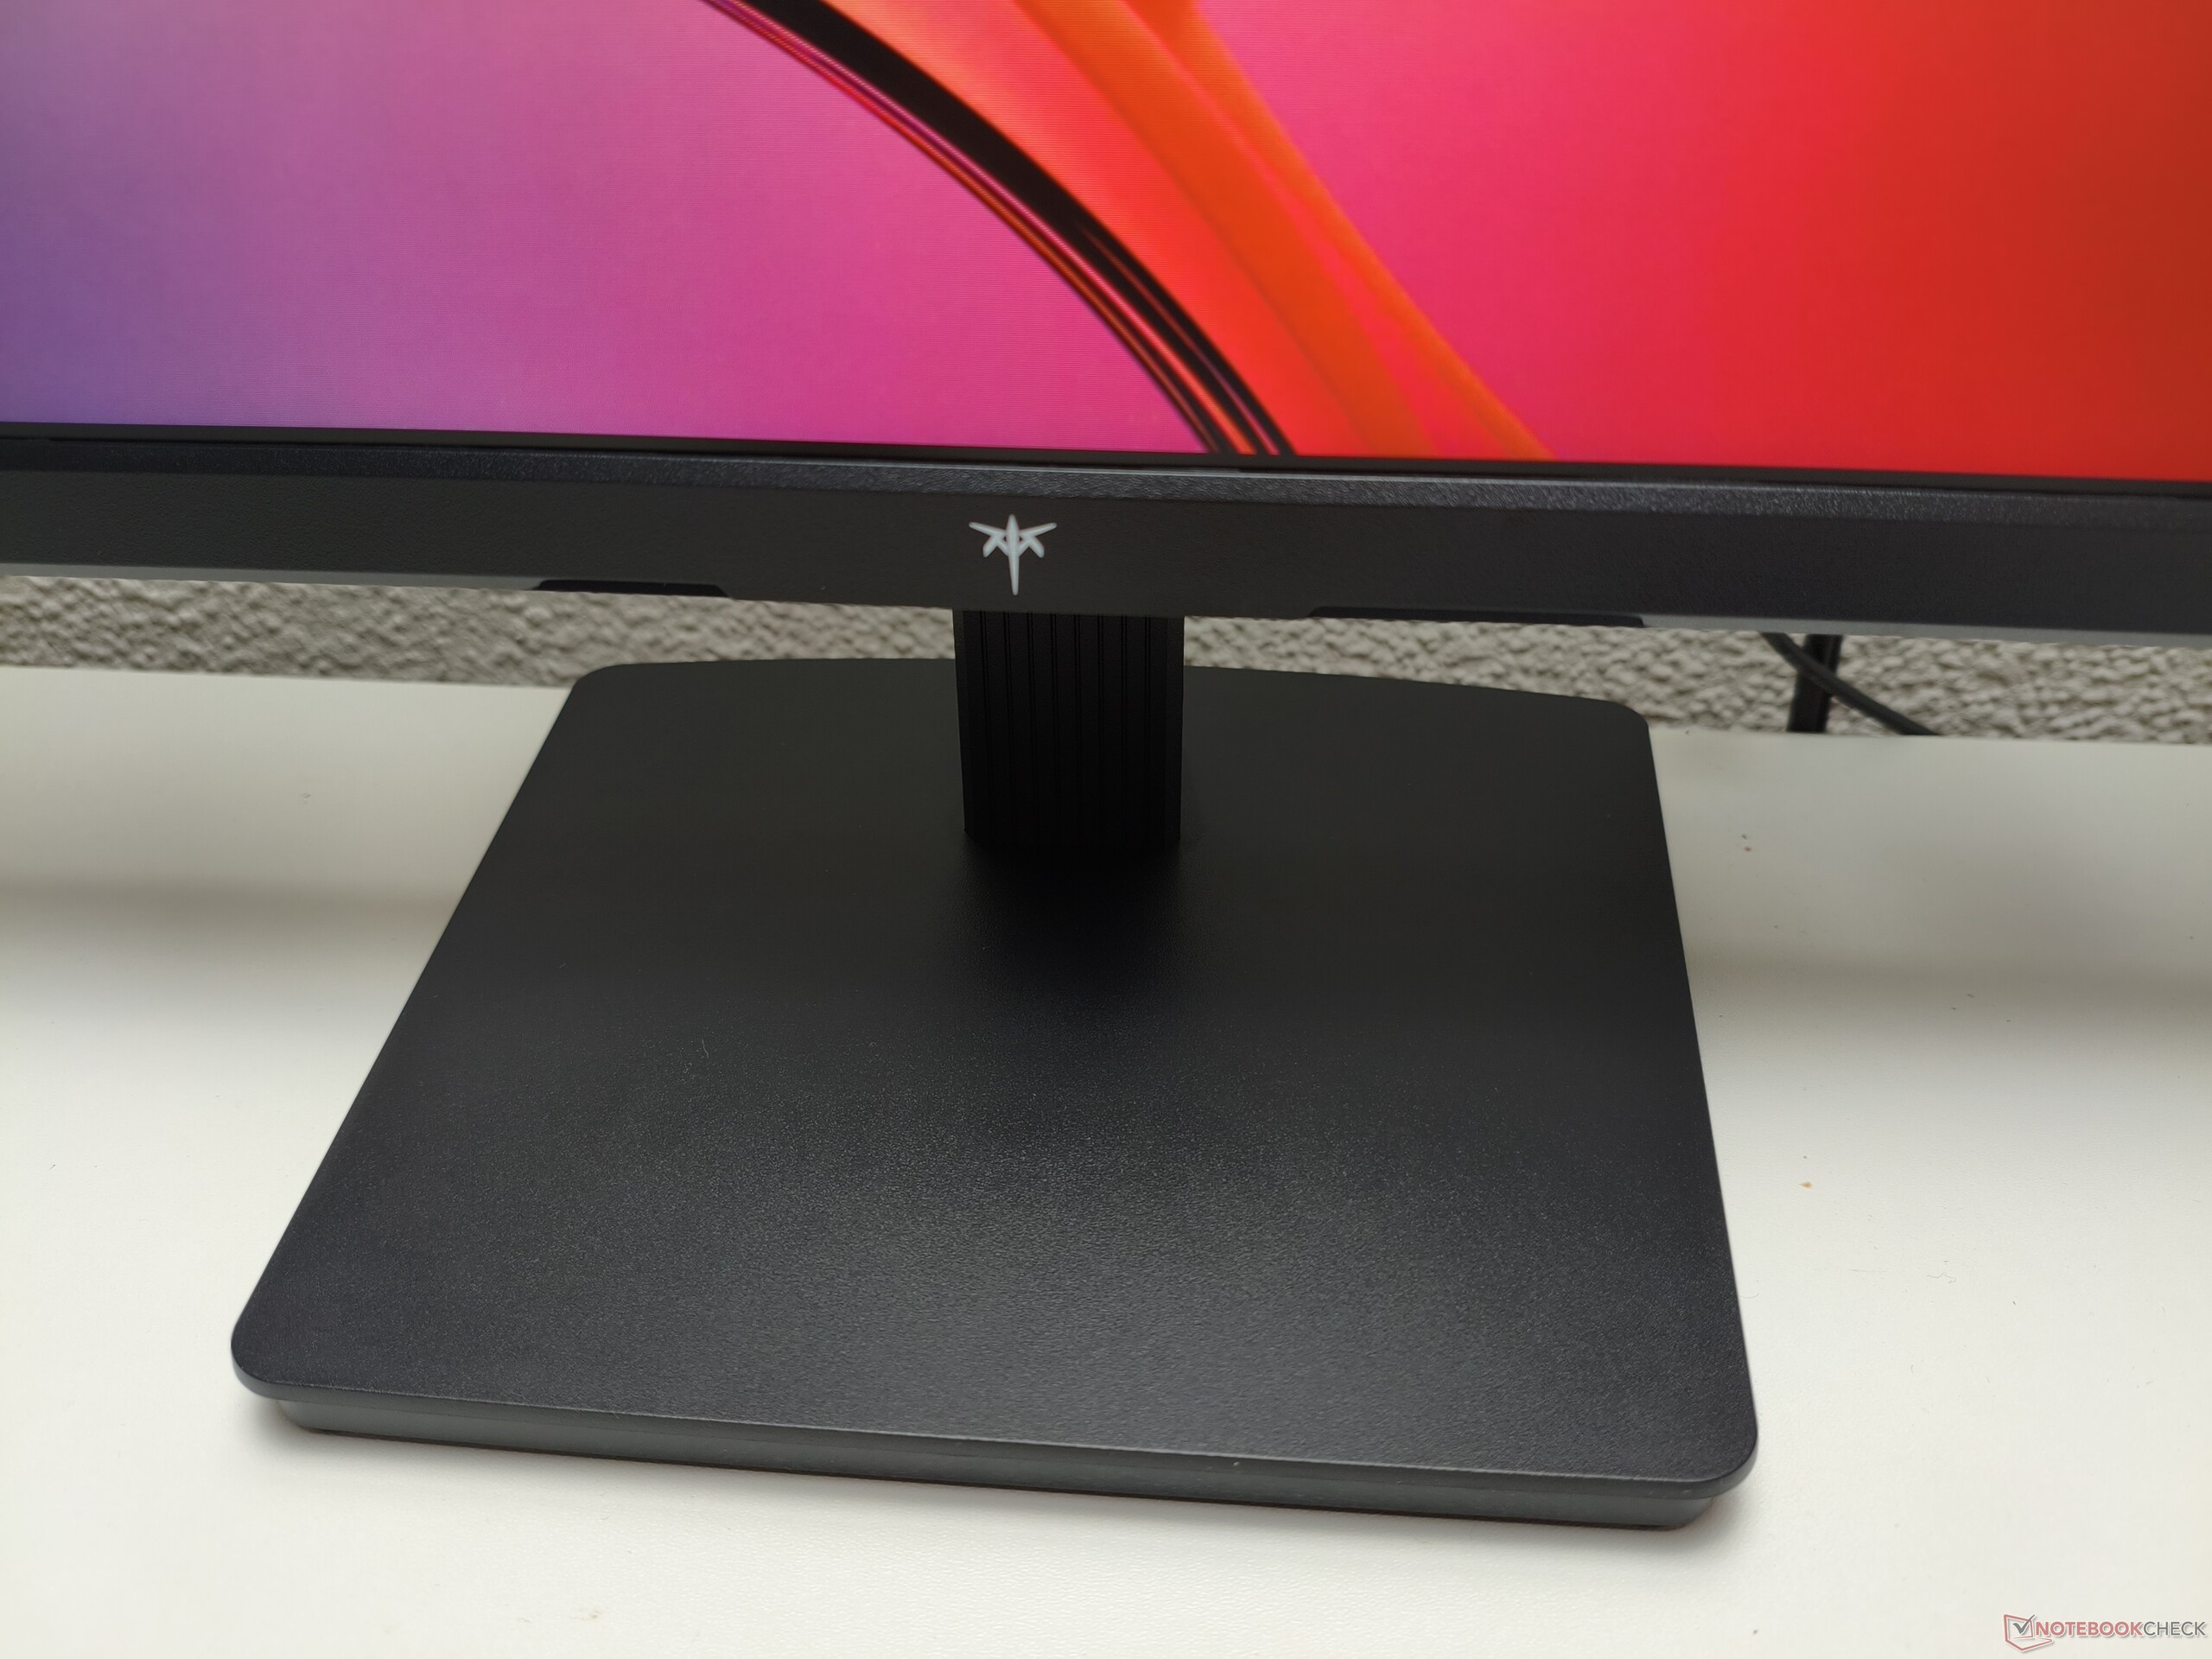
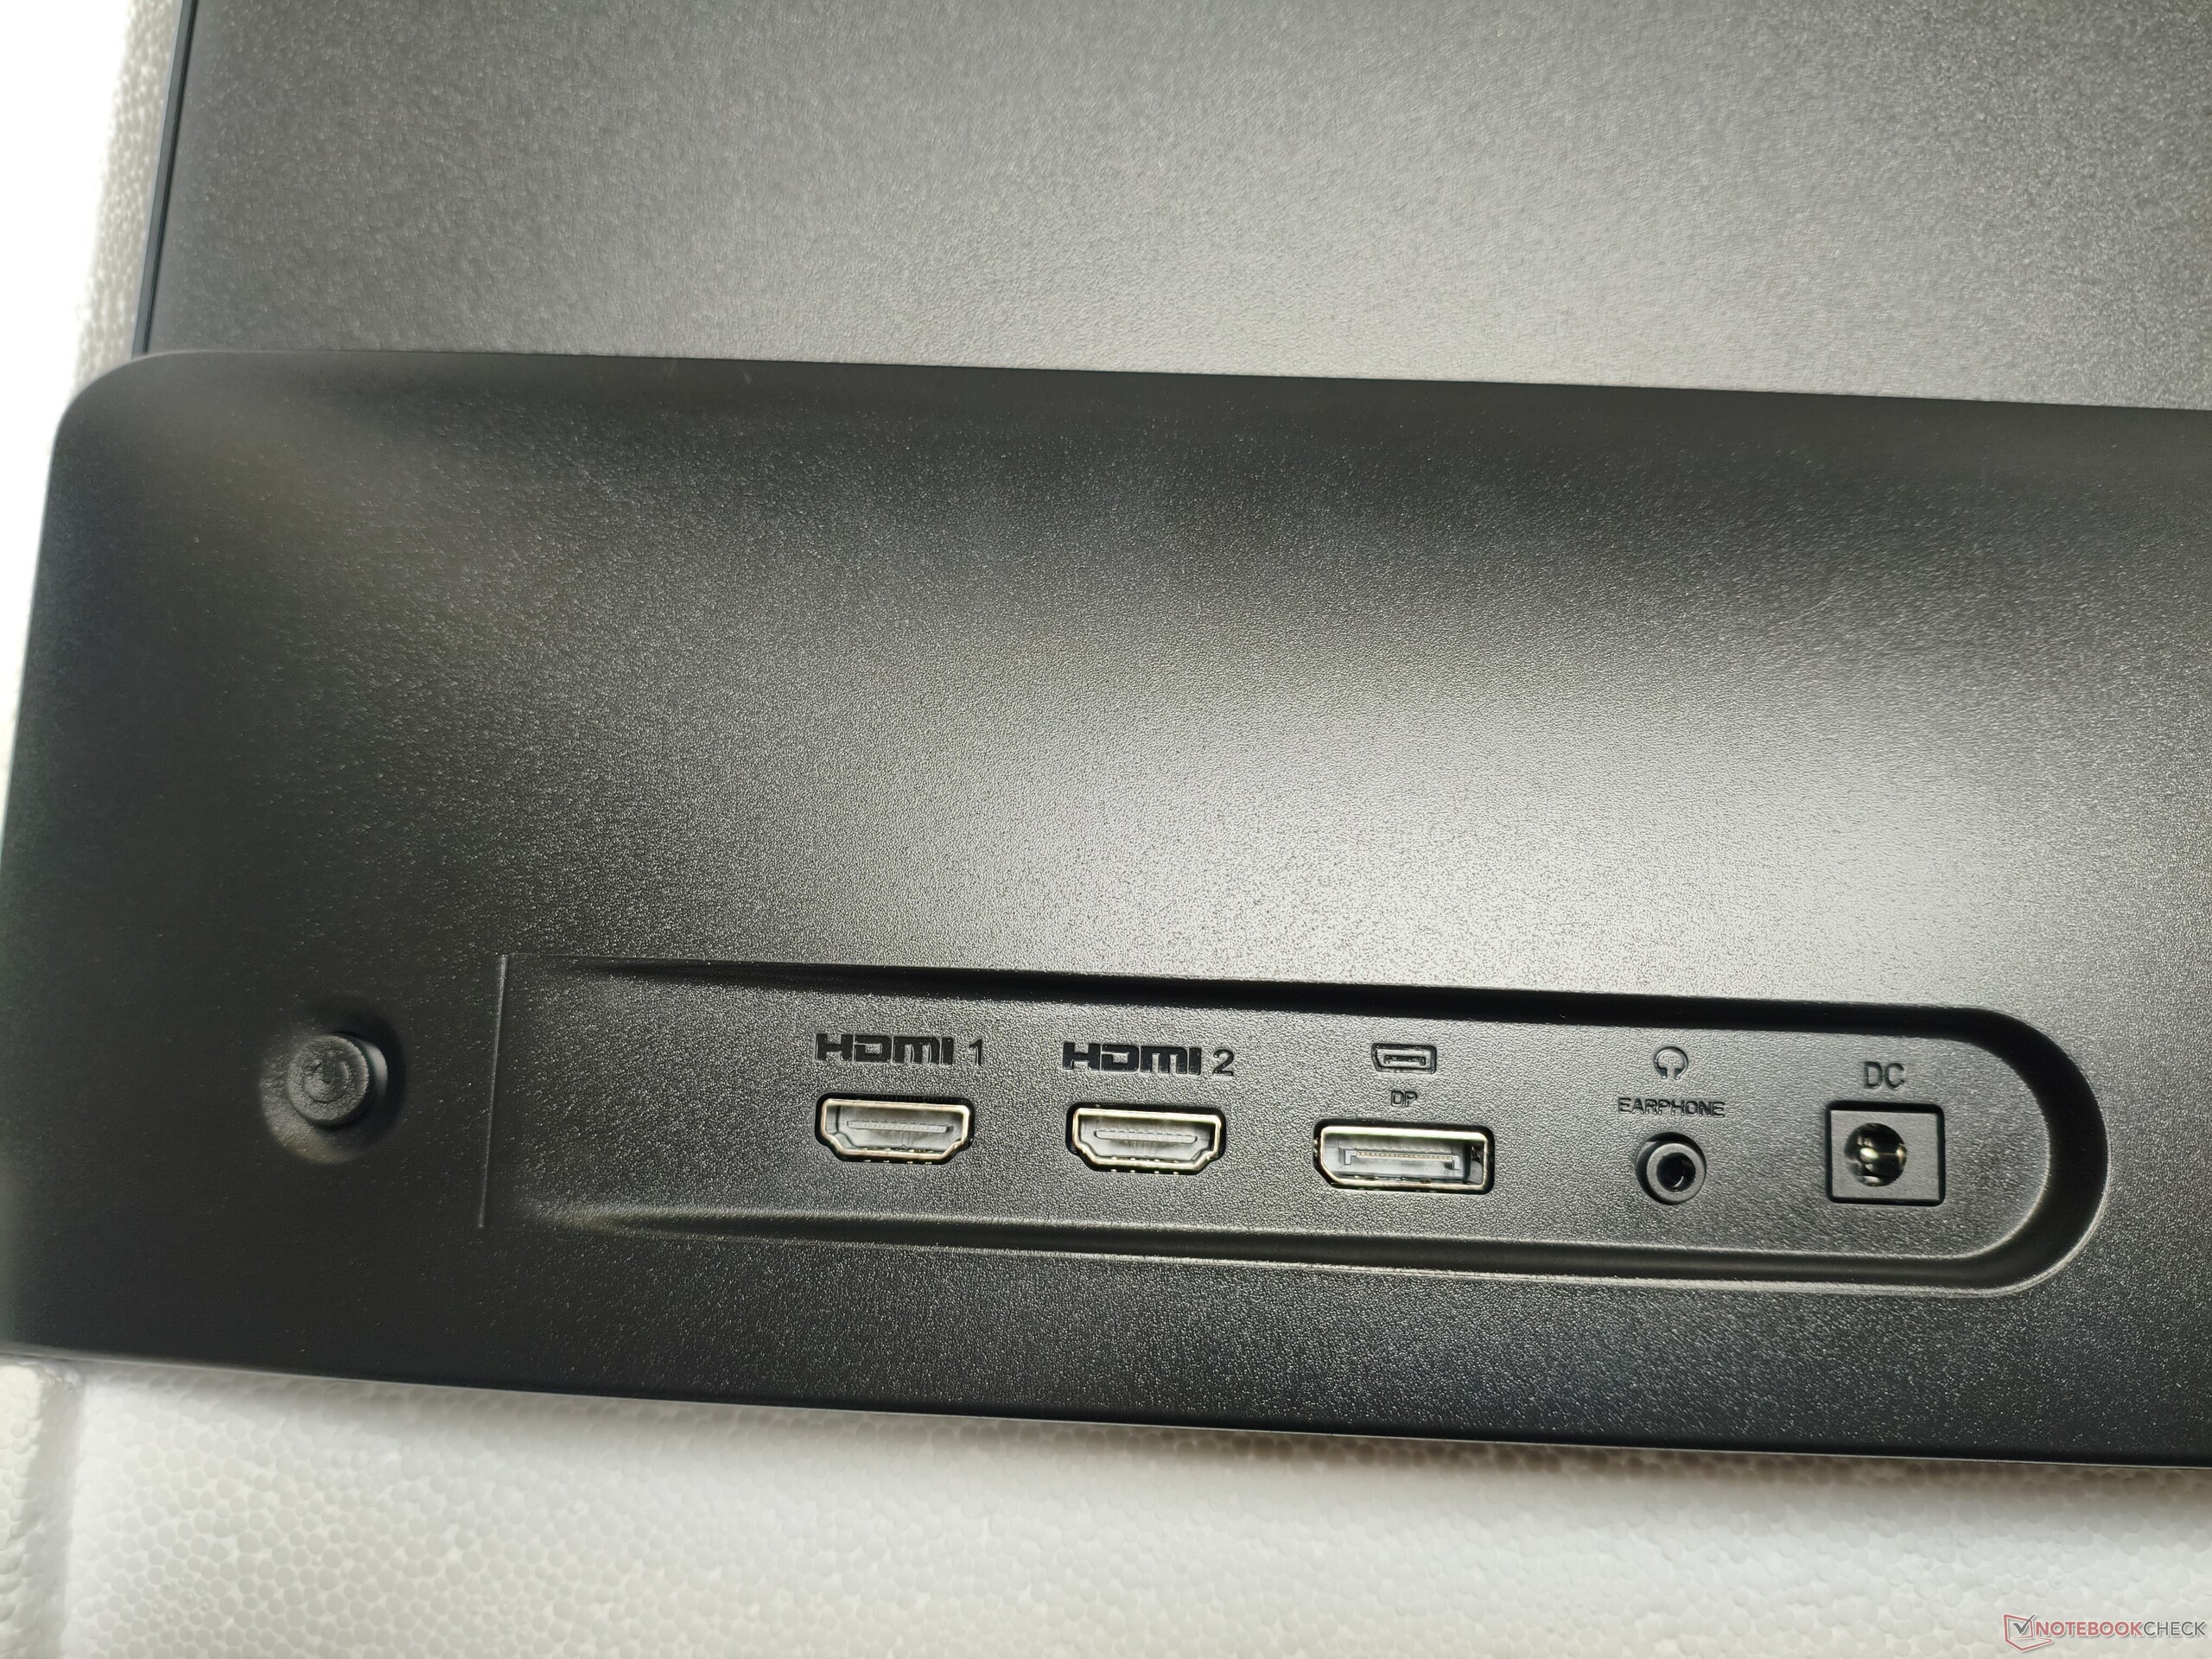
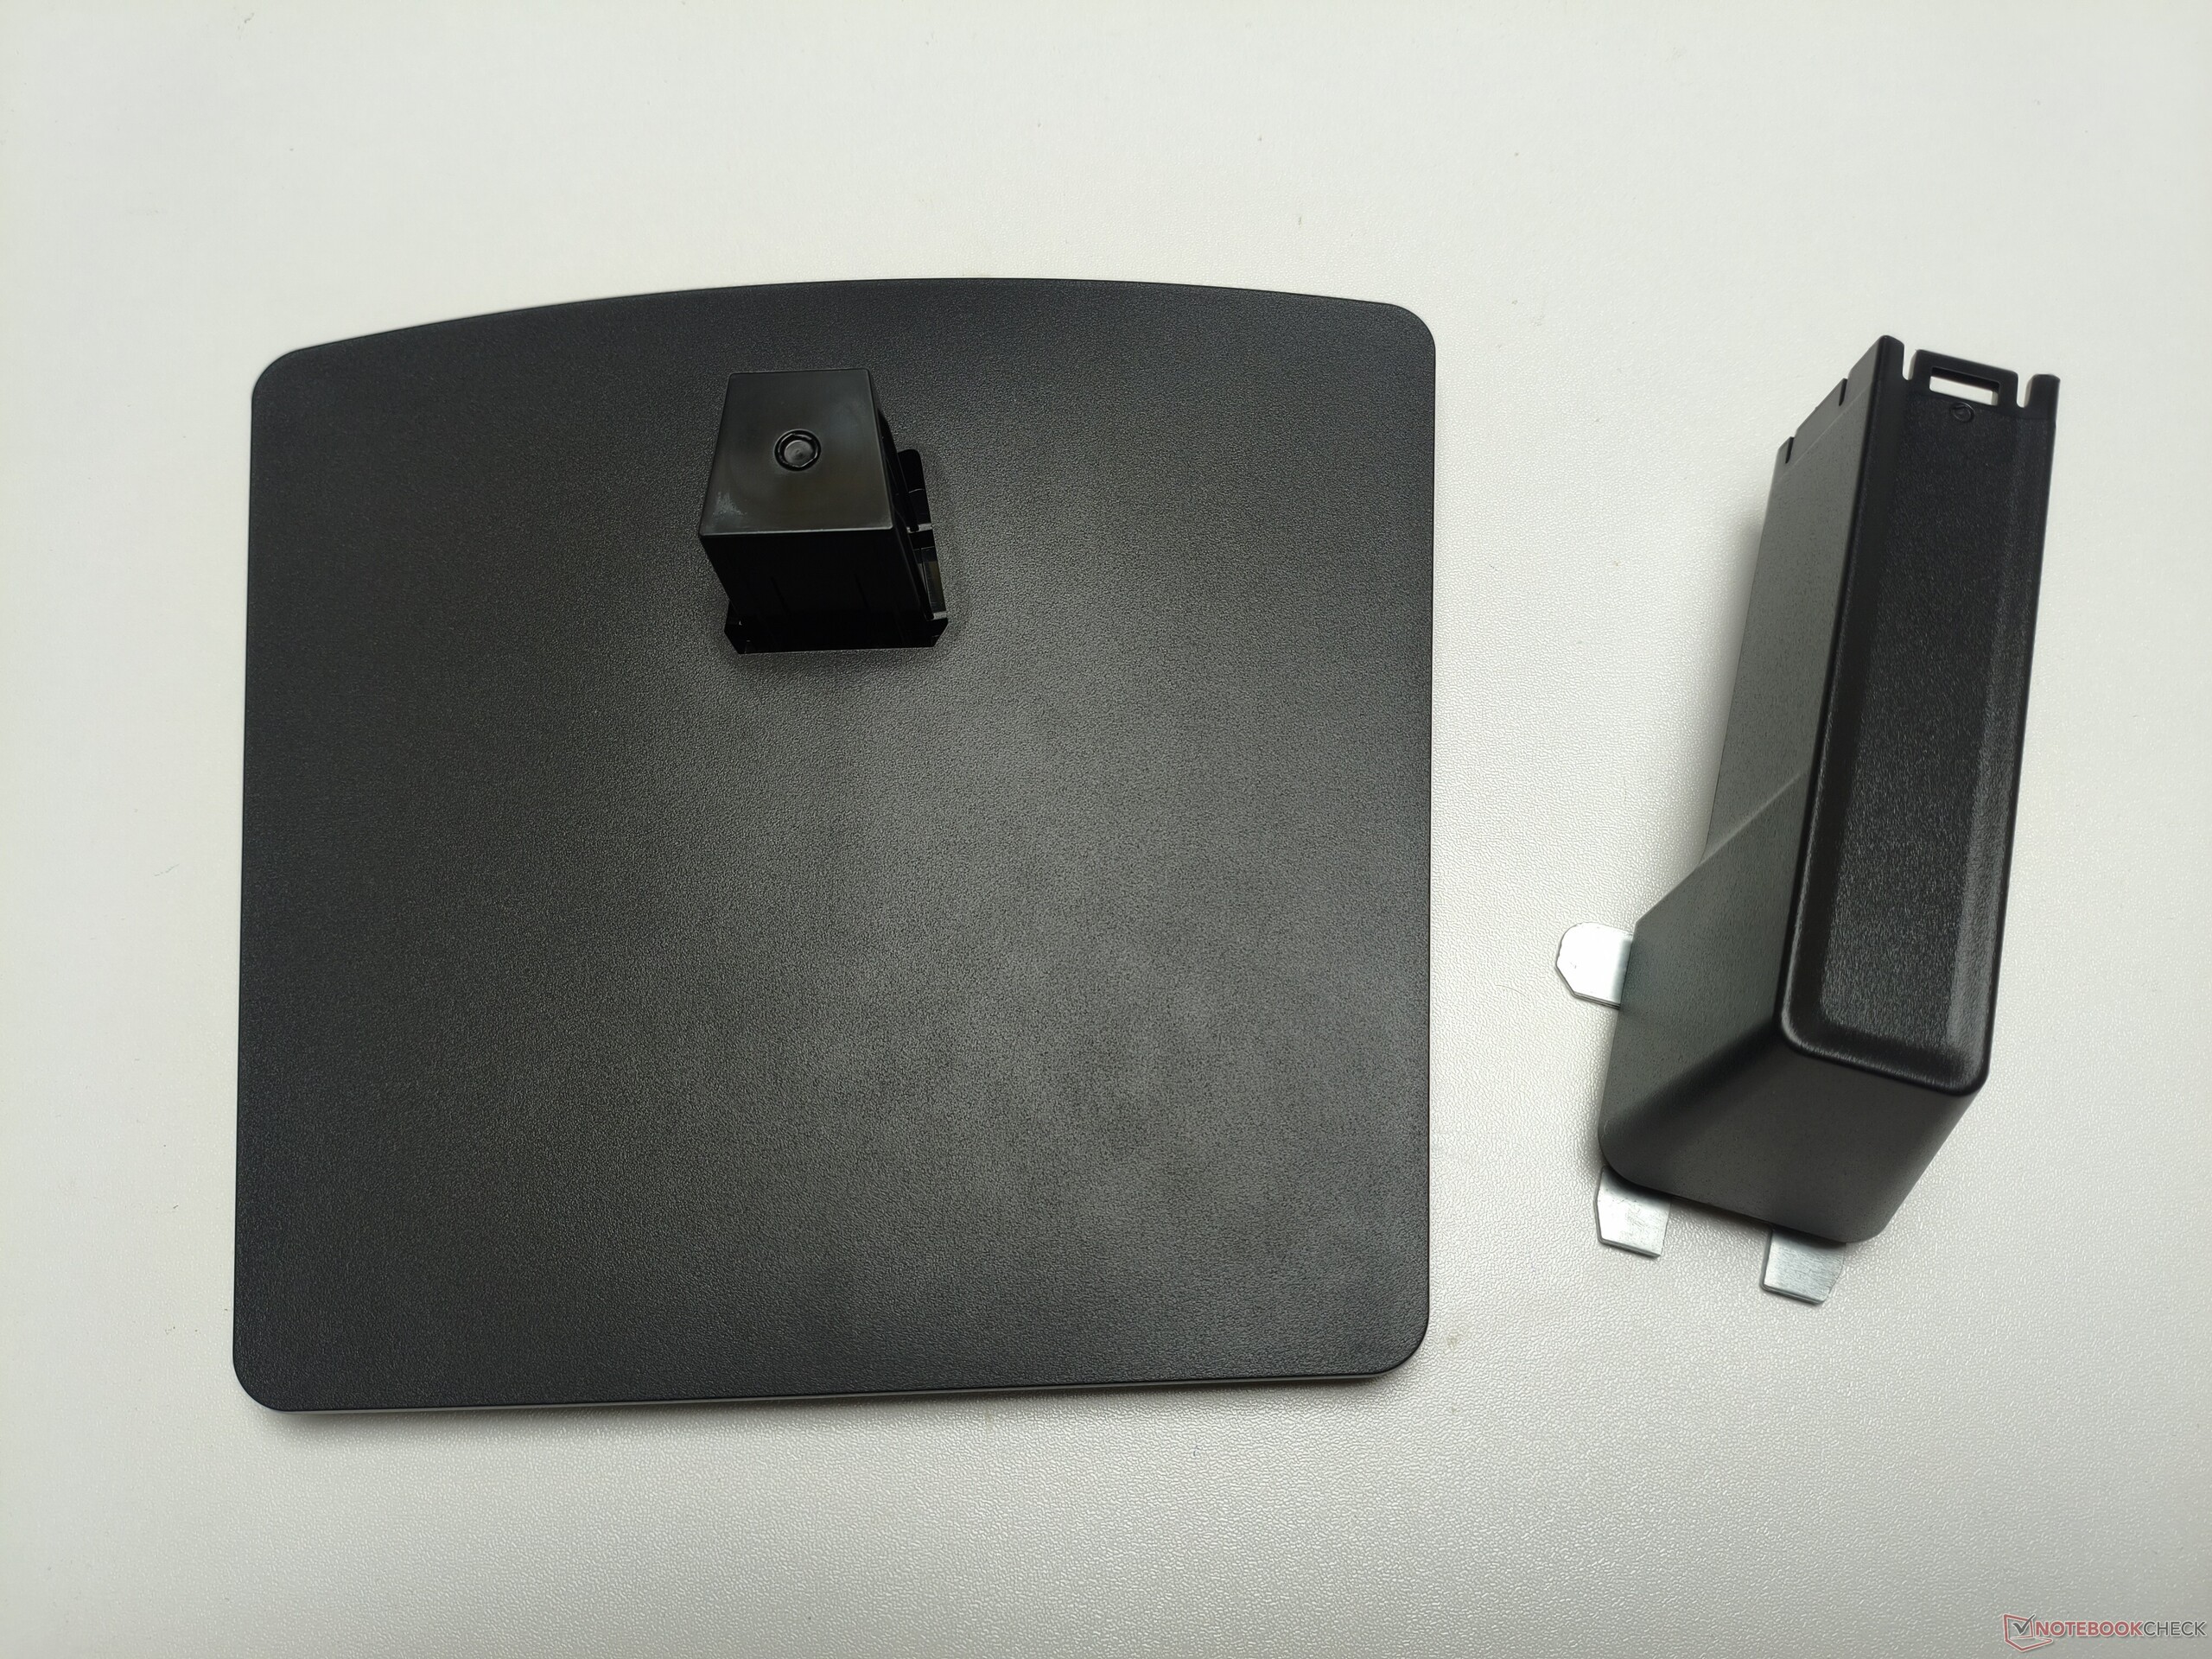
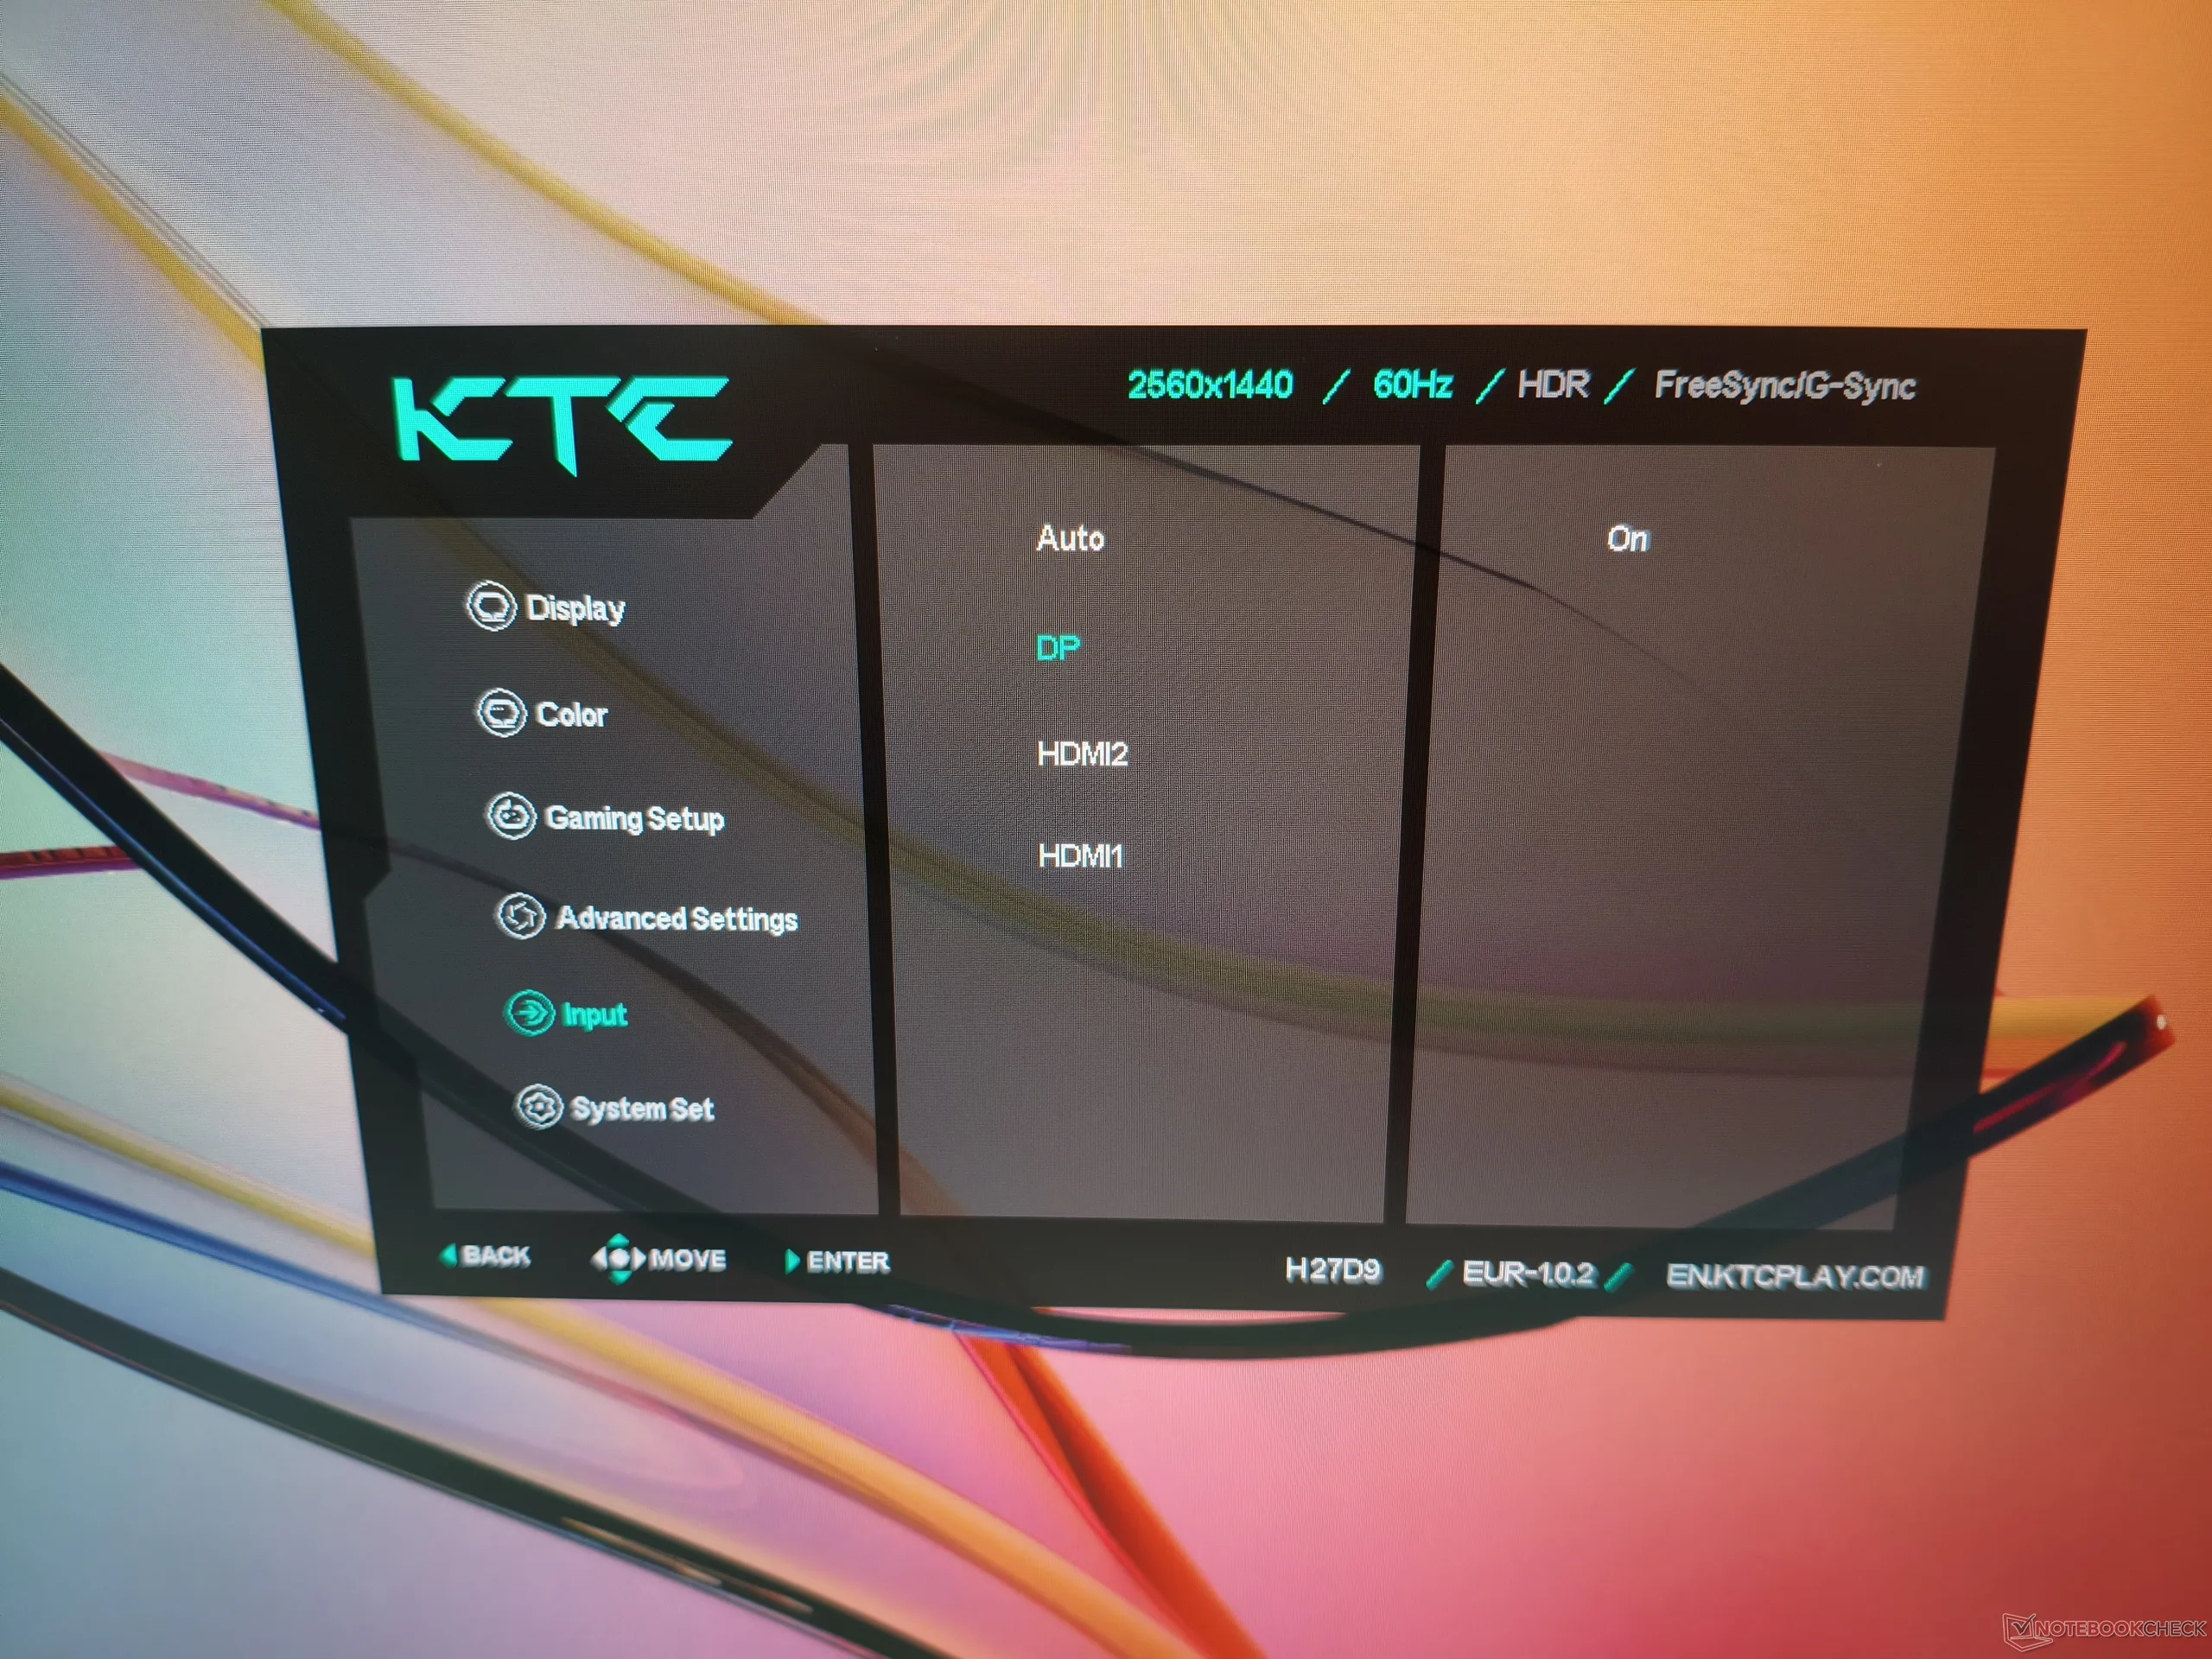
On the rear, the KTC H27D9 has two HDMI 2.0 ports, one DisplayPort 1.4 input, an audio jack, and a Kensington lock slot. This selection is entirely reasonable for the asking price, although we would have liked at least one USB port as well. The ports are accessible without much awkward maneuvering. Assembly is refreshingly straightforward: the stand and base slot into place in seconds, with no tools required. Those who prefer to mount the monitor on a wall can use a 75 × 75 mm VESA mount. Unfortunately, the KTC H27D9 offers neither height nor swivel adjustment, though it does support tilt adjustment.
Controls
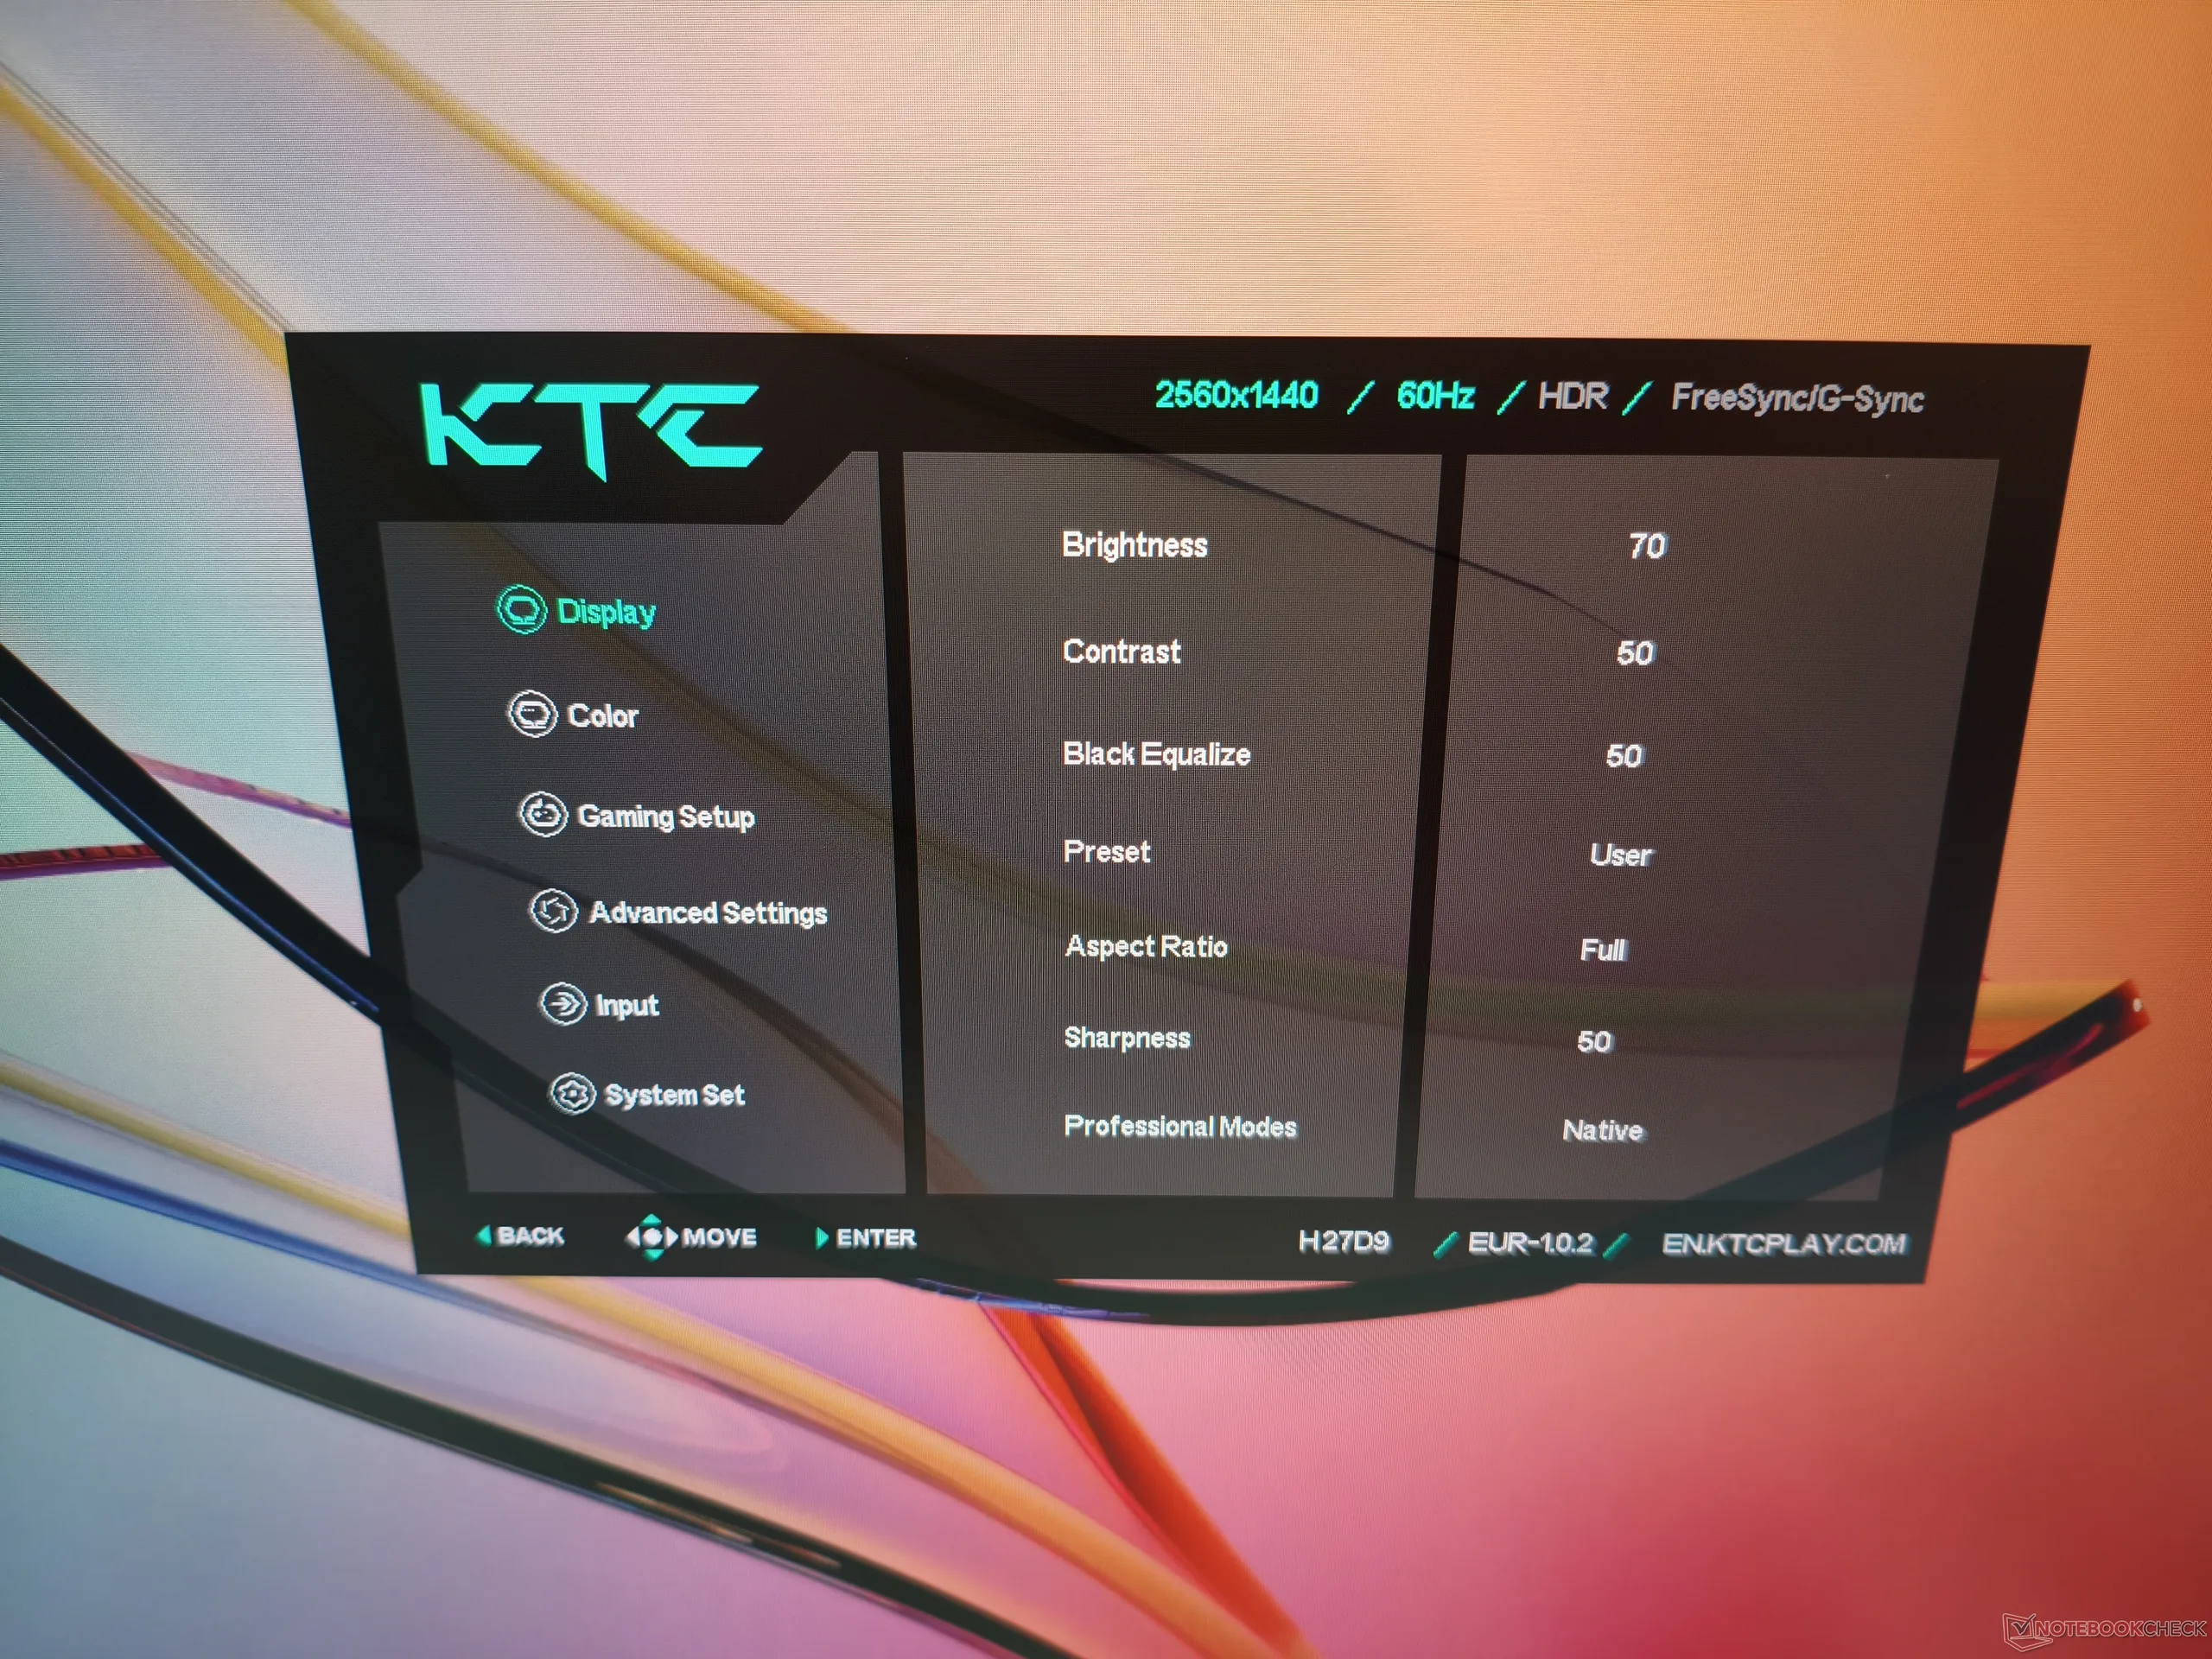
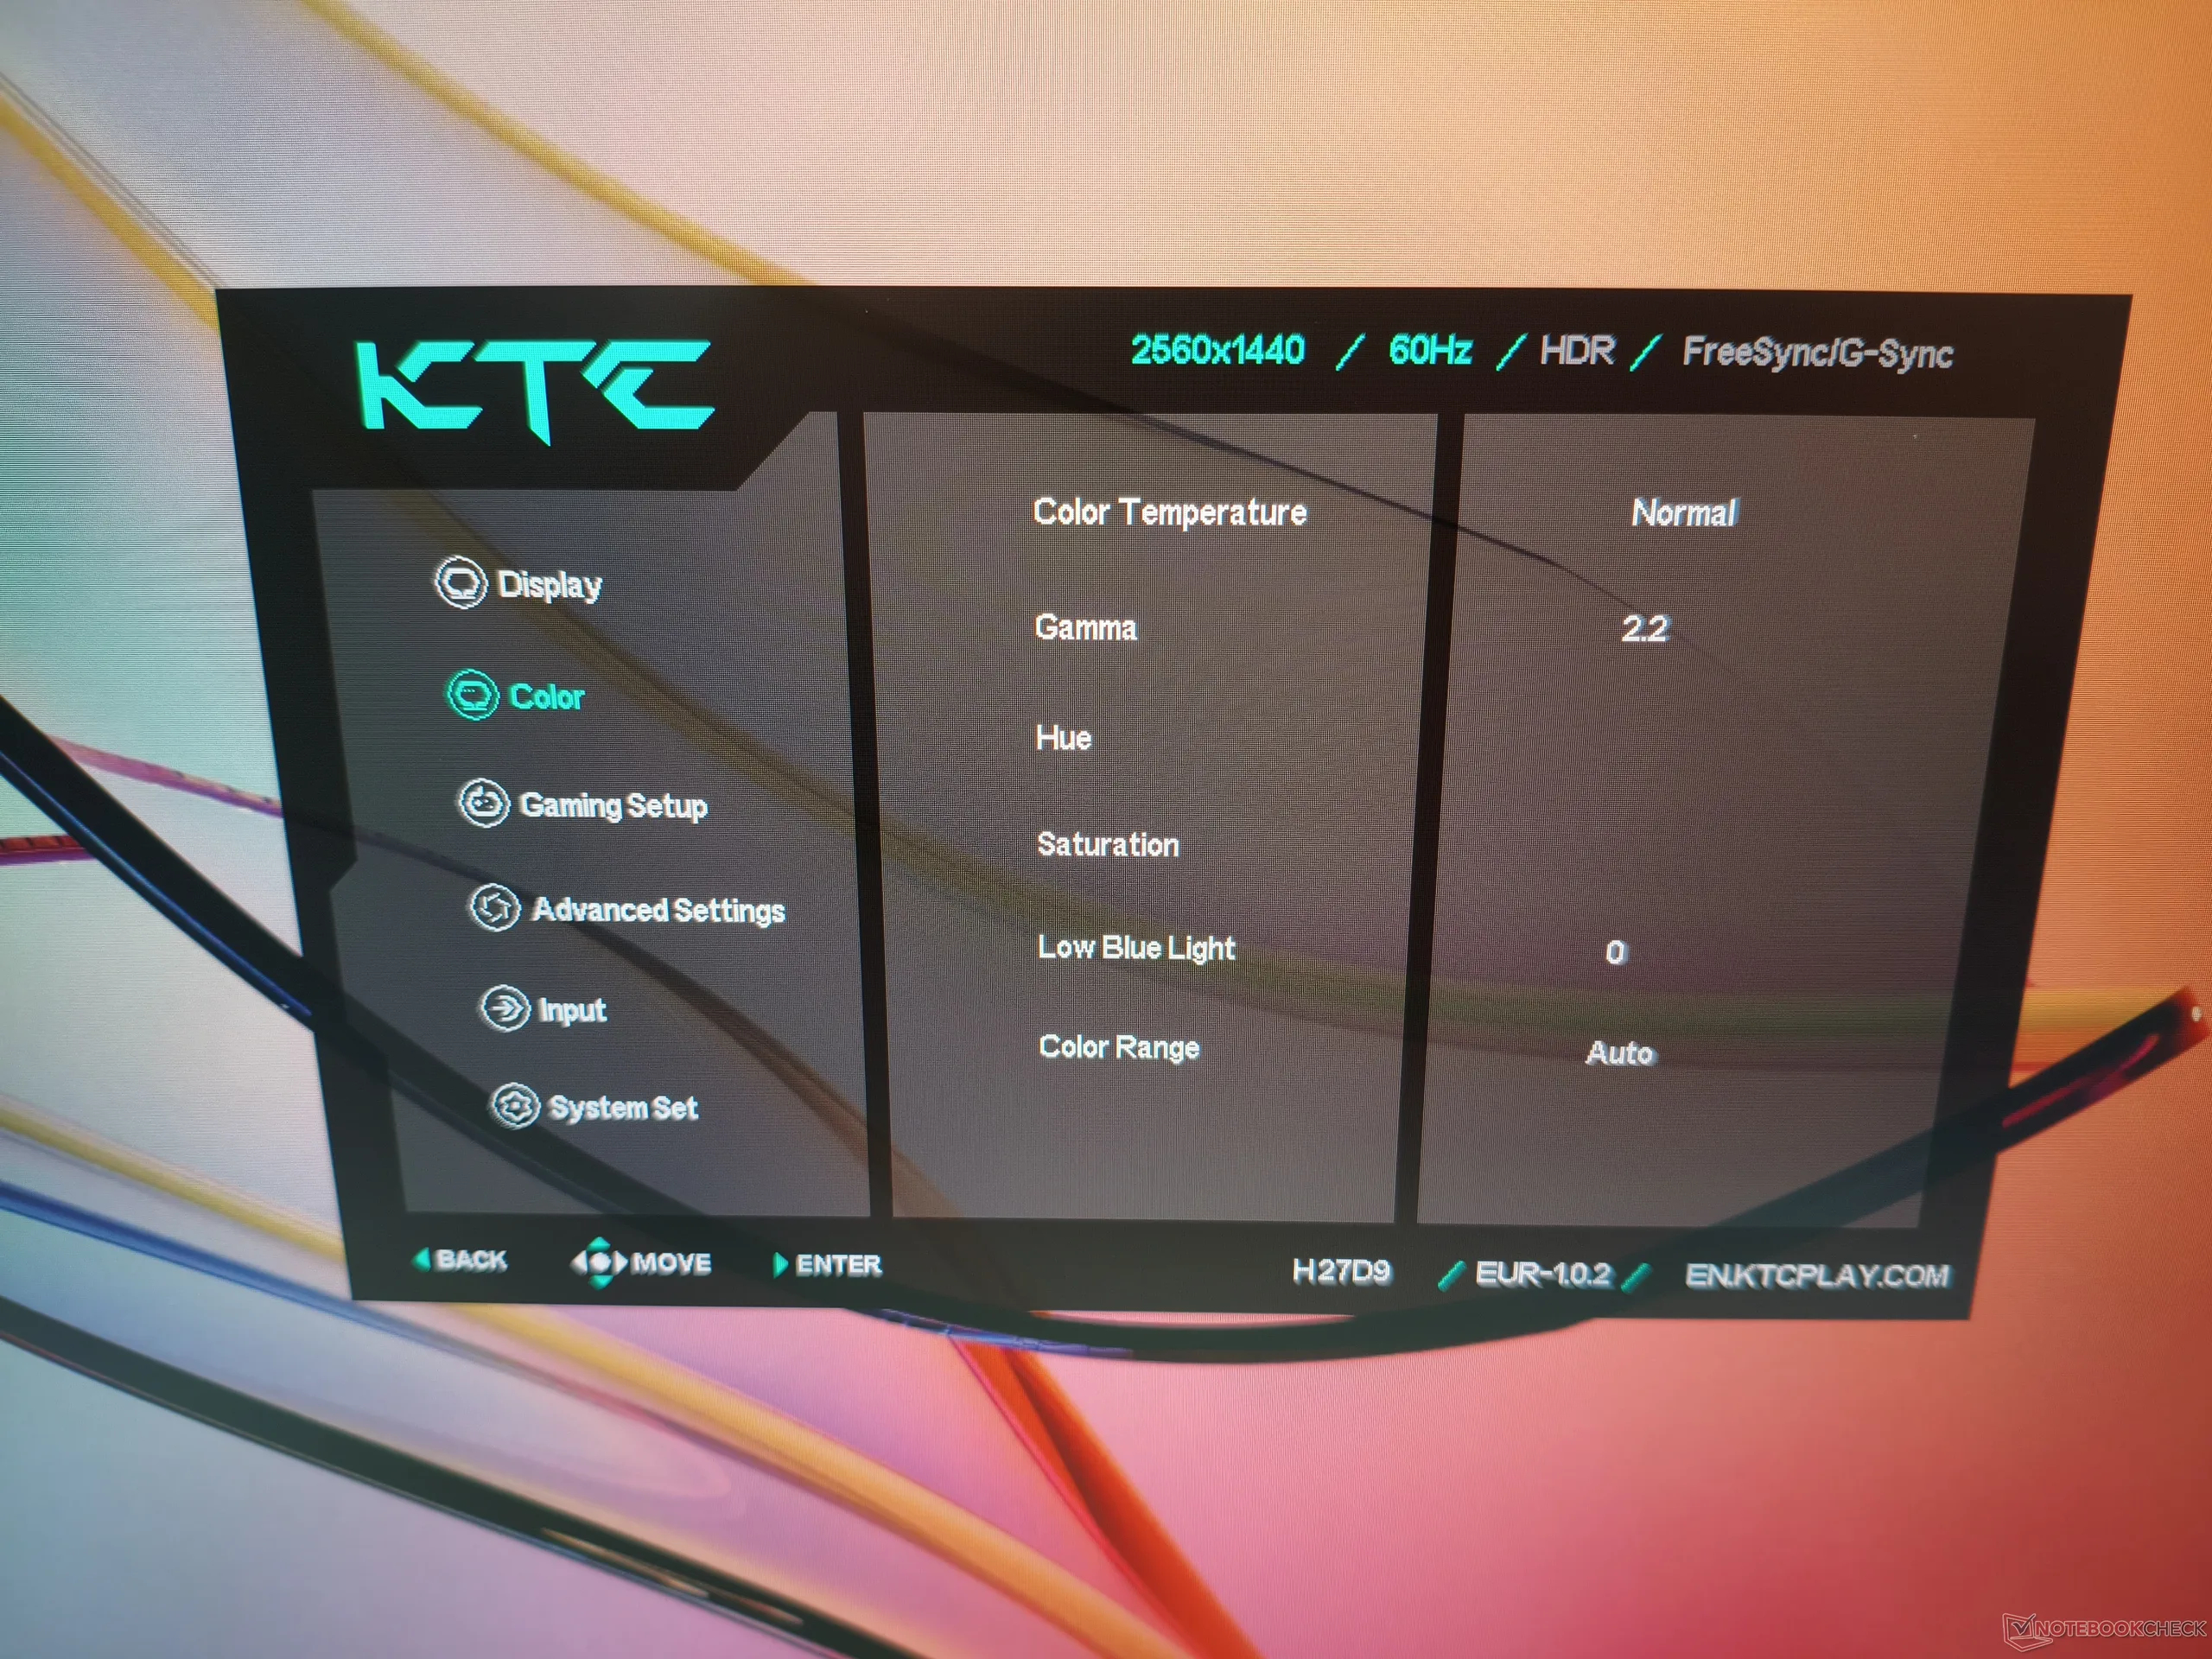
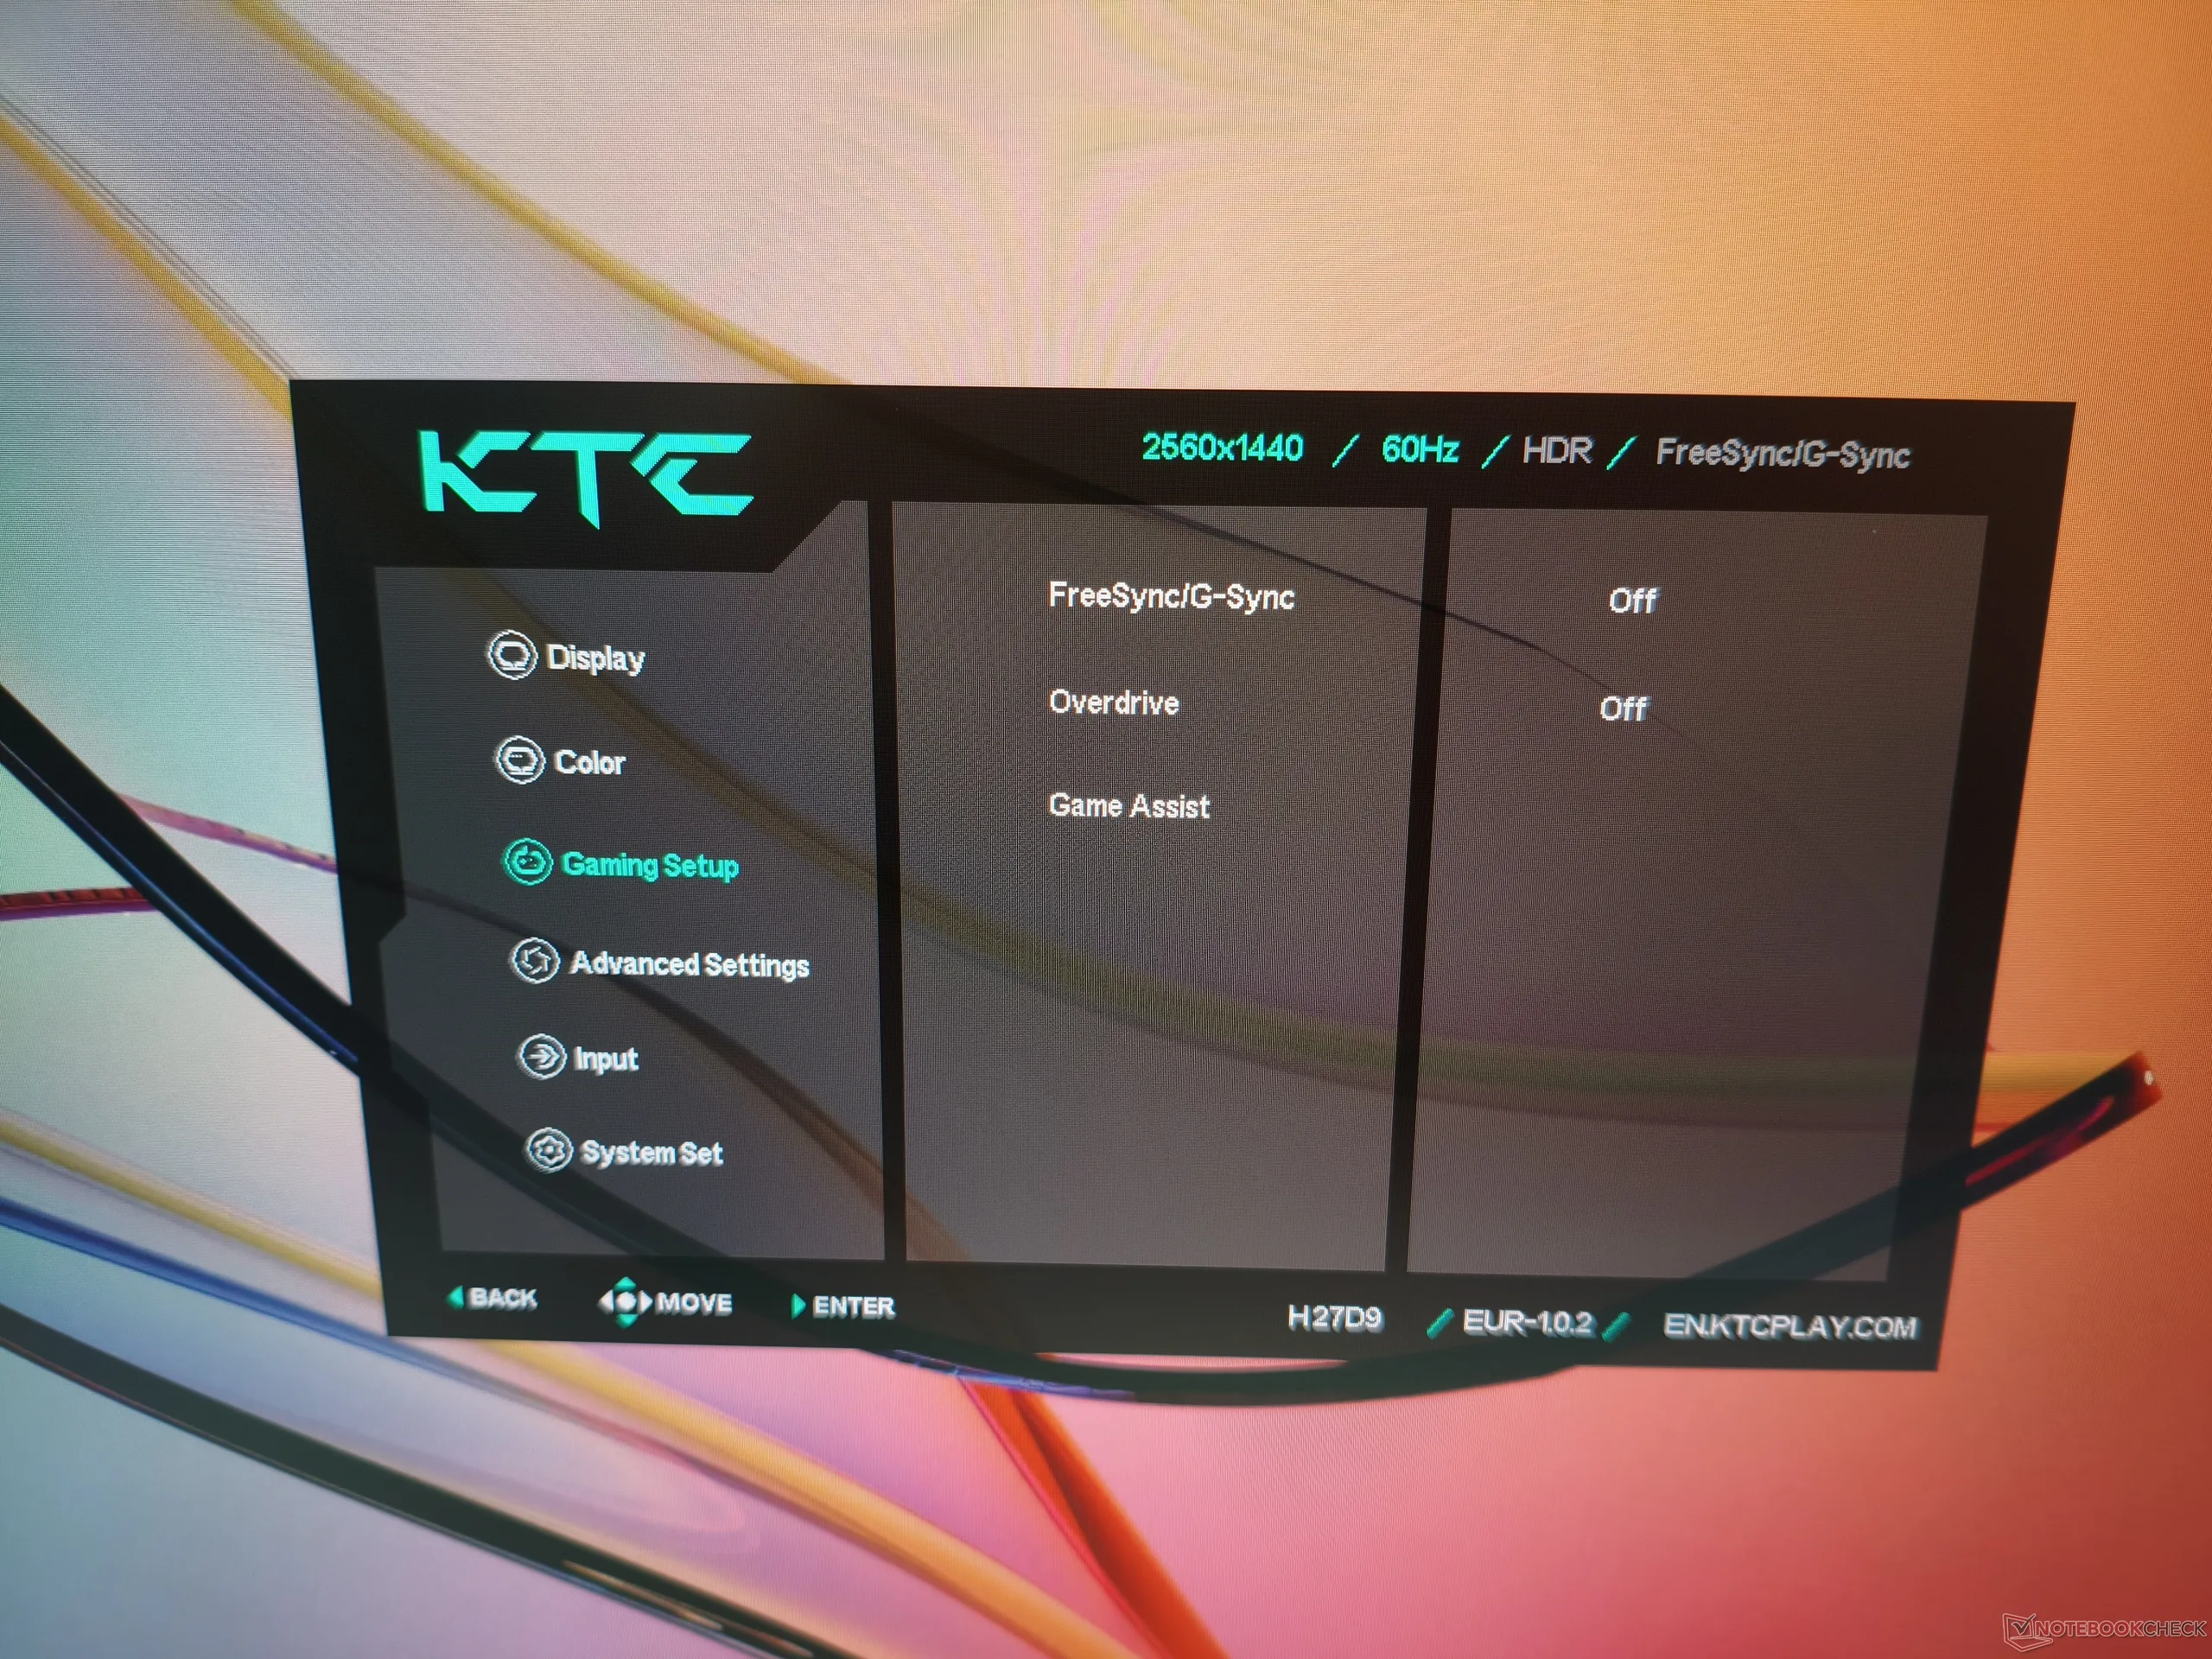
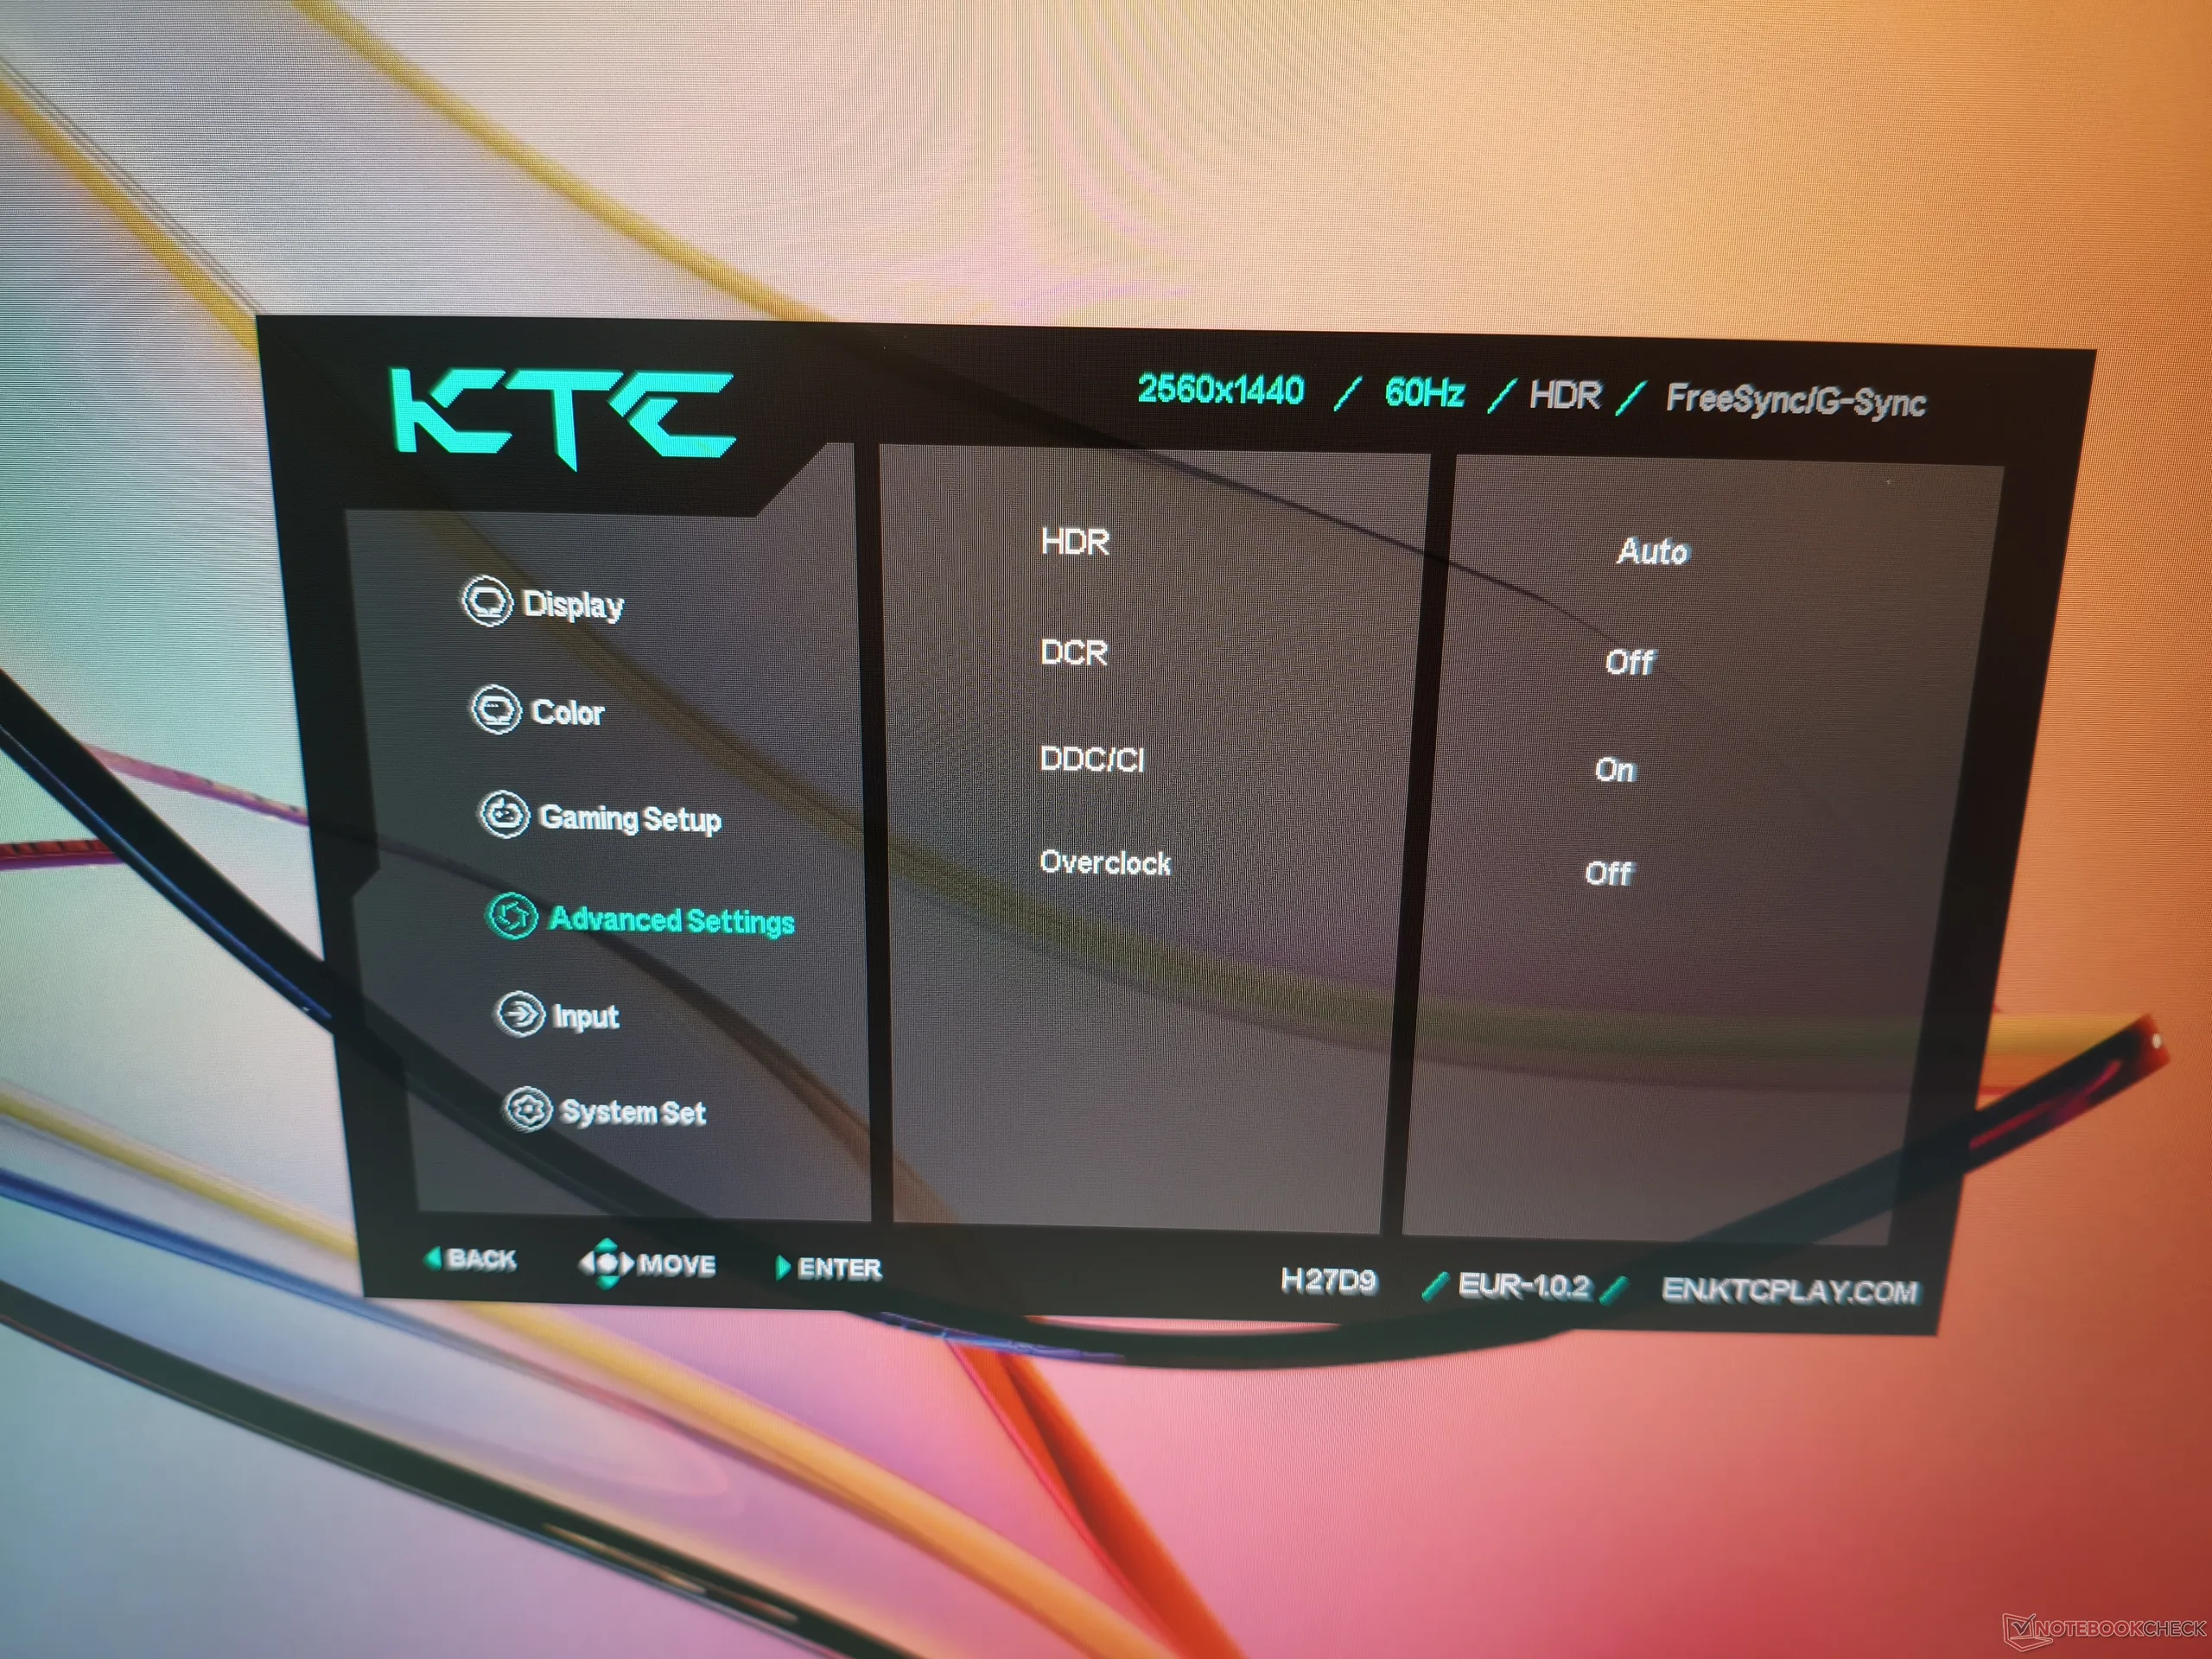
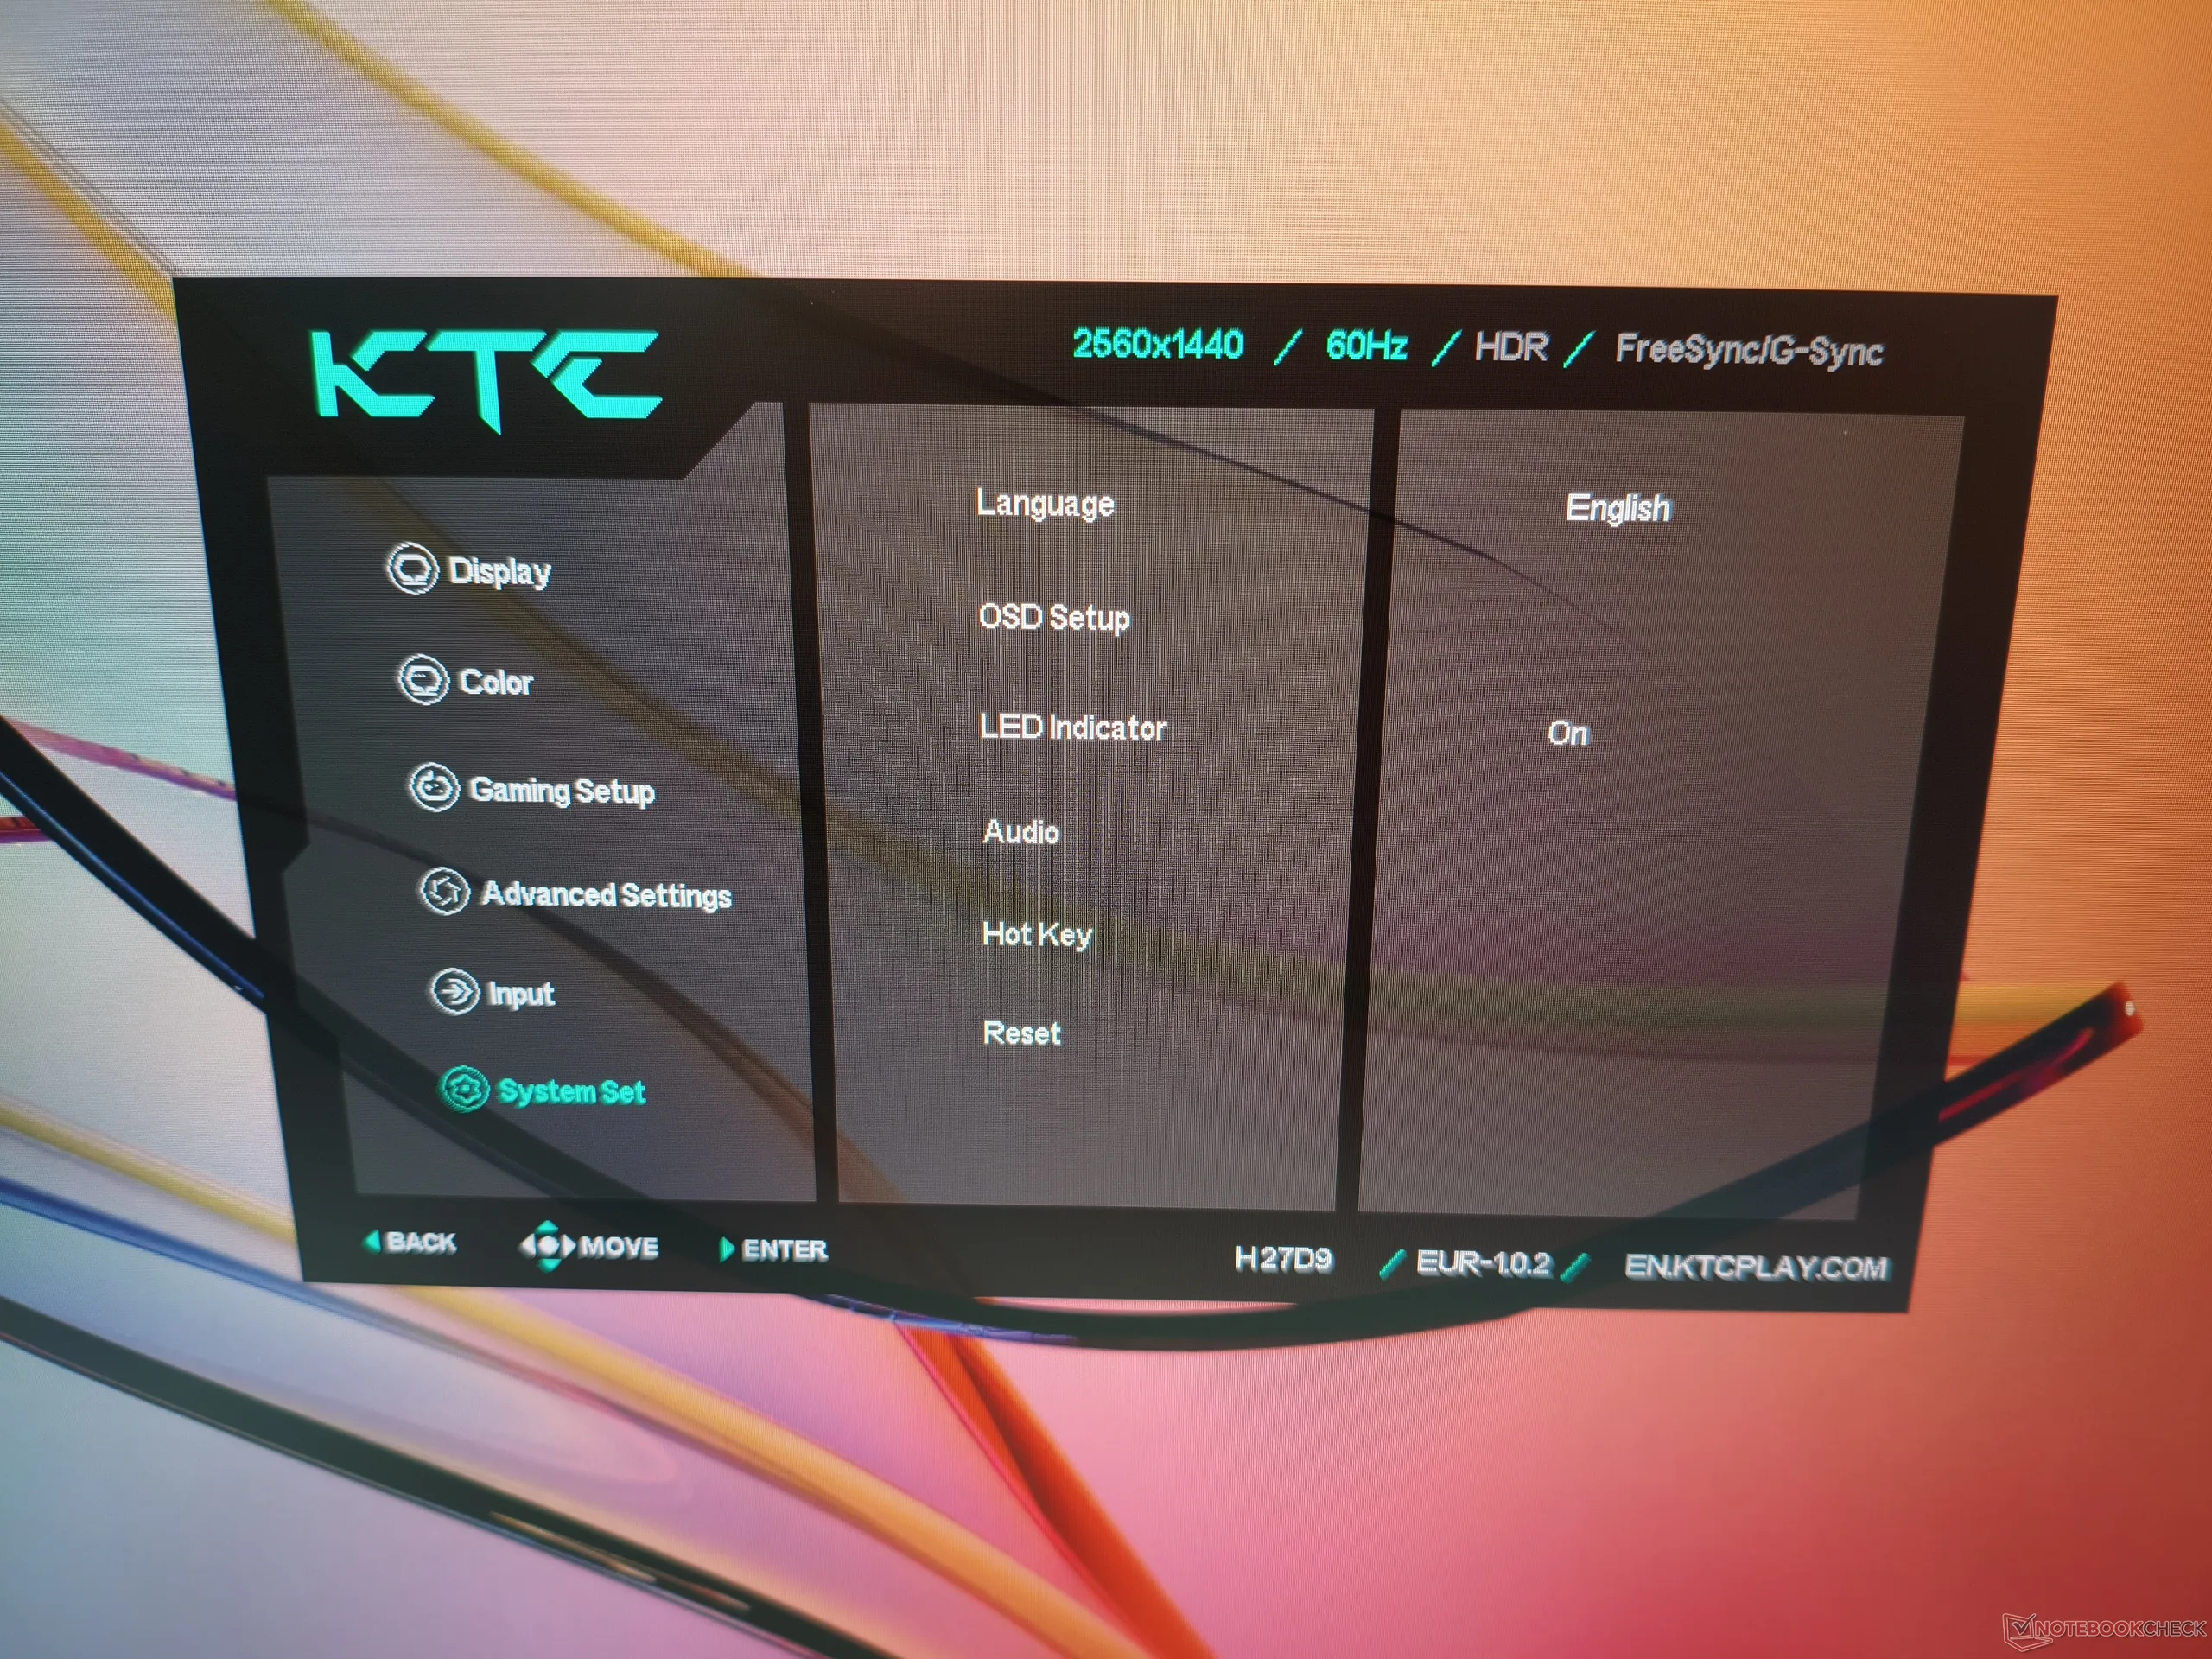
The OSD is controlled using a directional pad on the rear, similar to those found on many monitors. After a brief adjustment period, the clear, well-organized menus are easy to navigate. We took most of our measurements with the default settings, increasing only the brightness setting from 70 to 100 for testing. Results may vary depending on the selected mode.
Display
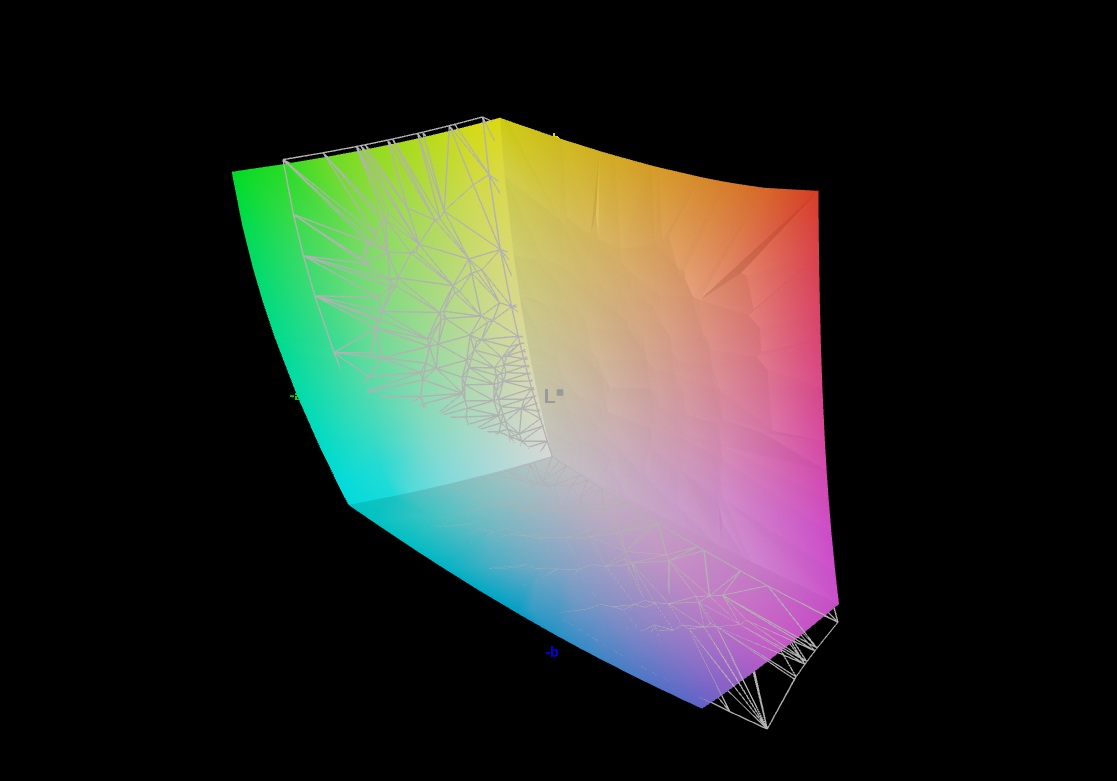
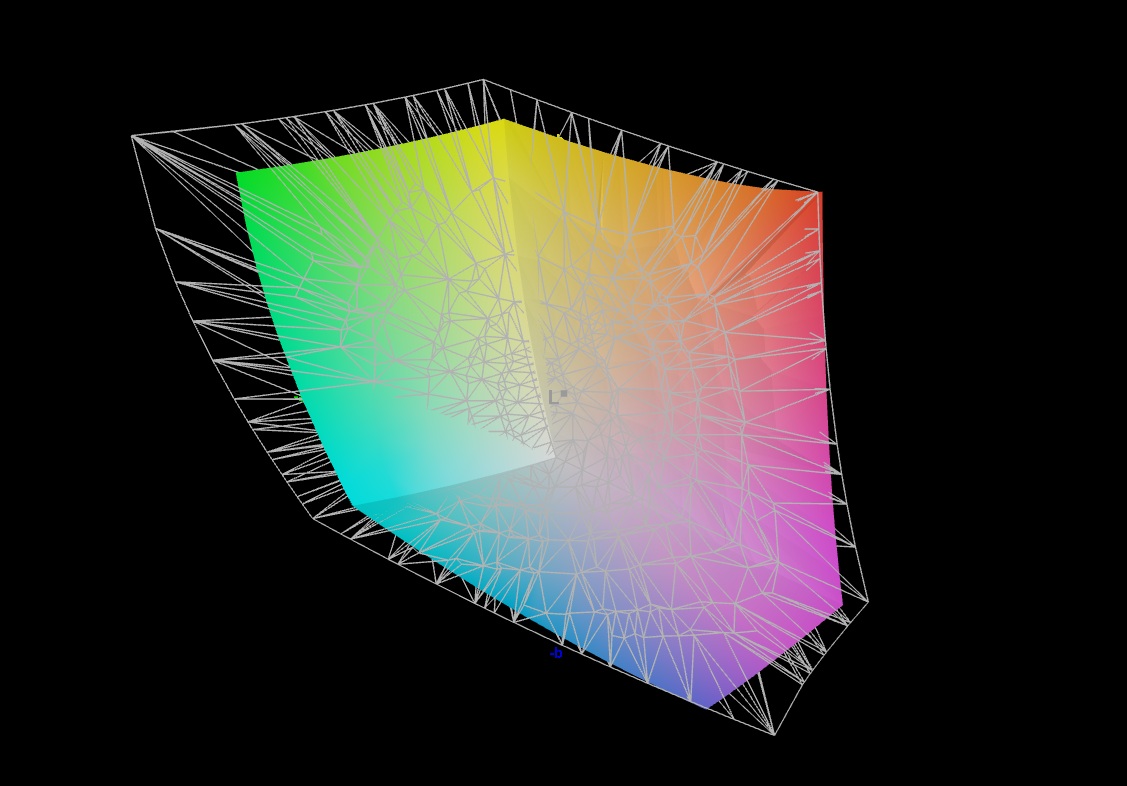
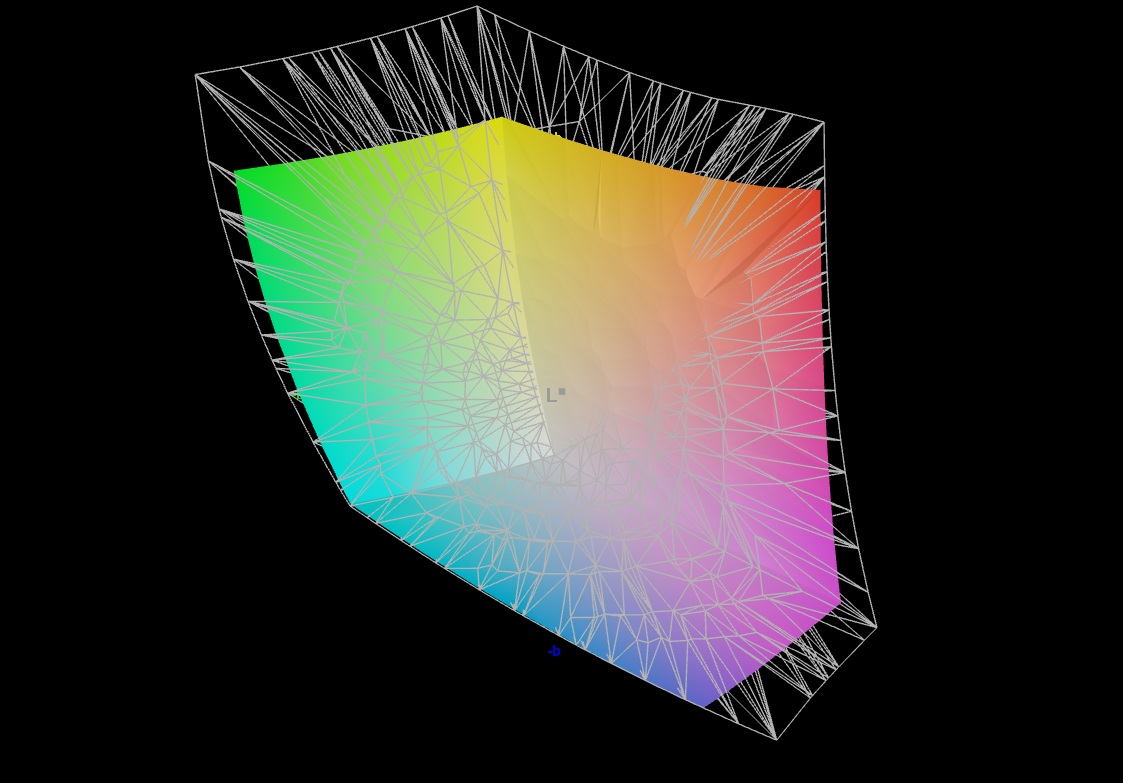
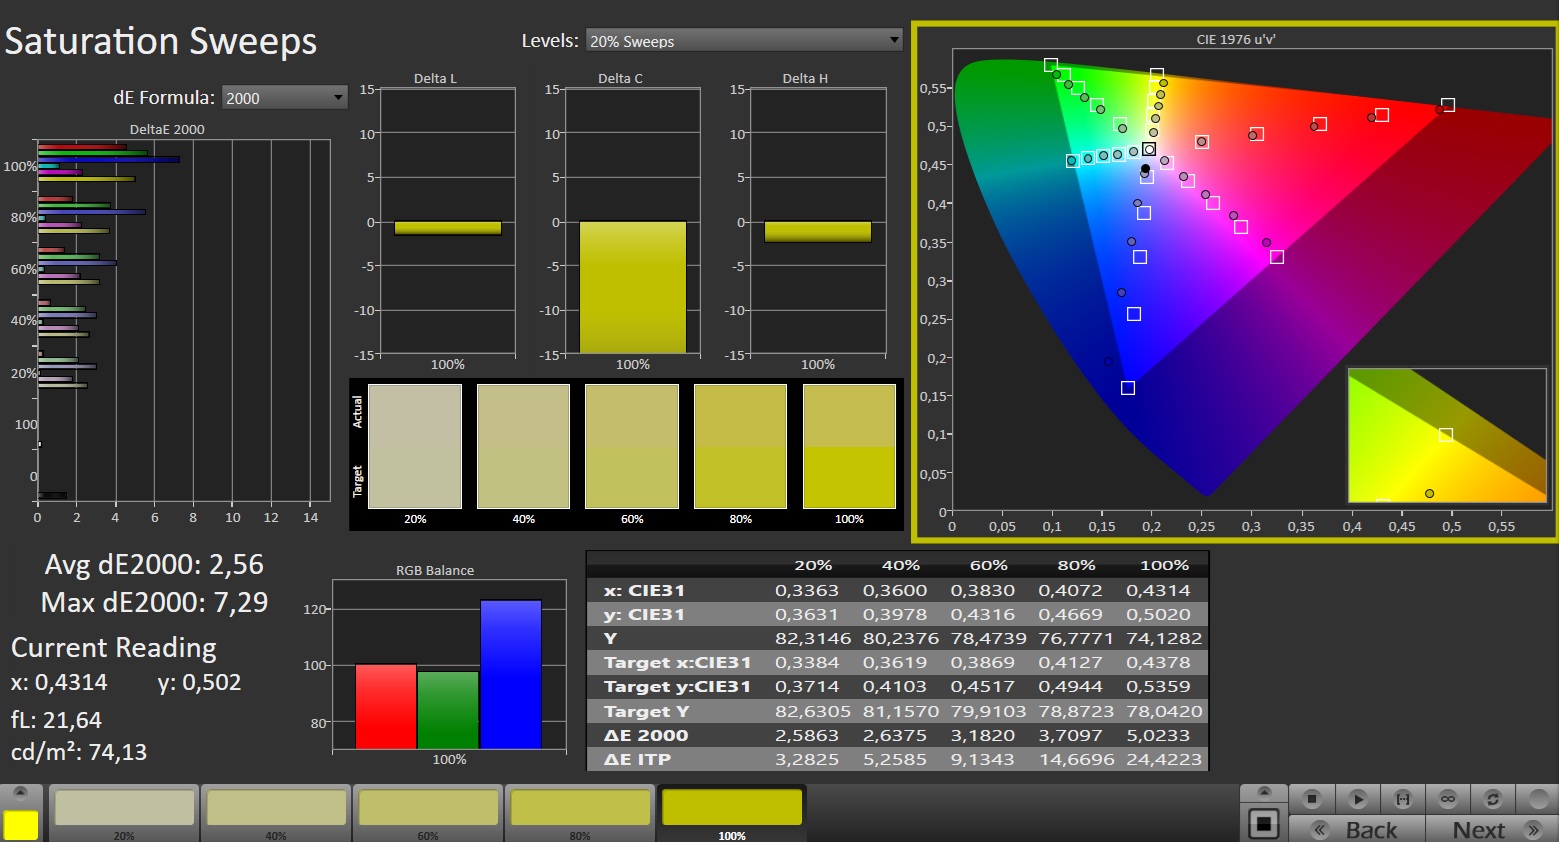
Although the color gamut falls somewhat short of KTC’s claims, at least with the default settings, most buyers will be satisfied with the results. Coverage of the sRGB color space is sufficient for gaming, for example. Average brightness is also lower than advertised at 226 cd/m², though this is adequate for most indoor environments. We measured a black level of 0.26 cd/m², typical for an IPS panel, resulting in a solid contrast ratio of around 950:1 in our testing (KTC claims up to 1,300:1).
| |||||||||||||||||||||||||
Brightness Distribution: 84 %
Contrast: 950:1 (Black: 0.26 cd/m²)
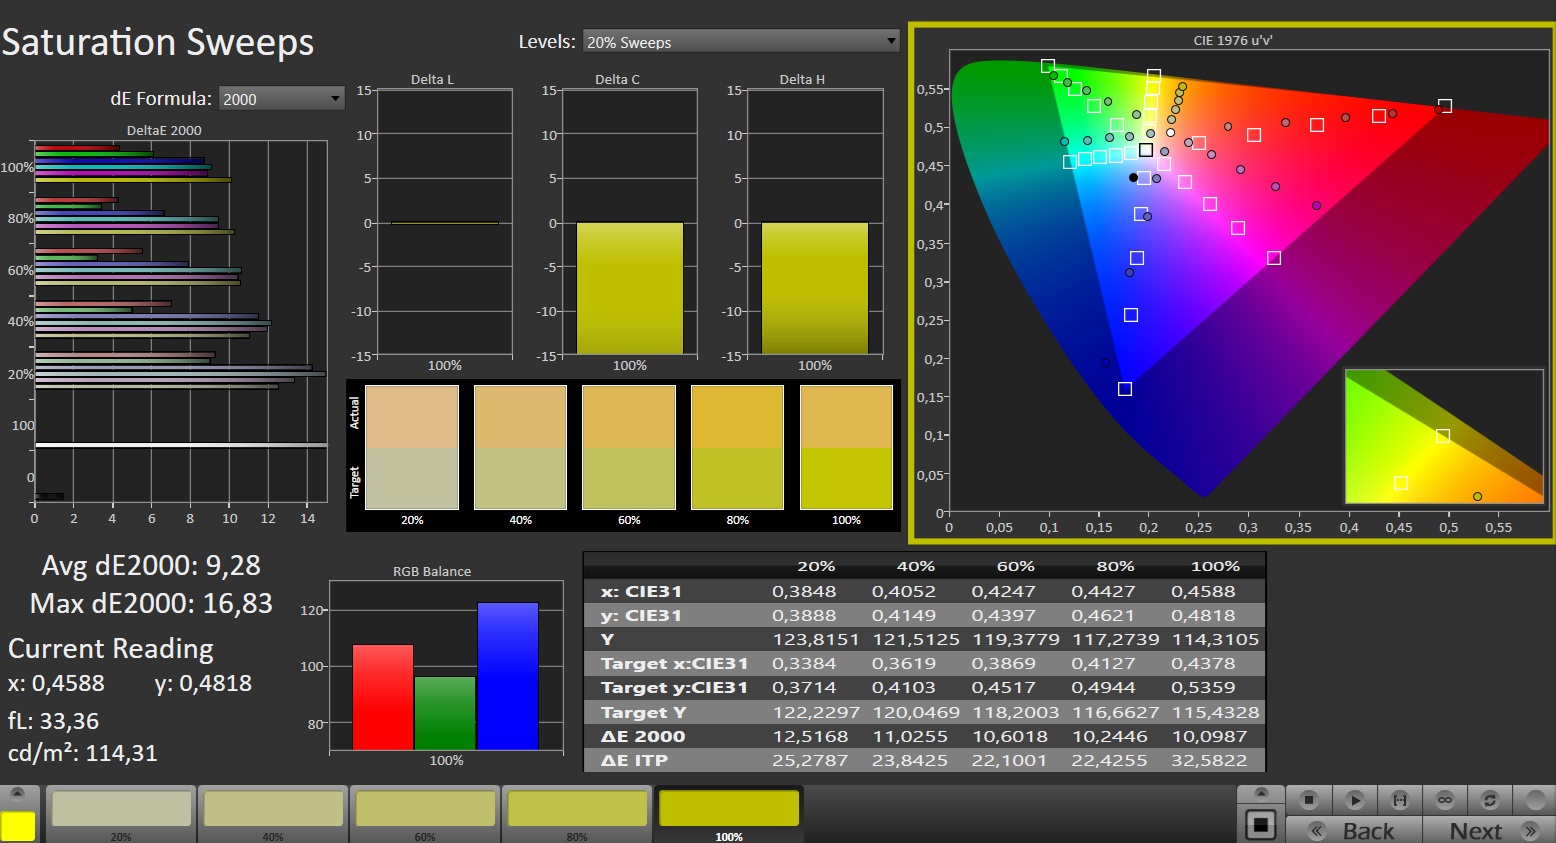
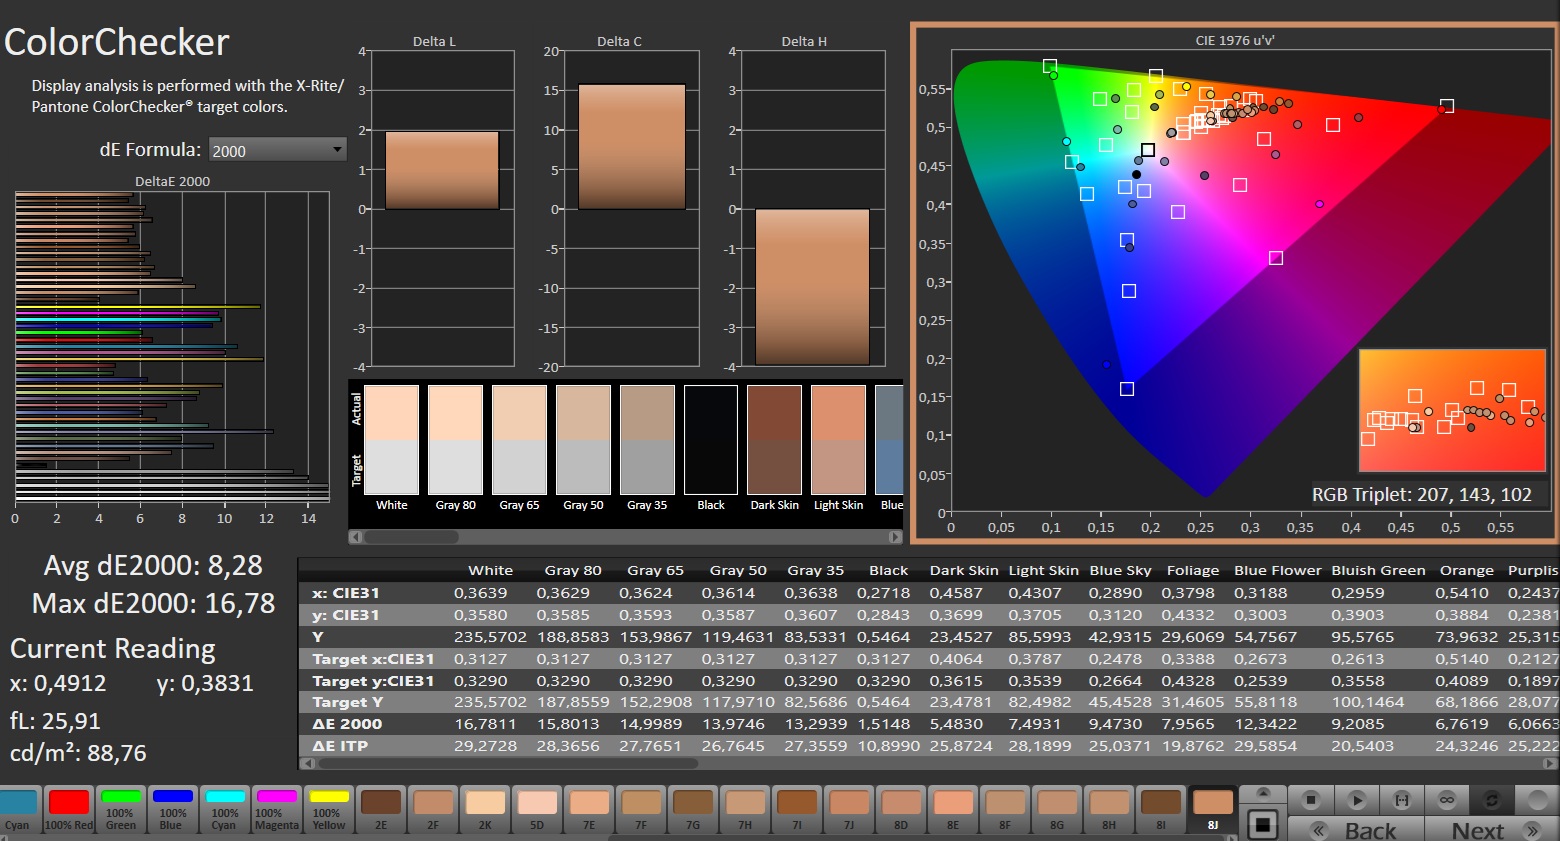
ΔE ColorChecker Calman: 8.28 | ∀{0.5-29.43 Ø4.68}
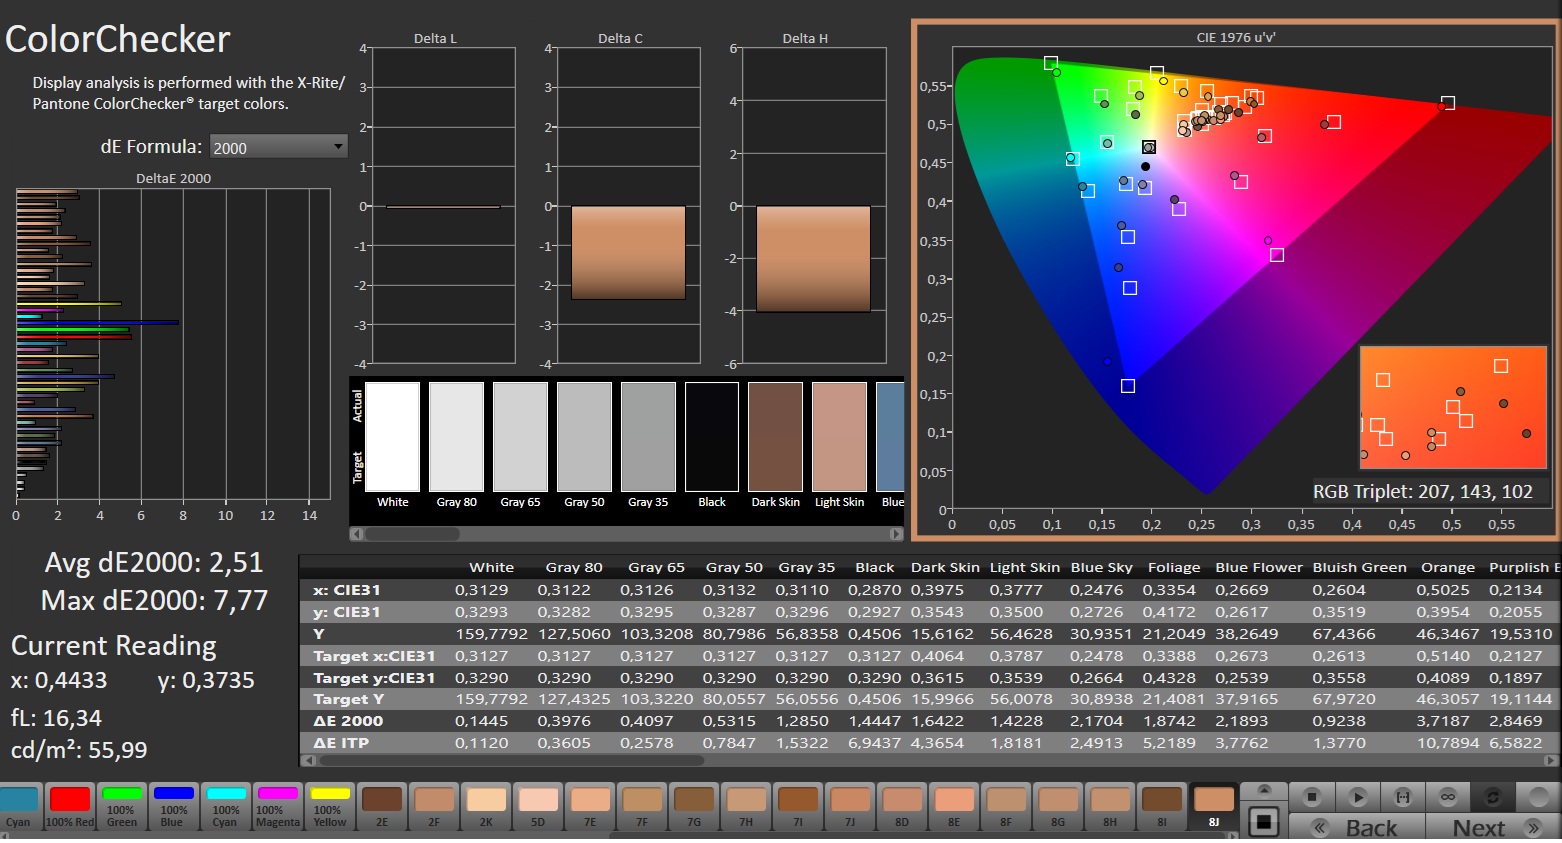
calibrated: 2.51
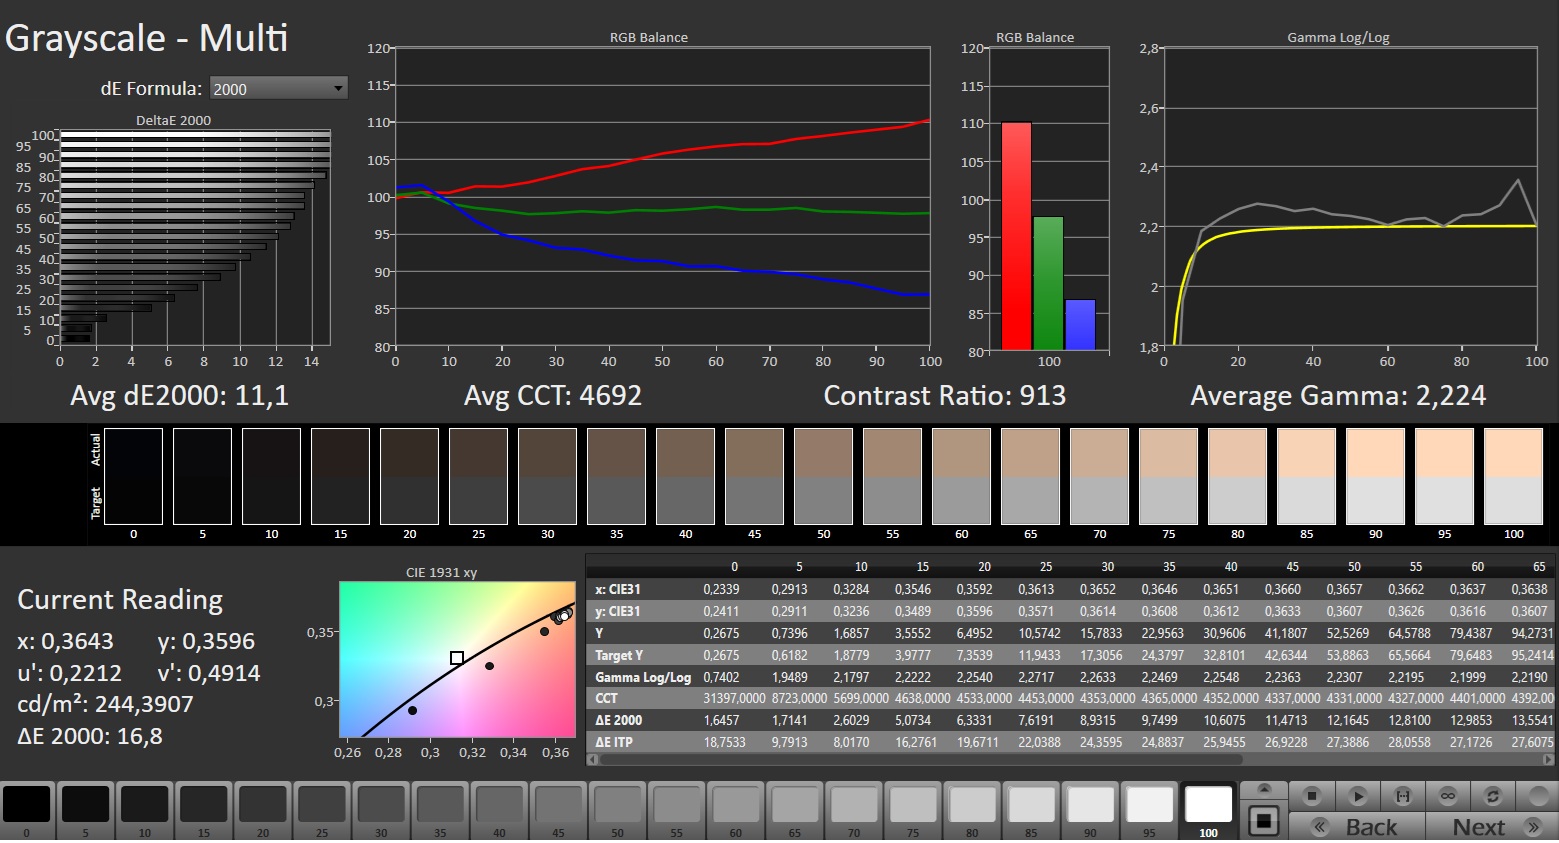
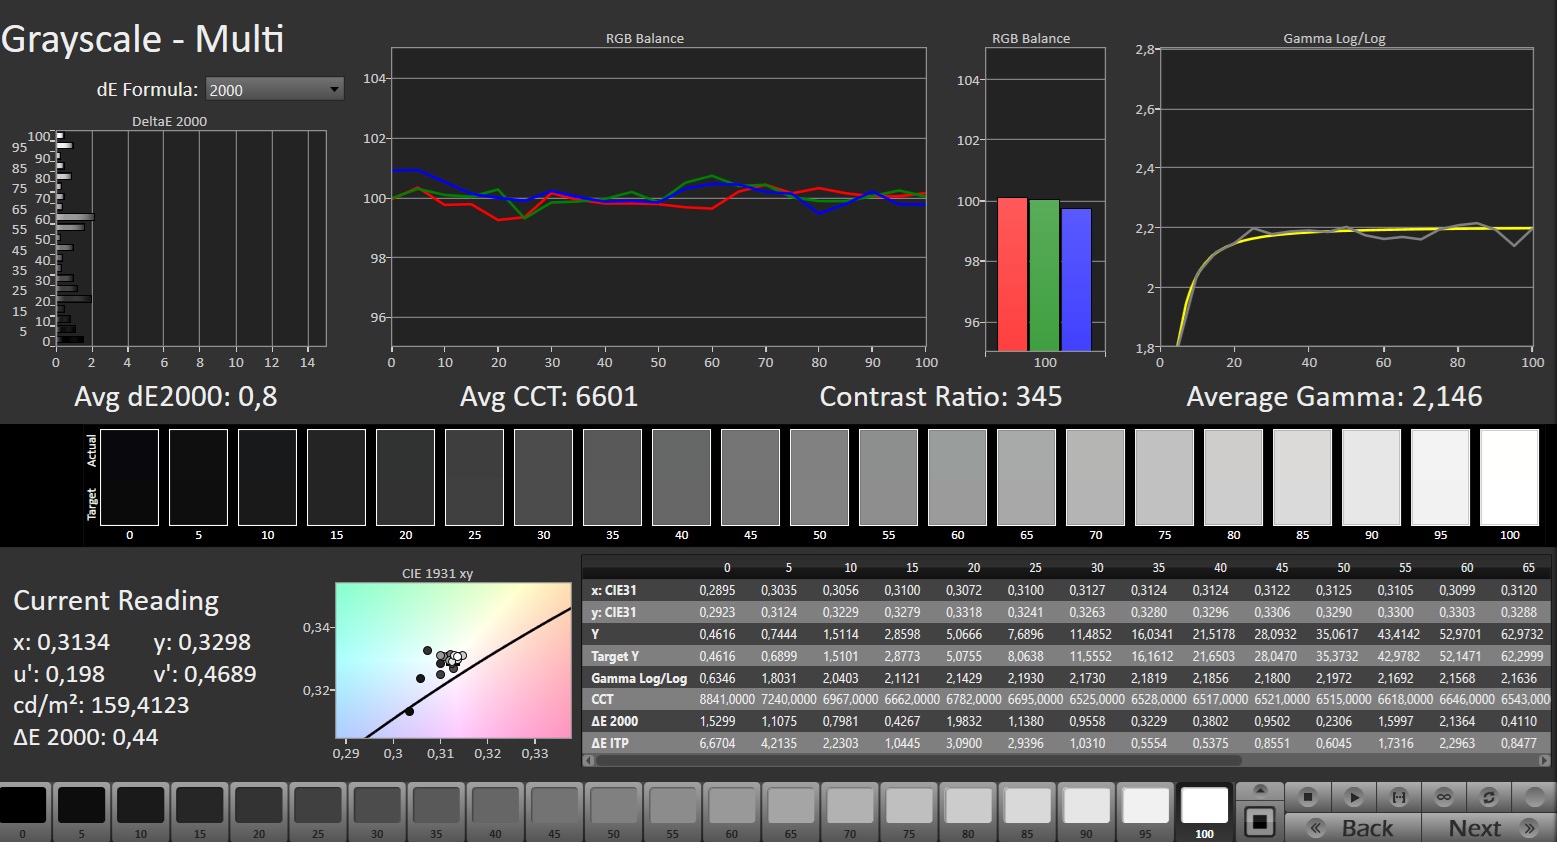
ΔE Greyscale Calman: 11.1 | ∀{0.09-98 Ø4.93}
78.5% AdobeRGB 1998 (Argyll 3D)
95.9% sRGB (Argyll 3D)
76.8% Display P3 (Argyll 3D)
Gamma: 2.224
CCT: 4692 K
| KTC H27D9 2560x1440, 27", 100 Hz | KTC H27E6S 2560x1440, 27", 240 Hz | |
|---|---|---|
| Display | -8% | |
| Display P3 Coverage (%) | 76.8 | 65.8 -14% |
| sRGB Coverage (%) | 95.9 | 97.4 2% |
| AdobeRGB 1998 Coverage (%) | 78.5 | 68 -13% |
| Response Times | 82% | |
| Response Time Grey 50% / Grey 80% * (ms) | 34 ? | 9.2 ? 73% 3.7 ? 89% |
| Response Time Black / White * (ms) | 23.9 ? | 4.2 ? 82% 4.2 ? 82% |
| PWM Frequency (Hz) | ||
| Screen | 51% | |
| Brightness middle (cd/m²) | 247 | 482 95% |
| Brightness (cd/m²) | 226 | 492 118% |
| Brightness Distribution (%) | 84 | 81 -4% |
| Black Level * (cd/m²) | 0.26 | 0.39 -50% |
| Contrast (:1) | 950 | 1236 30% |
| Colorchecker dE 2000 * | 8.28 | 2.2 73% |
| Colorchecker dE 2000 max. * | 16.78 | 5.7 66% |
| Colorchecker dE 2000 calibrated * | 2.51 | 0.9 64% |
| Greyscale dE 2000 * | 11.1 | 3.3 70% |
| Gamma | 2.224 99% | 2.23 99% |
| CCT | 4692 139% | 7105 91% |
| Total Average (Program / Settings) | 42% /
48% |
* ... smaller is better
Color accuracy is an area where the manufacturer could, and should, improve. Out of the box, the display has a pronounced yellow tint, but calibration corrects it, resulting in highly accurate colors (our ICC profile is linked next to the brightness distribution chart).
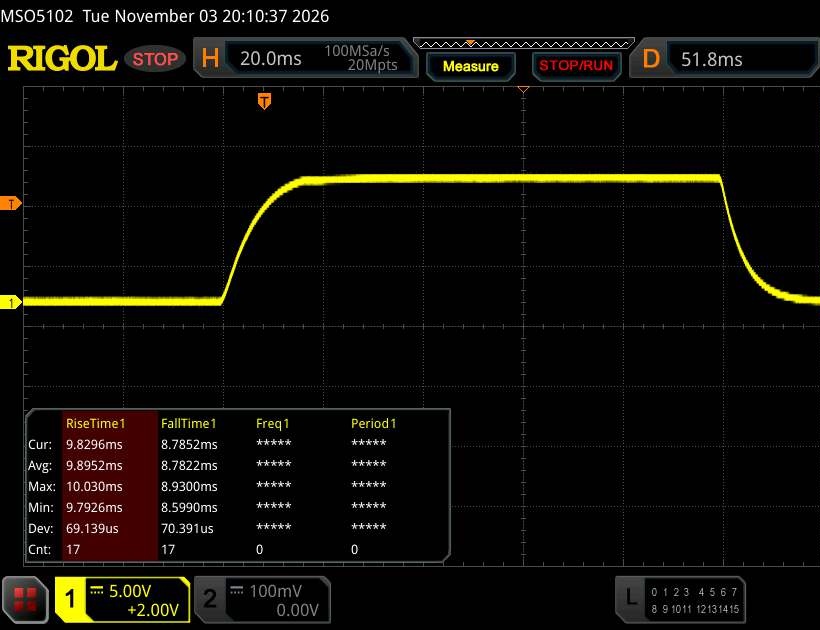
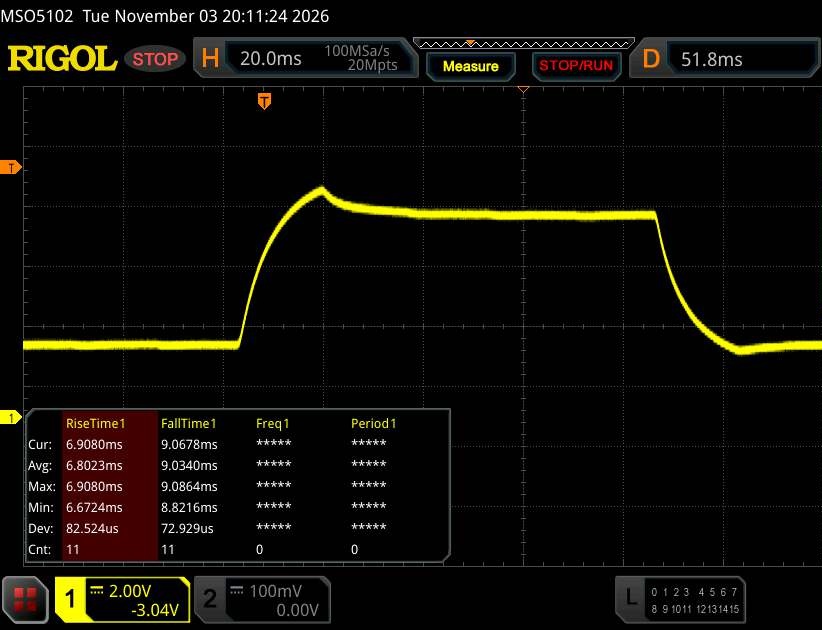
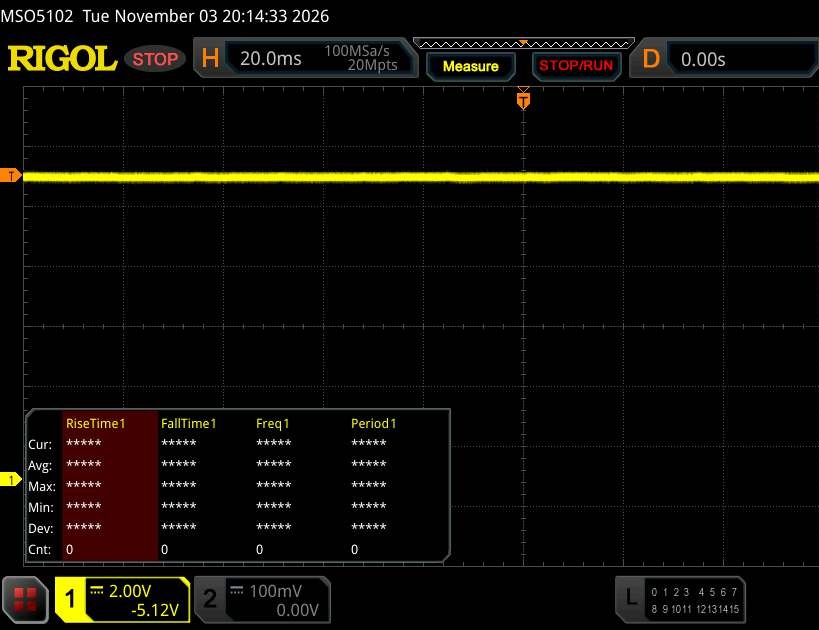
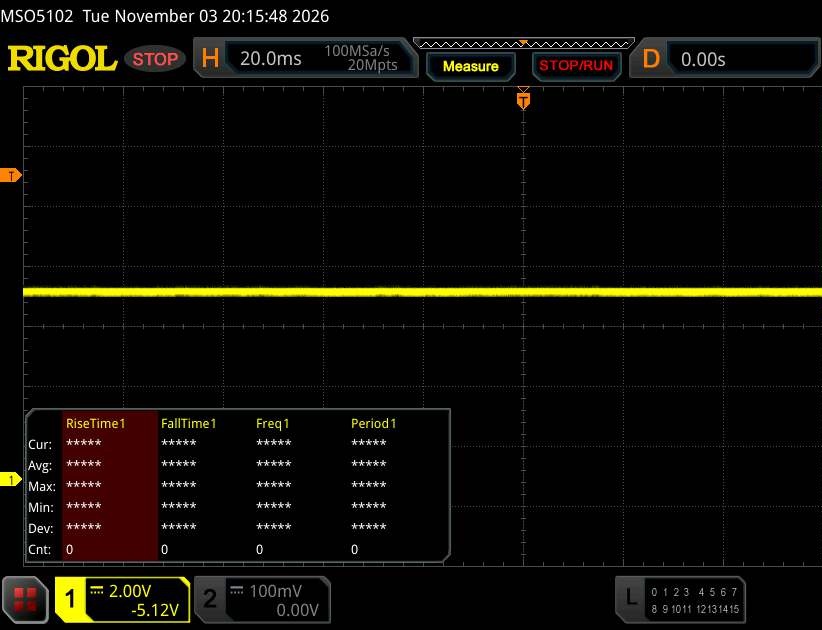
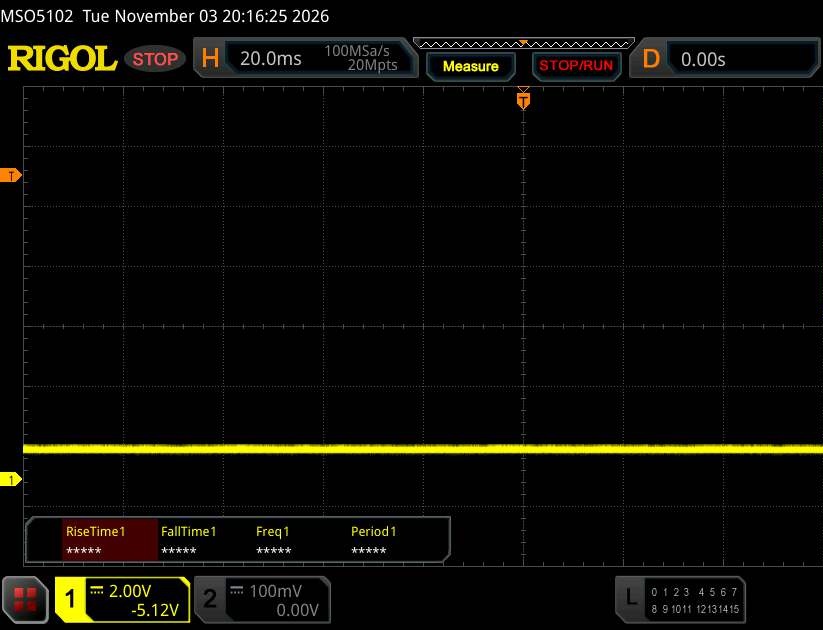
Response times leave something to be desired with overdrive disabled, as our screenshots show. Enabling overdrive yields a significant improvement in some cases, even at the Normal setting. Fortunately, we observed no PWM flicker or similar issues, so sensitive users should not experience any problems either.
Display Response Times
| ↔ Response Time Black to White | ||
|---|---|---|
| 23.9 ms ... rise ↗ and fall ↘ combined | ↗ 15 ms rise | 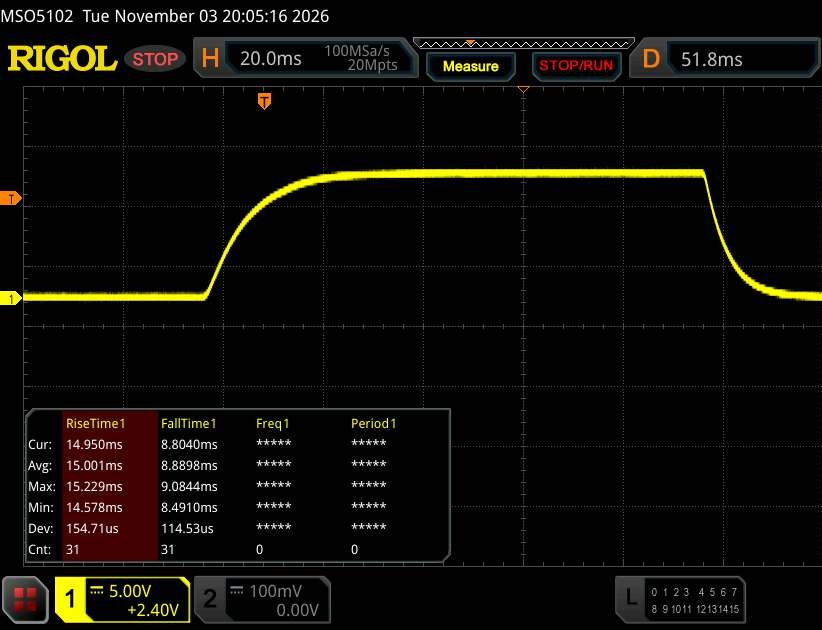 |
| ↘ 8.9 ms fall | ||
| The screen shows good response rates in our tests, but may be too slow for competitive gamers. In comparison, all tested devices range from 0.1 (minimum) to 240 (maximum) ms. » 55 % of all devices are better. This means that the measured response time is worse than the average of all tested devices (19.6 ms). | ||
| ↔ Response Time 50% Grey to 80% Grey | ||
| 34 ms ... rise ↗ and fall ↘ combined | ↗ 17.2 ms rise | 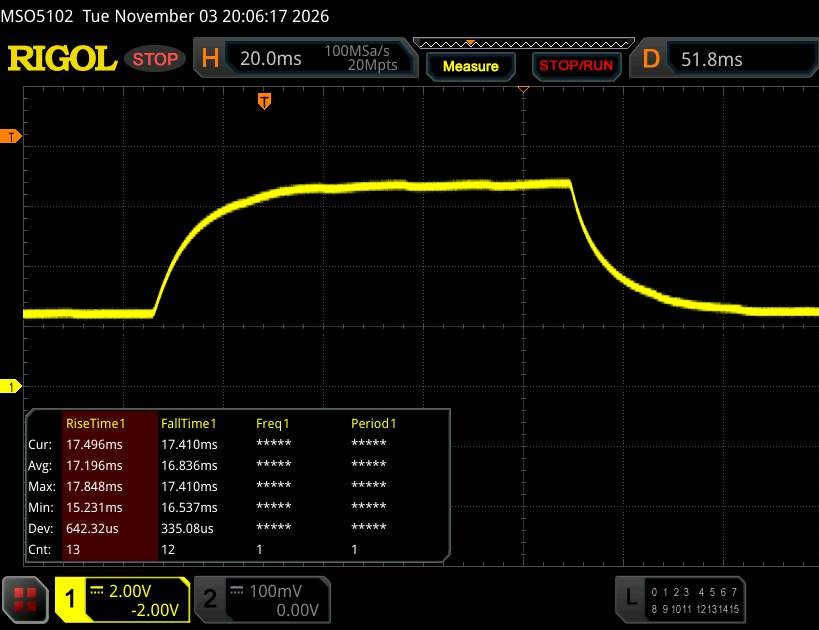 |
| ↘ 16.8 ms fall | ||
| The screen shows slow response rates in our tests and will be unsatisfactory for gamers. In comparison, all tested devices range from 0.13 (minimum) to 636 (maximum) ms. » 48 % of all devices are better. This means that the measured response time is worse than the average of all tested devices (30.6 ms). | ||
Screen Flickering / PWM (Pulse-Width Modulation)
| Screen flickering / PWM not detected | ||
In comparison: 52 % of all tested devices do not use PWM to dim the display. If PWM was detected, an average of 7544 (minimum: 5 - maximum: 343500) Hz was measured. | ||
Transparency
The selection of devices to be reviewed is made by our editorial team. The test sample was provided to the author as a loan by the manufacturer or retailer for the purpose of this review. The lender had no influence on this review, nor did the manufacturer receive a copy of this review before publication. There was no obligation to publish this review. As an independent media company, Notebookcheck is not subjected to the authority of manufacturers, retailers or publishers.
This is how Notebookcheck is testing
Every year, Notebookcheck independently reviews hundreds of laptops and smartphones using standardized procedures to ensure that all results are comparable. We have continuously developed our test methods for around 20 years and set industry standards in the process. In our test labs, high-quality measuring equipment is utilized by experienced technicians and editors. These tests involve a multi-stage validation process. Our complex rating system is based on hundreds of well-founded measurements and benchmarks, which maintains objectivity. Further information on our test methods can be found here.
 Add as a preferred source on Google


