Notebookcheck Logo

Apple M3 Pro 11-Core vs Intel Core i5-3470

Apple M3 Pro 11-Core

► remove from comparison Apple Apple M3 Pro 11-Core

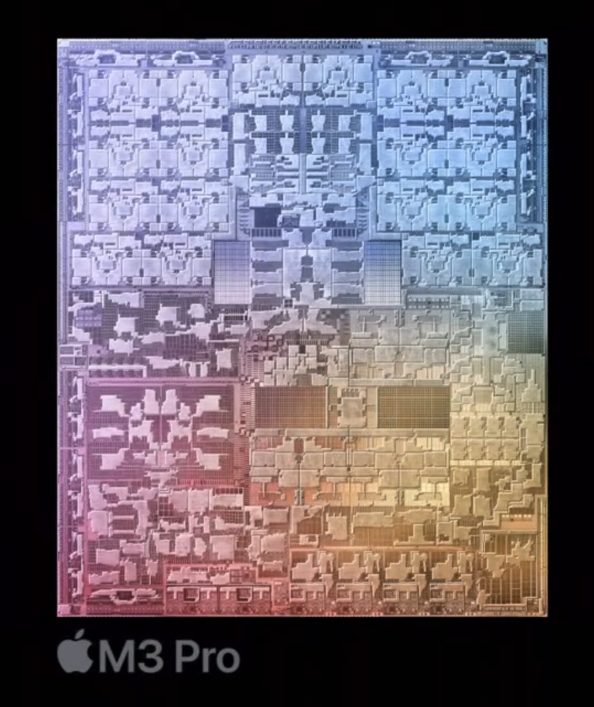
The Apple M3 Pro 11 Core is a system on a chip (SoC) from Apple for notebooks that was introduced late 2023. It integrates 11 of the 12 CPU cores with 5 of 6 performance cores with up to 4.06 GHz and 6 efficiency cores with 2.8 GHz.

Compared to the M2 Pro the M3 Pro has been slimmed down somewhat and swaps two performance cores for efficiency cores. This is due to the changed core configuration, as 6 cores are now used per cluster (the M2 Pro and M3 still have 4 cores per cluster). Furthermore, the memory bus has been reduced from 256 bits to 192 bits (150 GB/s vs. 200 GB/s). Thanks to the new architecture and higher clock rates, the new M3 Pro is still slightly faster.

The M3 Pro also integrates a new graphics card with dynamic caching, mesh shading and ray tracing acceleration via hardware. In the entry-level model, only 14 of the chip's 18 cores are used and support up to 3 displays simultaneously (internal and 2 external).

GPU and CPU can jointly access the shared memory on the package (unified memory). This is available in 18 or 36 GB variants and offers 150 GB/s maximum bandwidth (192 bit bus).

The integrated 16-core Neural Engine has also been revised and now offers 18 TOPS peak performance (compared to 15.8 TOPS in the M2 but 35 TOPS in the new A17 Pro). The video engine now also supports AV1 decoding in hardware. H.264, HEVC and ProRes (RAW) can still be decoded and encoded.

Unfortunately, the integrated WLAN only continues to support WiFi 6E (no WiFi 7), unlike the small M3 SoC thunderbolt 4 is also supported (max 40 Gbit/s).

The chip is manufactured in the current 3nm process (N3B) at TSMC and contains 37 billion transistors (-7.5% vs. Apple M2 Pro).

Intel Core i5-3470

► remove from comparison Intel 3470

The Intel Core i5-3470 is a fast LGA1155 quad-core desktop processor based on the Ivy Bridge architecture. Each core offers a base speed of 3.2 GHz, but can dynamically increase clock rates with Turbo Boost up to 3.4 GHz (for 4 active cores), 3.5 GHz (for 2 active cores) and 3.6 GHz (for 1 active core).

Ivy Bridge is an enhanced die shrink of the Sandy Bridge architecture with improvements on both GPU and CPU performance. The CPUs are produced in 22nm (versus 32nm Sandy Bridge CPUs) and the first to introduce 3D transistors for increased energy efficiency when compared to similarly clocked Sandy Bridge processors. Other new features are integrated PCI Express 3.0 and  DDR3(L)-1600 support.

The performance of the Core i5-3470 is slightly above a similarly clocked Sandy Bridge processor due to some architectural improvements. Compared to AMD's fastest desktop CPU (FX-8350), the Core i5-3470 offers higher performance per thread, but features less cores (4 instead of 8). Overall, the Core i5 is just slightly faster in most applications.

The integrated Intel HD Graphics 2500 GPU offers 6 Execution Units (EUs) clocked at 650 MHz up to 1100 MHz with Turbo Boost. The very low performance is only sufficient for some older and less demanding games.

The total power consumption of the CPU, graphics and memory controller is specified by Intel at 77 watts (TDP).

ModelApple M3 Pro 11-CoreIntel Core i5-3470
SeriesApple Apple M3Intel Core i5 (Desktop)
Series: Core i5 (Desktop) Ivy Bridge
Apple M3 Max 16-Core compare2.75 - 4.06 GHz16 / 16 cores
Apple M3 Max 14-Core compare2.75 - 4.06 GHz14 / 14 cores
Apple M3 Pro 12-Core compare2.75 - 4.06 GHz12 / 12 cores
Apple M3 Pro 11-Core « 2.75 - 4.06 GHz11 / 11 cores
Apple M3 compare2.75 - 4.06 GHz8 / 8 cores
Intel Core i5-3570K compare3.4 - 3.8 GHz4 / 4 cores6 MB L3
Intel Core i5-3550 compare3.3 - 3.7 GHz4 / 4 cores6 MB L3
Intel Core i5-3470 « 3.2 - 3.6 GHz4 / 4 cores6 MB L3
Clock2748 - 4056 MHz3200 - 3600 MHz
Cores / Threads11 / 11
5 x 4.1 GHz Apple M3 P-Core
6 x 2.7 GHz Apple M3 E-Core
4 / 4
TDP27 Watt77 Watt
Transistors37000 Million
Technology3 nm22 nm
FeaturesARMv8 Instruction SetHD Graphics 2500 (650-1100 MHz), SSE 4.1/4.2, AVX, Trusted Execution, AES, Dual Channel Memory Controller DDR3-1600 (max 32GB)
iGPUApple M3 Pro 14-Core GPUIntel HD Graphics 2500 (650 - 1100 MHz)
ArchitectureARMx86
Announced
Manufacturerwww.apple.comark.intel.com
CodenameIvy Bridge
L2 Cache1 MB
L3 Cache6 MB
max. Temp.67.4 °C
SocketFCLGA1155
$184 U.S.

Benchmarks

Cinebench 2024 - CB24 CPU Single Core
144 Points (100%)
Cinebench 2024 - CB24 CPU Multi Core
908 Points (17%)
Cinebench R23 - Cinebench R23 Multi Core
13315 Points (12%)
Cinebench R23 - Cinebench R23 Single Core
1942 Points (83%)
Cinebench R20 - Cinebench R20 CPU (Single Core)
502 Points (56%)
Cinebench R20 - Cinebench R20 CPU (Multi Core)
3529 Points (9%)
Cinebench R15 - Cinebench R15 CPU Multi 64 Bit
1913 Points (12%)
Cinebench R15 - Cinebench R15 CPU Single 64 Bit
281 Points (85%)
Cinebench R11.5 - Cinebench R11.5 CPU Multi 64 Bit
100%
1 3470 +
5.6 Points (7%)
Cinebench R11.5 - Cinebench R11.5 CPU Single 64 Bit
100%
1 3470 +
1.5 Points (38%)
Cinebench R10 - Cinebench R10 Rend. Single (32bit)
100%
1 3470 +
5006 Points (30%)
Cinebench R10 - Cinebench R10 Rend. Multi (32bit)
100%
1 3470 +
17192 Points (12%)
Cinebench R10 - Cinebench R10 Rend. Multi (64bit)
100%
1 3470 +
21594 Points (15%)
Cinebench R10 - Cinebench R10 Rend. Single (64bit)
100%
1 3470 +
6328 Points (8%)
Blender - Blender 3.3 Classroom CPU *
355 Seconds (5%)
Blender - Blender 2.79 BMW27 CPU *
365 Seconds (3%)
3DMark 06 - CPU - 3DMark 06 - CPU
100%
1 3470 +
6179 Points (13%)
3DMark Vantage - 3DM Vant. Perf. CPU no Physx
100%
1 3470 +
18204 Points (16%)
3DMark 11 - 3DM11 Performance Physics
100%
1 3470 +
5575 Points (15%)
3DMark - 3DMark Ice Storm Physics
100%
1 3470 +
54139 Points (44%)
3DMark - 3DMark Cloud Gate Physics
100%
1 3470 +
5051 Points (13%)
3DMark - 3DMark Fire Strike Standard Physics
100%
1 3470 +
5977 Points (11%)
Geekbench 6.2 - Geekbench 6.2 Single-Core
3113 Points (84%)
Geekbench 6.2 - Geekbench 6.2 Multi-Core
14412 Points (57%)
Geekbench 5.5 - Geekbench 5.1 - 5.4 64 Bit Single-Core
2331 Points (98%)
675 Points (28%)
Geekbench 5.5 - Geekbench 5.1 - 5.4 64 Bit Multi-Core
13312 Points (24%)
2095 Points (4%)
Geekbench 2 - 32 Bit - Geekbench Stream
100%
1 3470 +
9055 Points (73%)
Geekbench 2 - 32 Bit - Geekbench Memory
100%
1 3470 +
8088 Points (73%)
Geekbench 2 - 32 Bit - Geekbench Floating Point
100%
1 3470 +
10560 Points (21%)
Geekbench 2 - 32 Bit - Geekbench Integer
100%
1 3470 +
10006 Points (20%)
Geekbench 2 - 32 Bit - Geekbench Total Score
100%
1 3470 +
9721 Points (25%)
Mozilla Kraken 1.1 - Kraken 1.1 Total Score *
374.1 ms (0%)
Octane V2 - Octane V2 Total Score
98732 Points (89%)
WebXPRT 3 - WebXPRT 3 Score
431 Points (90%)
CrossMark - CrossMark Overall
1966 Points (75%)
Power Consumption - Cinebench R15 Multi Power Consumption - external Monitor *
40.1 Watt (7%)
Power Consumption - Idle Power Consumption - external Monitor *
2.1 Watt (1%)
Power Consumption - Idle Power Consumption 150cd 1min *
4.8 Watt (5%)
Power Consumption - Cinebench R15 Multi Power Efficiency - external Monitor
47.7 Points per Watt (36%)

Average Benchmarks Apple M3 Pro 11-Core → 100% n=2

Average Benchmarks Intel Core i5-3470 → 22% n=2

- Range of benchmark values for this graphics card
- Average benchmark values for this graphics card
* Smaller numbers mean a higher performance
1 This benchmark is not used for the average calculation

Add one or more devices and compare

In the following list you can select (and also search for) devices that should be added to the comparison. You can select more than one device.

restrict list:

show all (including archived), 2024, 2023
v1.27
log 16. 07:44:51

#0 checking url part for id 16354 +0s ... 0s

#1 checking url part for id 3764 +0s ... 0s

#2 not redirecting to Ajax server +0s ... 0s

#3 did not recreate cache, as it is less than 5 days old! Created at Sun, 16 Jun 2024 05:37:17 +0200 +0.001s ... 0.001s

#4 composed specs +0.025s ... 0.026s

#5 did output specs +0s ... 0.026s

#6 getting avg benchmarks for device 16354 +0.004s ... 0.03s

#7 got single benchmarks 16354 +0.012s ... 0.043s

#8 getting avg benchmarks for device 3764 +0.004s ... 0.047s

#9 got single benchmarks 3764 +0.013s ... 0.061s

#10 got avg benchmarks for devices +0s ... 0.061s

#11 min, max, avg, median took s +0.181s ... 0.242s

#12 return log +0.086s ... 0.328s

Please share our article, every link counts!
> Expert Reviews and News on Laptops, Smartphones and Tech Innovations > Benchmarks / Tech > Processor Comparison - Head 2 Head
Redaktion, 2017-09- 8 (Update: 2023-07- 1)