 Deutsch
 English
 Español
 Français
 Italiano
 Nederlands
 Polski
 Português
 Русский
 Türkçe
 Svenska
 Chinese
 Magyar
AMD A8-5600K vs AMD A4-5300 vs AMD A10-5800K
AMD A8-5600K
► remove from comparison
The AMD A8-5600K is a desktop APU based on the Trinity architecture. The chip is produced in a 32nm process and integrates 2 modules with 4 CPU cores clocked at 3.6 up to 3.9 GHz. Furthermore, the 5600K has a Radeon HD 7560D graphics unit and a DDR3-1866 memory controller. Due to the unlocked multiplier, the CPU can overclock very easily.
The CPU cores are based on a reworked Bulldozer architecture, called Piledriver. Although marketed as a quad-core processor, the A8-5600K includes only two modules with four integer-cores and two floating-point units in total. As a result, the CPU is not a true quad-core processor.
Depending on the benchmark, the CPU performance of the A8-5600K is slightly below the desktop Core i3-3220. The chip shows good performance on applications with high parallelization, whereas performance per thread is less impressive. For everyday tasks like office programs, multimedia applications or Internet surfing, the 5600K is suitable without restrictions; even demanding 3D games are possible if using dedicated graphics card.
The integrated DirectX 11-compatible Radeon HD 7560D offers only 256 shader cores (7660D: 384) and a clock rate of 760 MHz with no Turbo support. On average, the performance of the HD 7560D GPU is comparable to a dedicated notebook Radeon HD 6630M and somewhat faster than the HD Graphics 4000 as found on Intel’s Ivy Bridge platform.
The power consumption of the entire desktop APU is rated at 100 Watts.
AMD A4-5300
► remove from comparison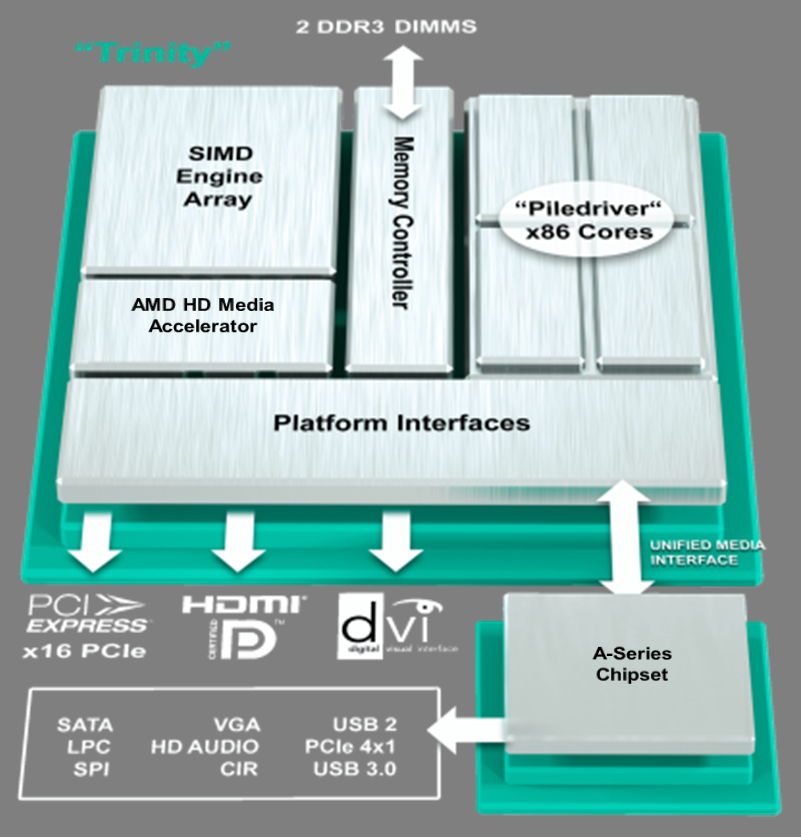
The AMD A4-5300 (not to be confused with the Ryzen 3 5300U from 2021) is a low-end desktop APU based on the Trinity architecture. The chip is produced on a 32 nm process and integrates 1 module with 2 CPU cores clocked at 3.4 GHz to 3.6 GHz. Furthermore, the 5300 has an integrated Radeon HD 7480D graphics unit and a DDR3-1600 dual-channel memory controller.
Architecture
The CPU core architecture is a redesegn of the Bulldozer architecture called Piledriver. Although marketed as a dual-core processor, the A4-5300 includes two integer cores but only one floating point unit in total. As a result, the CPU is not a true dual-core processor.
Performance
The average A4-5300 in our database is in the same league as the Intel Celeron N2940, as far as multi-thread benchmark scores are concerned, making the former a super-slow processor as of 2022.
Graphics
The integrated DirectX 11-compatible Radeon HD 7480D offers only 128 unified shaders (7660D: 384). The clock rate is 724 MHz with no Boost of any sort. On average, the performance of the HD 7480D GPU is somewhere between the HD Graphics 4000 and HD Graphics 2500 as found on Intel’s Ivy Bridge platform.
Power consumption
This A4 series chip consumes up to 65 W of power. This is in line with most other desktop CPUs, such as the Intel Core i5-6400.
AMD A10-5800K
► remove from comparison
The AMD A10-5800K is a desktop APU based on the Trinity architecture. The chip is produced in a 32nmprocess and integrates 2 modules with 4 CPU cores clocked at 3.8 to 4.2 GHz. Furthermore, the 5800K has a Radeon HD 7660D graphics unit and a DDR3-1866 memory controller. Due to the unlocked multiplier, the CPU can overclock very easily.
The CPU cores are based on a reworked Bulldozer architecture called Piledriver. Although marketed as a quad-core processor, the A10-5800K includes only two modules with four integer-cores and two floating-point units in total. As a result, the CPU is not a true quad-core processor.
Depending on the benchmark, the CPU performance of the A10-5800K is more or less similar to the desktop Core i3-3220. The chip shows good performance on applications with high parallelization, whereas performance per thread is less impressive. For everyday tasks like Office, multimedia applications or Internet surfing, the 5800K is suitable without restrictions; even demanding 3D games are possible if paired with a dedicated graphics card.
The integrated DirectX 11-compatible Radeon HD 7660D offers all 384 shader cores of the Trinity chip and a core clock of 800 MHz with no Turbo support. On average, the performance of the HD 7660D GPU is comparable to a dedicated Radeon HD 7670M notebook GPU and is noticeably faster than the HD Graphics 4000 as found on Intel’s Ivy Bridge platform.
The power consumption of the entire desktop APU is rated at 100 Watts.
| Model | AMD A8-5600K | AMD A4-5300 | AMD A10-5800K | ||||||||||||||||||||||||||||||||||||
| Series | AMD A-Series (Desktop) | AMD A-Series (Desktop) | AMD A-Series (Desktop) | ||||||||||||||||||||||||||||||||||||
| Codename | Trinity | Trinity | Trinity | ||||||||||||||||||||||||||||||||||||
| Series: A-Series (Desktop) Trinity |
|
|
| ||||||||||||||||||||||||||||||||||||
| Clock | 3600 - 3900 MHz | 3400 - 3600 MHz | 3800 - 4200 MHz | ||||||||||||||||||||||||||||||||||||
| L1 Cache | 192 KB | 160 KB | |||||||||||||||||||||||||||||||||||||
| L2 Cache | 4 MB | 1 MB | 4 MB | ||||||||||||||||||||||||||||||||||||
| Cores / Threads | 4 / 4 | 2 / 2 | 4 / 4 | ||||||||||||||||||||||||||||||||||||
| TDP | 100 Watt | 65 Watt | 100 Watt | ||||||||||||||||||||||||||||||||||||
| Transistors | 1303 Million | 1303 Million | |||||||||||||||||||||||||||||||||||||
| Technology | 32 nm | 32 nm | 32 nm | ||||||||||||||||||||||||||||||||||||
| Die Size | 246 mm2 | 246 mm2 | |||||||||||||||||||||||||||||||||||||
| Socket | FM2 | FM2 | |||||||||||||||||||||||||||||||||||||
| iGPU | AMD Radeon HD 7560D (760 MHz) | AMD Radeon HD 7480D (724 MHz) | AMD Radeon HD 7660D (800 MHz) | ||||||||||||||||||||||||||||||||||||
| Architecture | x86 | x86 | x86 | ||||||||||||||||||||||||||||||||||||
| Announced | |||||||||||||||||||||||||||||||||||||||
| Features | DDR3-1600 RAM, PCIe 2, MMX (+), SSE, SSE2, SSE3, SSSE3, SSE4.1, SSE4.2, SSE4A, AES, AVX, XOP, FMA3, FMA4 | ||||||||||||||||||||||||||||||||||||||
| Manufacturer | subscriptions.amd.com | ||||||||||||||||||||||||||||||||||||||
| $122 U.S. |
