Notebookcheck Logo

AMD A4-5300 vs AMD A10-5800K

AMD A4-5300

► remove from comparison AMD AMD A4-5300

The AMD A4-5300 (not to be confused with the Ryzen 3 5300U from 2021) is a low-end desktop APU based on the Trinity architecture. The chip is produced ​​on a 32 nm process and integrates 1 module with 2 CPU cores clocked at 3.4 GHz to 3.6 GHz. Furthermore, the 5300 has an integrated Radeon HD 7480D graphics unit and a DDR3-1600 dual-channel memory controller.

Architecture

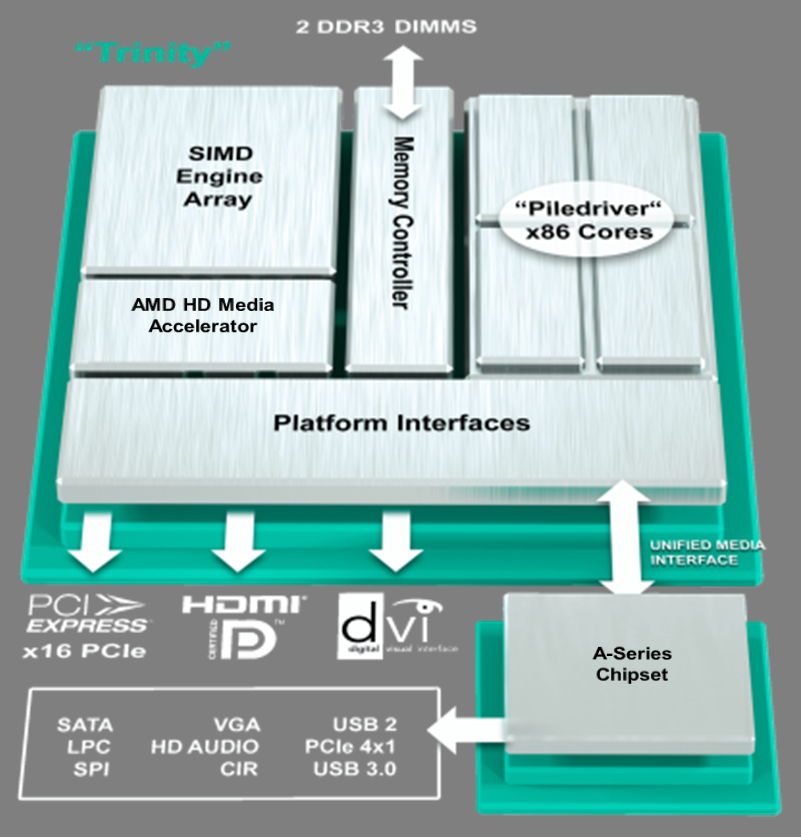
The CPU core architecture is a redesegn of the Bulldozer architecture called Piledriver. Although marketed as a dual-core processor, the A4-5300 includes two integer cores but only one floating point unit in total. As a result, the CPU is not a true dual-core processor.

Performance

The average A4-5300 in our database is in the same league as the Intel Celeron N2940, as far as multi-thread benchmark scores are concerned, making the former a super-slow processor as of 2022.

Graphics

The integrated DirectX 11-compatible Radeon HD 7480D offers only 128 unified shaders (7660D: 384). The clock rate is 724 MHz with no Boost of any sort. On average, the performance of the HD 7480D GPU is somewhere between the HD Graphics 4000 and HD Graphics 2500 as found on Intel’s Ivy Bridge platform.

Power consumption

This A4 series chip consumes up to 65 W of power. This is in line with most other desktop CPUs, such as the Intel Core i5-6400.

AMD A10-5800K

► remove from comparison AMD AMD A10-5800K

The AMD A10-5800K is a desktop APU based on the Trinity architecture. The chip is produced ​​in a 32nmprocess and integrates 2 modules with 4 CPU cores clocked at 3.8 to 4.2 GHz. Furthermore, the 5800K has a Radeon HD 7660D graphics unit and a DDR3-1866 memory controller. Due to the unlocked multiplier, the CPU can overclock very easily.

The CPU cores are based on a reworked Bulldozer architecture called Piledriver. Although marketed as a quad-core processor, the A10-5800K includes only two modules with four integer-cores and two floating-point units in total. As a result, the CPU is not a true quad-core processor.

Depending on the benchmark, the CPU performance of the A10-5800K is more or less similar to the desktop Core i3-3220. The chip shows good performance on applications with high parallelization, whereas performance per thread is less impressive. For everyday tasks like Office, multimedia applications or Internet surfing, the 5800K is suitable without restrictions; even demanding 3D games are possible if paired with a dedicated graphics card.

The integrated DirectX 11-compatible Radeon HD 7660D offers all 384 shader cores of the Trinity chip and a core clock of 800 MHz with no Turbo support. On average, the performance of the HD 7660D GPU is comparable to a dedicated Radeon HD 7670M notebook GPU and is noticeably faster than the HD Graphics 4000 as found on Intel’s Ivy Bridge platform.

The power consumption of the entire desktop APU is rated at 100 Watts.

ModelAMD A4-5300AMD A10-5800K
SeriesAMD A-Series (Desktop)AMD A-Series (Desktop)
CodenameTrinityTrinity
Series: A-Series (Desktop) Trinity
AMD A10-5800K3.8 - 4.2 GHz4 / 4 cores
AMD A8-5600K compare3.6 - 3.9 GHz4 / 4 cores
AMD A4-5300 « 3.4 - 3.6 GHz2 / 2 cores
AMD A10-5800K « 3.8 - 4.2 GHz4 / 4 cores
AMD A8-5600K compare3.6 - 3.9 GHz4 / 4 cores
AMD A4-53003.4 - 3.6 GHz2 / 2 cores
Clock3400 - 3600 MHz3800 - 4200 MHz
L1 Cache160 KB
L2 Cache1 MB4 MB
Cores / Threads2 / 24 / 4
TDP65 Watt100 Watt
Technology32 nm32 nm
SocketFM2
FeaturesDDR3-1600 RAM, PCIe 2, MMX (+), SSE, SSE2, SSE3, SSSE3, SSE4.1, SSE4.2, SSE4A, AES, AVX, XOP, FMA3, FMA4
iGPUAMD Radeon HD 7480D (724 MHz)AMD Radeon HD 7660D (800 MHz)
Architecturex86x86
Announced
Manufacturersubscriptions.amd.com
Transistors1303 Million
Die Size246 mm2
$122 U.S.

Benchmarks

Cinebench R15 - Cinebench R15 CPU Multi 64 Bit
107 Points (1%)
Cinebench R15 - Cinebench R15 CPU Single 64 Bit
67 Points (20%)
Cinebench R11.5 - Cinebench R11.5 CPU Multi 64 Bit
1.5 Points (2%)
min: 3.3     avg: 3.3     median: 3.3 (4%)     max: 3.33 Points
Cinebench R11.5 - Cinebench R11.5 CPU Single 64 Bit
0.9 Points (23%)
min: 1.02     avg: 1     median: 1 (26%)     max: 1.04 Points
Cinebench R10 - Cinebench R10 Rend. Single (32bit)
2734 Points (17%)
min: 3056     avg: 3094     median: 3093.5 (19%)     max: 3131 Points
Cinebench R10 - Cinebench R10 Rend. Multi (32bit)
4345 Points (3%)
min: 9266     avg: 9276     median: 9275.5 (7%)     max: 9285 Points
Cinebench R10 - Cinebench R10 Rend. Multi (64bit)
5867 Points (4%)
min: 12959     avg: 12973     median: 12973 (9%)     max: 12987 Points
Cinebench R10 - Cinebench R10 Rend. Single (64bit)
3645 Points (4%)
min: 4139     avg: 4180     median: 4180 (5%)     max: 4221 Points
wPrime 2.10 - wPrime 2.0 1024m *
1126 s (13%)
min: 501     avg: 502     median: 502 (6%)     max: 503 s
wPrime 2.10 - wPrime 2.0 32m *
35.5 s (7%)
15.9 s (3%)
WinRAR - WinRAR 4.0
1347 Points (2%)
min: 2472     avg: 2501     median: 2501 (4%)     max: 2530 Points
X264 HD Benchmark 4.0 - x264 Pass 2
9.6 fps (3%)
min: 21.8     avg: 21.9     median: 21.9 (8%)     max: 21.9 fps
X264 HD Benchmark 4.0 - x264 Pass 1
50 fps (12%)
min: 105.6     avg: 106.6     median: 106.6 (25%)     max: 107.6 fps
TrueCrypt - TrueCrypt Serpent
0.1 GB/s (0%)
min: 0.208     avg: 0.2     median: 0.2 (0%)     max: 0.209 GB/s
TrueCrypt - TrueCrypt Twofish
0.2 GB/s (3%)
min: 0.379     avg: 0.4     median: 0.4 (7%)     max: 0.38 GB/s
TrueCrypt - TrueCrypt AES
0.8 GB/s (2%)
1.9 GB/s (5%)
3DMark 06 - CPU - 3DMark 06 - CPU
2284 Points (5%)
min: 4311     avg: 4437     median: 4464 (10%)     max: 4536 Points
Super Pi mod 1.5 XS 1M - Super Pi mod 1.5 XS 1M *
27.5 s (6%)
min: 23.9     avg: 24.2     median: 24.2 (5%)     max: 24.5 s
Super Pi mod 1.5 XS 2M - Super Pi mod 1.5 XS 2M *
61.2 s (3%)
min: 54.5     avg: 55.1     median: 55.1 (2%)     max: 55.7 s
Super Pi Mod 1.5 XS 32M - Super Pi mod 1.5 XS 32M *
1566 s (7%)
min: 1430     avg: 1439     median: 1438.5 (6%)     max: 1447 s
SiSoft Sandra Dhrystone (MIPS) - SiSoft Sandra Dhrystone (MIPS)
22520 MIPS (11%)
SiSoft Sandra Whetstone (MFLOPS) - SiSoft Sandra Whetstone (MFLOPS)
15270 MFLOPS (12%)
3DMark Vantage - 3DM Vant. Perf. CPU no Physx
4567 Points (4%)
min: 9592     avg: 10038     median: 10037.5 (9%)     max: 10483 Points
3DMark 11 - 3DM11 Performance Physics
1924 Points (5%)
min: 3823     avg: 3925     median: 3904 (11%)     max: 4049 Points
3DMark - 3DMark Ice Storm Physics
17639 Points (14%)
min: 34097     avg: 36209     median: 36835 (30%)     max: 37694 Points
3DMark - 3DMark Cloud Gate Physics
1433 Points (4%)
min: 2959     avg: 3009     median: 3009 (8%)     max: 3059 Points
3DMark - 3DMark Fire Strike Standard Physics
1959 Points (3%)
min: 4242     avg: 4324     median: 4324 (8%)     max: 4406 Points
Geekbench 2 - 32 Bit - Geekbench Stream
4373 Points (35%)
min: 4648     avg: 4650     median: 4650 (38%)     max: 4652 Points
Geekbench 2 - 32 Bit - Geekbench Memory
3941 Points (36%)
min: 4313     avg: 4319     median: 4318.5 (39%)     max: 4324 Points
Geekbench 2 - 32 Bit - Geekbench Floating Point
4937 Points (10%)
min: 9161     avg: 9183     median: 9182.5 (18%)     max: 9204 Points
Geekbench 2 - 32 Bit - Geekbench Integer
3758 Points (8%)
min: 6890     avg: 6900     median: 6900 (14%)     max: 6910 Points
Geekbench 2 - 32 Bit - Geekbench Total Score
4268 Points (11%)
min: 6945     avg: 6957     median: 6957 (18%)     max: 6969 Points

Average Benchmarks AMD A4-5300 → 100% n=30

Average Benchmarks AMD A10-5800K → 177% n=30

- Range of benchmark values for this graphics card
- Average benchmark values for this graphics card
* Smaller numbers mean a higher performance
1 This benchmark is not used for the average calculation

Add one or more devices and compare

In the following list you can select (and also search for) devices that should be added to the comparison. You can select more than one device.

restrict list:

show all (including archived), 2024, 2023
v1.26
log 18. 02:51:57

#0 checking url part for id 3790 +0s ... 0s

#1 checking url part for id 3788 +0s ... 0s

#2 not redirecting to Ajax server +0s ... 0s

#3 did not recreate cache, as it is less than 5 days old! Created at Tue, 16 Apr 2024 05:37:29 +0200 +0.001s ... 0.001s

#4 composed specs +0.043s ... 0.044s

#5 did output specs +0s ... 0.044s

#6 getting avg benchmarks for device 3790 +0.003s ... 0.047s

#7 got single benchmarks 3790 +0.012s ... 0.059s

#8 getting avg benchmarks for device 3788 +0.003s ... 0.062s

#9 got single benchmarks 3788 +0.011s ... 0.073s

#10 got avg benchmarks for devices +0s ... 0.073s

#11 min, max, avg, median took s +0.201s ... 0.274s

#12 return log +0.025s ... 0.299s

Please share our article, every link counts!
> Expert Reviews and News on Laptops, Smartphones and Tech Innovations > Benchmarks / Tech > Processor Comparison - Head 2 Head
Redaktion, 2017-09- 8 (Update: 2023-07- 1)