Notebookcheck Logo

Apple A8 vs Apple M3

Apple A8

► remove from comparison Apple A8

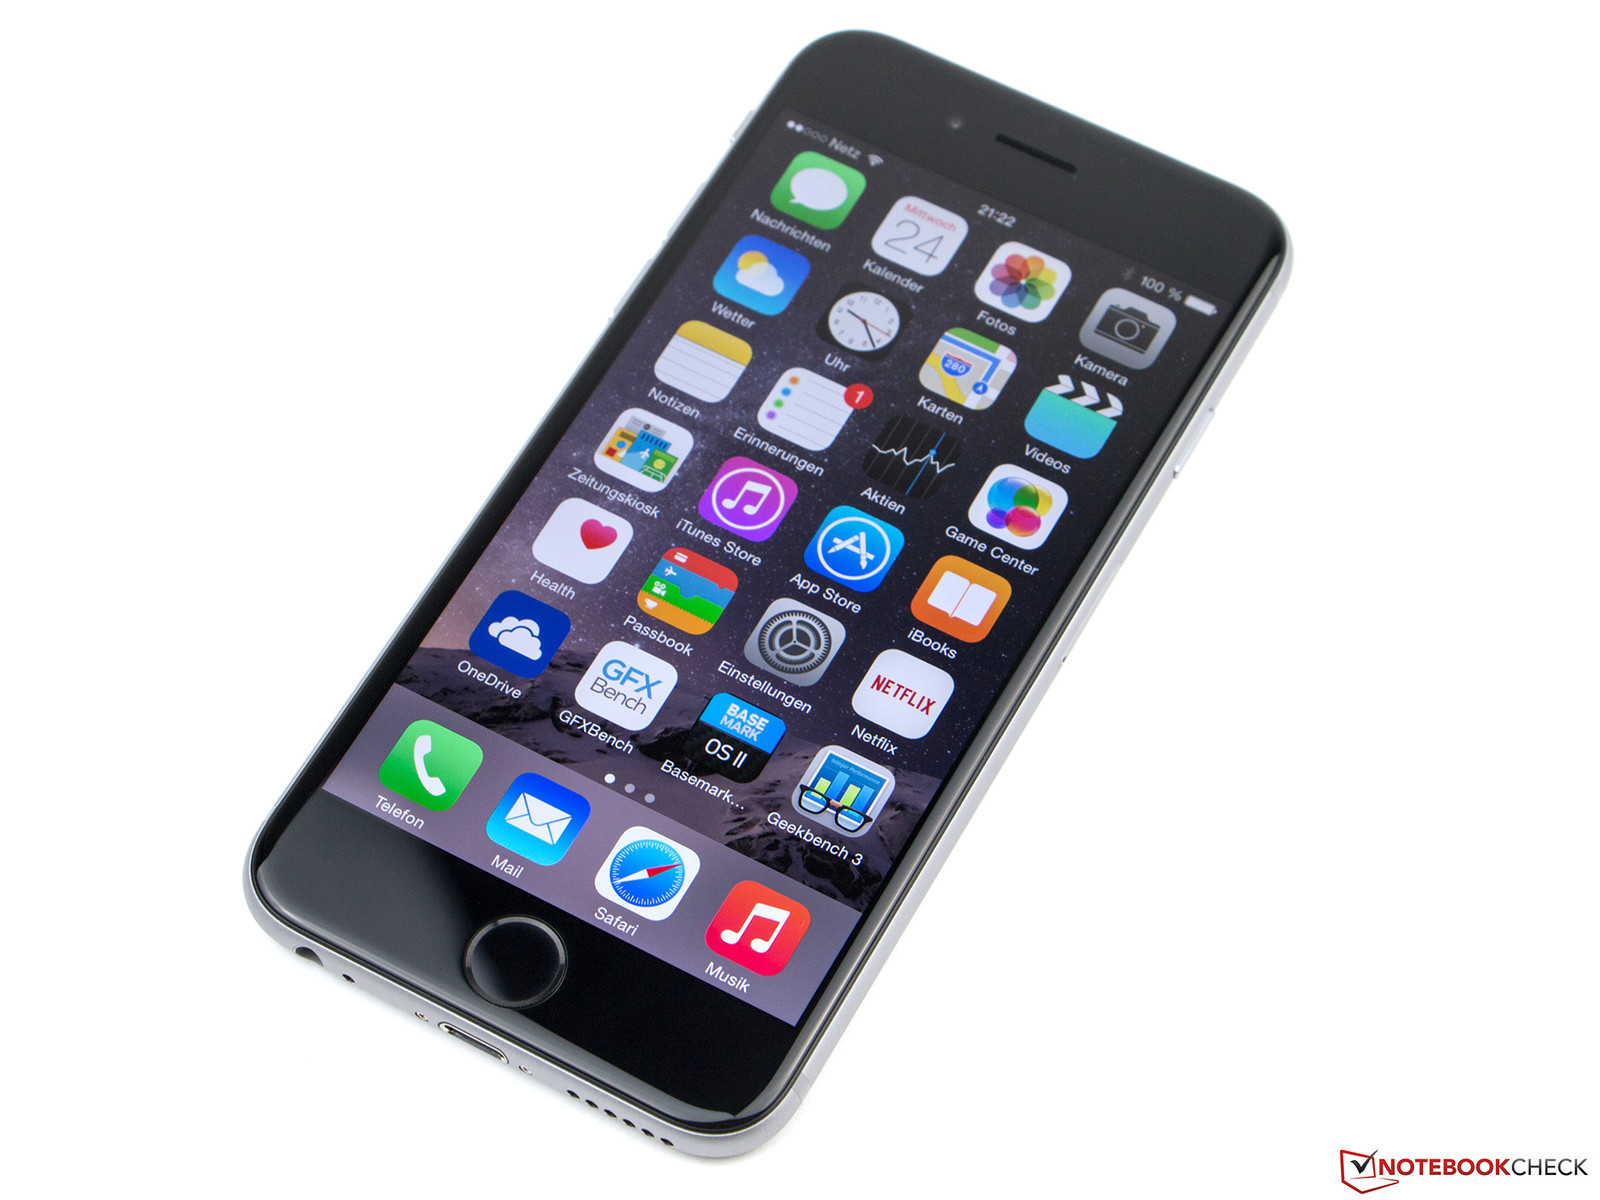
The Apple A8 is a high-end ARM SoC (System on a Chip) launched in September 2014 alongside the iPhone 6 and iPhone 6 Plus. The two CPU cores are clocked at 1.4 GHz (compared to the 1.3 GHz Apple A7) and are based on Apple's 2nd generation 64-bit architecture, called "Cyclone 2". Furthermore, the A8 integrates a PowerVR Series 6 (Rogue) GX6450 GPU and a 2x 32-bit LPDDR3-1333 memory controller.

Architecture 

With Cyclone 2, Apple have managed to improve the already high performance per clock of the original Cyclone core (Apple A7) by another 10 to 15 percent. Neither Qualcomm's Krait nor ARM's Cortex-A57 can compete with the resulting IPC. The exact design changes have not been revealed, but we would expect enlarged caches and registers as well as an optimized branch prediction. As an ARMv8 architecture, Cyclone 2 is 64-bit capable.

Performance

Thanks to its impressive performance per clock, the Apple 1.4 GHz dual-core is a tough opponent for other high-end SoCs like the Nvidia Tegra K1 (4 cores @ 2.3 GHz) or Qualcomm Snapdragon 805 (4 cores @ 2.7 GHz). While the quad-core competitors win most multi-threaded benchmarks, the Apple A8 offers superior single-threaded performance, which is arguably more relevant for most everyday tasks like browsing. Overall, the A8 is one of the fastest smartphone SoCs as of late 2014.

Graphics

The SoC integrates a PowerVR Series 6 (Rogue) GX6450 GPU consisting of 4 clusters. Each cluster offers four FP16 and two FP32 ALUs, leading to a slightly higher shader performance than the former G6430. The core is predicted to be clocked relatively low at around 450 MHz (115 GFLOPS) to help reduce power consumption. According to our benchmarks, the GX6450 clearly outclasses the Adreno 330 in terms of 3D performance, but looses against Nvidia's more power hungry Tegra K1. Thus, the GX6450 is one of the fastest smartphone GPUs as of 2014 and can handle even the most demanding mobile games in high resolutions.

Power Consumption

In contrast to previous Apple SoCs, the A8 is manufactured by TSMC instead of Samsung. Using a brand-new 20 nm process, the SoC measures just 89 mm² and consists of about 2 billion transistors. Power consumption should be similar to or slightly below competing high-end SoCs by Qualcomm or Samsung.

Apple M3

► remove from comparison Apple M3

The Apple M3 is a system on a chip (SoC) from Apple for notebooks that was introduced in late 2023. It integrates a new 8-core CPU with 4 performance cores with up to 4.06 GHz and 4 efficiency cores running at up to 2.75 GHz. Apple claims that the CPU is up to 20% faster than in the old Apple M2 (3.5 GHz)

Due to the higher clock speeds and architecture improvements, the processor performance is also significantly better than the M2 in benchmarks (see e.g. Geekbench below) and can keep up with the fastest CPUs in short single-core tests (like the Raptor Lake i9-13950HX).

The M3 also integrates a new graphics adapter with dynamic caching, mesh shading and ray tracing acceleration called Apple M3 10-Core GPU. According to Apple, it is 20% faster than the GPU in the M2. The chip integrates again 10 GPU cores, but the cheaper variant only offers 8 cores (e.g. in the entry iMac). Later in early 2025 Apple also introduced a 9-core variant in the new iPad Air models. Furthermore, the GPU only supports 2 displays (an additional 6K60 display to the internal one).

Both GPU and CPU can access the unified memory on the package together. It is still available in 8, 16 and 24 GB variants and offers the same 100 GB/s maximum bandwidth (unlike the Pro models that feature a reduced memory bandwidth). 

The integrated 16-core Neural Engine has also been revised and now offers 18 TOPS peak performance (versus 15.8 TOPS in the M2 but 35 TOPS in the new A17 Pro). The video engine now supports AV1 decoding in hardware. H.264, HEVC and ProRes (RAW) can still be decoded and encoded.

Unfortunately, the integrated wireless network module only supports Wi-Fi 6E (no Wi-Fi 7) and due to the support of only a single external monitor, the chip also has to make do with no Thunderbolt 4 (Thunderbolt 3 / USB 4 support only for up to 40 Gbit/s).

The chip is manufactured on the current 3nm TSMC process (N3B most likely) and contains 25 billion transistors (+25% vs. Apple M2). The 3nm process should also contribute to the excellent efficiency of the chip. Under load, the M3 CPU consumes approximately 20 Watt.

ModelApple A8Apple M3
CodenameCyclone 2
Clock1400 MHz2748 - 4056 MHz
L1 Cache256 KB
L2 Cache1 MB4 MB
L3 Cache4 MB
Cores / Threads2 / 28 / 8
4 x 4.1 GHz Apple M3 P-Core
4 x 2.7 GHz Apple M3 E-Core
Transistors2000 Million25000 Million
Technology20 nm3 nm
Die Size89 mm2
FeaturesARMv8 Instruction Set, PowerVR GX6450 (4 Cluster Rogue), 2x 32 Bit LPDDR3-1333 Memory ControllerARMv8 Instruction Set
iGPUPowerVR GX6450Apple M3 10-Core GPU
ArchitectureARMARM
Announced
SeriesApple M3
Series: M3
Apple M3 Max 16-Core compare2.75 - 4.06 GHz16 / 16 cores
Apple M3 Max 14-Core compare2.75 - 4.06 GHz14 / 14 cores
Apple M3 Pro 12-Core compare2.75 - 4.06 GHz12 / 12 cores
Apple M3 Pro 11-Core compare2.75 - 4.06 GHz11 / 11 cores
Apple M3 « 2.75 - 4.06 GHz8 / 8 cores
Manufacturerwww.apple.com

Benchmarks

Cinebench 2024 - Cinebench 2024 CPU Single Core
100%
1 M3 +
min: 140     avg: 141     median: 141 (79%)     max: 142 Points
Cinebench 2024 - Cinebench 2024 CPU Multi Core
100%
1 M3 +
min: 576     avg: 622     median: 599.5 (11%)     max: 712 Points
Cinebench R23 - Cinebench R23 Multi Core
100%
1 M3 +
min: 10074     avg: 10275     median: 10298 (10%)     max: 10454 Points
Cinebench R23 - Cinebench R23 Single Core
100%
1 M3 +
min: 1900     avg: 1901     median: 1900 (80%)     max: 1904 Points
Cinebench R20 - Cinebench R20 CPU (Single Core)
100%
1 M3 +
504 Points (55%)
Cinebench R20 - Cinebench R20 CPU (Multi Core)
100%
1 M3 +
2818 Points (7%)
Cinebench R15 - Cinebench R15 CPU Multi 64 Bit
100%
1 M3 +
1499 Points (9%)
Cinebench R15 - Cinebench R15 CPU Single 64 Bit
100%
1 M3 +
271 Points (75%)
Blender - Blender 3.3 Classroom CPU *
100%
1 M3 +
min: 491     avg: 590     median: 517 (7%)     max: 761 Seconds
Blender - Blender 2.79 BMW27 CPU *
100%
1 M3 +
min: 474     avg: 509     median: 494 (3%)     max: 558 Seconds
3DMark - 3DMark Ice Storm Unlimited Physics
100%
1 A8 +
min: 9137     avg: 9282     median: 9259 (7%)     max: 9473 Points
Geekbench 6.4 - Geekbench 6.4 Single-Core
424 Points (11%)
100%
M3 +
min: 2994     avg: 3057     median: 3054 (76%)     max: 3130 Points
Geekbench 6.4 - Geekbench 6.4 Multi-Core
600 Points (2%)
100%
M3 +
min: 11752     avg: 11921     median: 11966 (46%)     max: 12066 Points
Geekbench 5.5 - Geekbench 5.1 - 5.5 64 Bit Single-Core
100%
A8 +
328 Points (13%)
688%
M3 +
min: 1286     avg: 2092     median: 2256 (88%)     max: 2350 Points
Geekbench 5.5 - Geekbench 5.1 - 5.5 64 Bit Multi-Core
100%
A8 +
627 Points (1%)
1686%
M3 +
min: 10402     avg: 10603     median: 10570 (19%)     max: 10774 Points
Geekbench 4.4 - Geekbench 4.1 - 4.4 64 Bit Single-Core
100%
1 A8 +
1591 Points (16%)
Geekbench 4.4 - Geekbench 4.1 - 4.4 64 Bit Multi-Core
100%
1 A8 +
2759 Points (3%)
Geekbench 3 - Geekbench 3 32 Bit Multi-Core
100%
1 A8 +
min: 2864     avg: 2879     median: 2881.5 (5%)     max: 2889 Points
Geekbench 3 - Geekbench 3 32 Bit Single-Core
100%
1 A8 +
min: 1609     avg: 1615     median: 1614.5 (21%)     max: 1620 Points
Geekbench 3 - Geekbench 3 64 Bit Multi-Core
3097 Points (5%)
Geekbench 3 - Geekbench 3 64 Bit Single-Core
1714 Points (26%)
Linpack Android / IOS - Linpack Multi Thread
100%
1 A8 +
min: 1439     avg: 1440     median: 1440 (49%)     max: 1441 MFLOPS
Linpack Android / IOS - Linpack Single Thread
100%
1 A8 +
min: 766     avg: 767     median: 767 (75%)     max: 768 MFLOPS
Mozilla Kraken 1.1 - Kraken 1.1 Total Score *
100%
A8 +
min: 4470     avg: 4524     median: 4514 (5%)     max: 4597 ms
1244%
M3 +
min: 322.8     avg: 350.3     median: 362.8 (0%)     max: 373.2 ms
Sunspider - Sunspider 1.0 Total Score *
100%
1 A8 +
min: 340     avg: 354.9     median: 347.2 (4%)     max: 385 ms
Sunspider - Sunspider 0.9.1 Total Score *
100%
1 A8 +
min: 211.3     avg: 286.6     median: 286.6 (3%)     max: 361.8 ms
Octane V2 - Octane V2 Total Score
100%
A8 +
min: 7225     avg: 7408     median: 7377 (5%)     max: 7653 Points
1310%
M3 +
min: 92645     avg: 95595     median: 96622 (71%)     max: 98093 Points
WebXPRT 4 - WebXPRT 4 Score
100%
1 M3 +
min: 313     avg: 314     median: 314 (86%)     max: 315 Points
WebXPRT 3 - WebXPRT 3 Score
100%
1 M3 +
min: 423     avg: 438.7     median: 445 (80%)     max: 448 Points
AnTuTu v5 - AnTuTu v5 Total Score
100%
1 A8 +
min: 30877     avg: 43443     median: 49093 (50%)     max: 50360 Points
Antutu v10 - AnTuTu v10 Total Score
100%
1 M3 +
min: 2045290     avg: 2096340     median: 2096340 (70%)     max: 2147390 Points
Antutu v10 - AnTuTu v10 CPU
100%
1 M3 +
min: 538633     avg: 555031     median: 555030 (16%)     max: 571428 Points
PassMark PerformanceTest Mobile V1 - PerformanceTest Mobile V1 CPU Tests
100%
A8 +
min: 43696     avg: 44118     median: 44118 (6%)     max: 44540 Points
48%
M3 +
min: 21270     avg: 21339     median: 21339 (3%)     max: 21408 Points
CrossMark - CrossMark Overall
100%
1 M3 +
min: 1847     avg: 1850     median: 1847 (69%)     max: 1857 Points
Power Consumption - Geekbench 5.5 Power Consumption 150cd *
100%
1 M3 +
min: 7.79     avg: 7.9     median: 7.9 (3%)     max: 8.01 Watt
Power Consumption - Idle Power Consumption - external Monitor *
100%
1 M3 +
min: 2.63     avg: 2.8     median: 2.8 (2%)     max: 2.87 Watt
Power Consumption - Idle Power Consumption 150cd 1min *
100%
1 M3 +
min: 2.6     avg: 3.7     median: 3.9 (4%)     max: 4.7 Watt

Average Benchmarks Apple A8 → 100% n=5

Average Benchmarks Apple M3 → 995% n=5

- Range of benchmark values for this graphics card
red legend - Average benchmark values for this graphics card
* Smaller numbers mean a higher performance
1 This benchmark is not used for the average calculation

Add one or more devices and compare

In the following list you can select (and also search for) devices that should be added to the comparison. You can select more than one device.

restrict list:
v1.33
log 12. 16:49:27

#0 ran 0s before starting gpusingle class +0s ... 0s

#1 checking url part for id 6376 +0s ... 0s

#2 checking url part for id 15110 +0s ... 0s

#3 redirected to Ajax server, took 1755010167s time from redirect:0 +0s ... 0s

#4 did not recreate cache, as it is less than 5 days old! Created at Sun, 10 Aug 2025 05:18:26 +0200 +0s ... 0s

#5 composed specs +0.008s ... 0.008s

#6 did output specs +0s ... 0.008s

#7 getting avg benchmarks for device 6376 +0.001s ... 0.008s

#8 got single benchmarks 6376 +0.005s ... 0.014s

#9 getting avg benchmarks for device 15110 +0.001s ... 0.015s

#10 got single benchmarks 15110 +0.008s ... 0.023s

#11 got avg benchmarks for devices +0s ... 0.023s

#12 No cached benchmark found, getting uncached values +0.005s ... 0.028s

#13 No cached benchmark found, getting uncached values +0.001s ... 0.029s

#14 No cached benchmark found, getting uncached values +0.004s ... 0.033s

#15 No cached benchmark found, getting uncached values +0s ... 0.034s

#16 min, max, avg, median took s +0.008s ... 0.042s

#17 return log +0s ... 0.042s

Please share our article, every link counts!
Mail Logo
> Expert Reviews and News on Laptops, Smartphones and Tech Innovations > Benchmarks / Tech > Processor Comparison - Head 2 Head
Redaktion, 2017-09- 8 (Update: 2023-07- 1)