Notebookcheck Logo

AMD A8-5550M vs AMD A8-4500M

AMD A8-5550M

► remove from comparison AMD A8-5550M

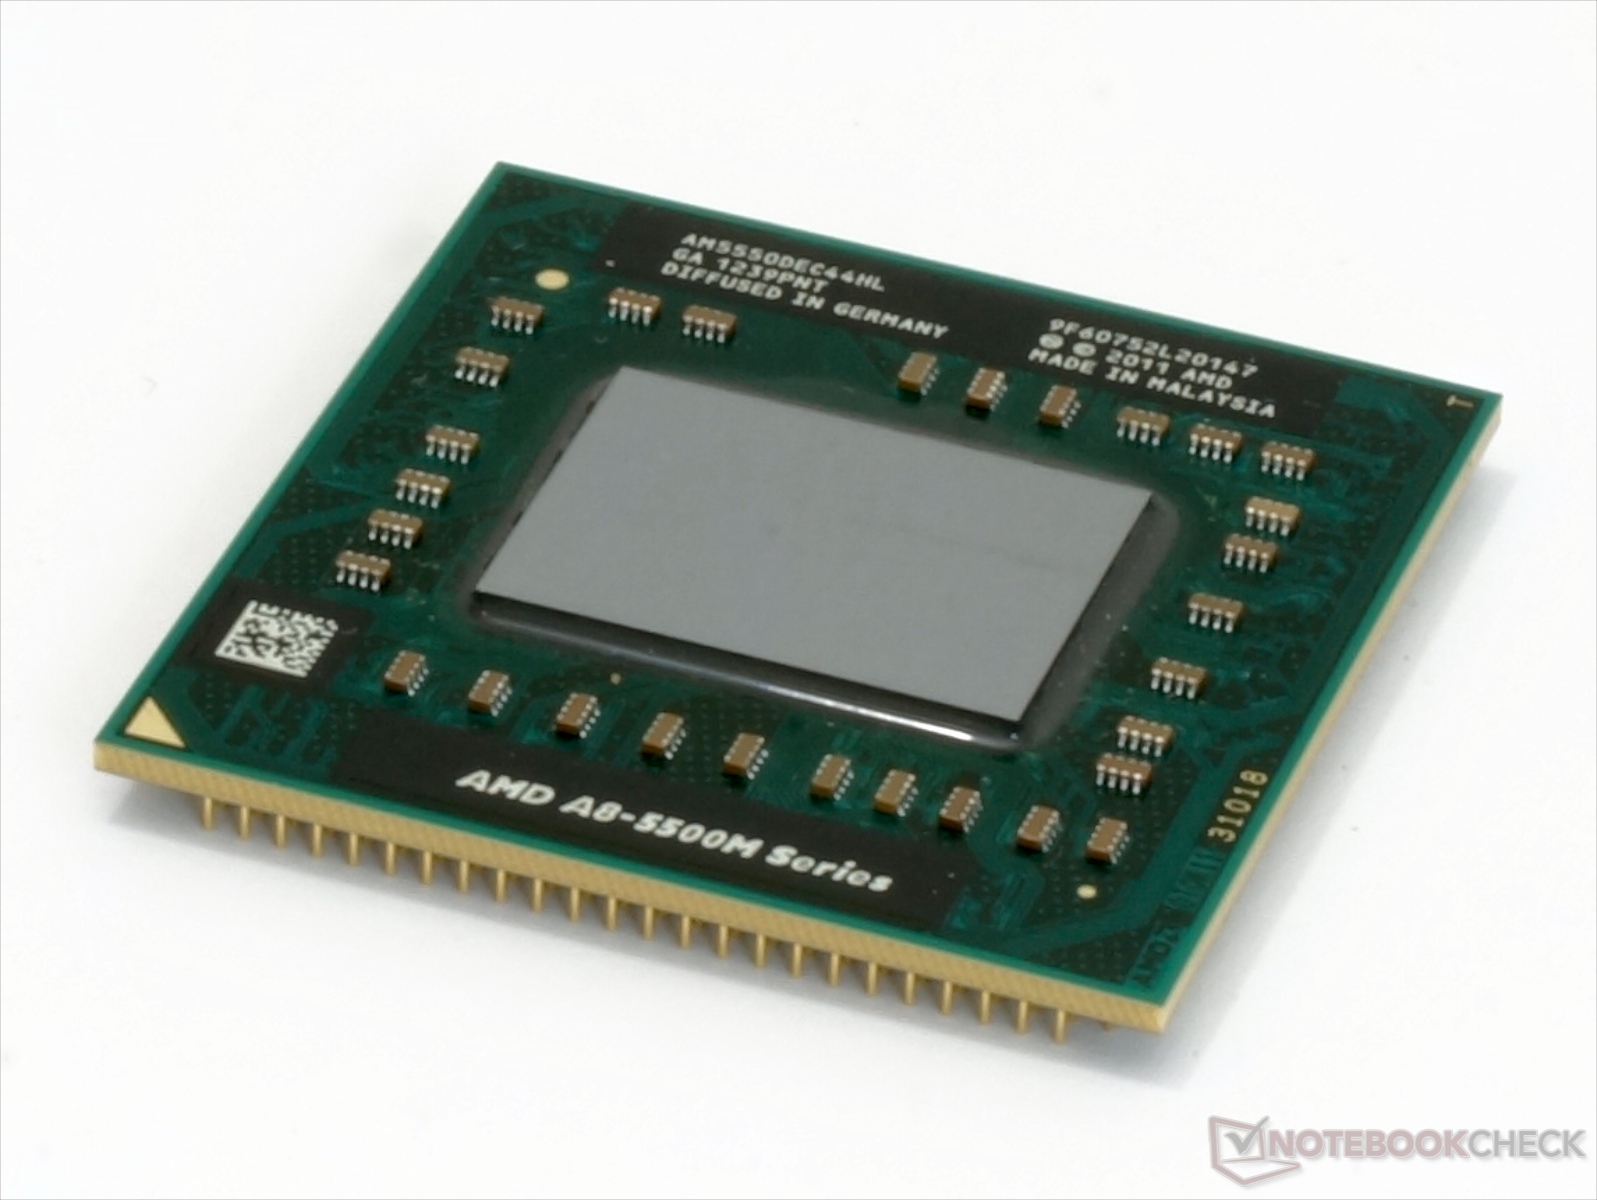
The AMD A8-5550M is a mobile quad-core processor based on the Richland-architecture. As successor to the A8-4500M, the A8-5550M has a slightly higher CPU and graphics performance and settles in the lower middle class. The APU integrates 4 CPU cores, a DirectX 11 graphics unit and the Northbridge along with a DDR3 memory controller.

Compared to Trinity, Richland has been modified just slightly. Therefore, no changes in the feature set or the Pro-MHz performance can be reported. The design of the chip is still based on the Bulldozer architecture, which consists of so-called modules. Each of the two modules integrates 2 integer units, but only one FPU. Just like Trinity, Richland supports nearly all current techniques such as AVX (including FMA), AES or Turbo Core.

According to the clock rates of 2.1 to 3.1 GHz, the A8-5550M performs about 15 percent slower than the A10-5750M and similar to a Core i3-2310M. Consequently, the performance in current applications and games is sufficient.

The graphics unit called Radeon HD 8550G offers 256 shader units (VLIW4) and clocks slightly higher than the HD 7640G. With fast dual-channel memory, performance matches a dedicated Radeon HD 7570M.

The power consumption of the entire APU is rated at 35 watts, which is comparable to conventional middle-class models of competition. Thus, the APU is best suited for 14 inch notebooks or bigger.

AMD A8-4500M

► remove from comparison AMD A8-4500M

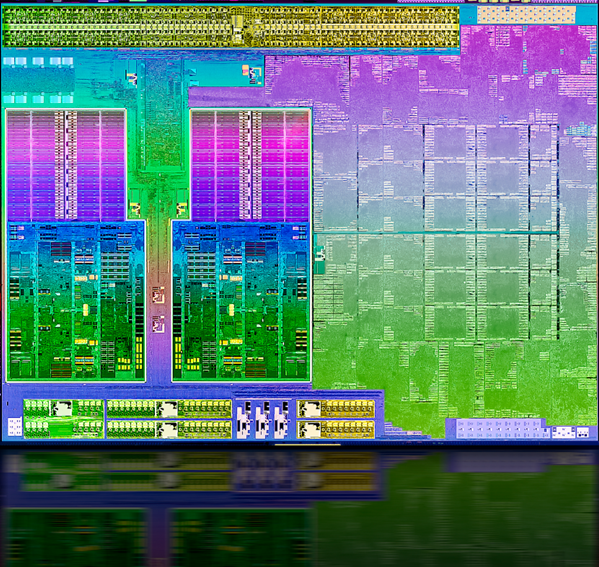
The AMD A8-4500M is a mobile quad-core processor based on the Trinity architecture. Officially introduced in Q2 2012, it is the direct successor to the Llano A-series of APUs (Accelerated Processing Unit). The processing unit is manufactured in 32nm SOI and integrates a 1.9 GHz CPU (up to 2.8 GHz w/ Turbo Core) with a relatively fast Radeon HD 7640G GPU alongside a dual-channel memory controller, video de- and encoders and a northbridge.

The CPU cores are based on a reworked Bulldozer architecture, called Piledriver. Although marketed as a quad-core processor, the A8-4500M includes only two modules with four integer-cores and two floating-point cores total. As a result, the CPU is not a true quad-core processor.

When compared to previous Bulldozer cores, AMD has managed to improve upon the IPC (instructions per clock) performance of Trinity cores while allowing for higher clock frequencies. However, when compared to its Llano predecessor, the multithreaded performance of Trinity has only been slightly improved. The enhanced Turbo Core 3.0 feature functions well in speeding up single threaded performance, although it is still not on the same level as Intel’s Turbo Boost equivalent. Regardless, AMD has managed to include other features as well, such as the AVX extension (including FMA) and support for AES encryption.

In terms of raw general performance, the A8-4500M performs similar to the Llano-based A8-3500M. Single-threaded workloads can especially benefit from the new architecture and the updated Turbo Core functionality. If compared to Intels Core-i3-series, the A8-4500M offers less performance in most cases. Nonetheless, CPU performance from the AMD processor should be sufficient for all daily workloads like Office, Internet browsing and even light video editing or gaming.

The integrated DirectX 11-compatible Radeon HD 7640G offers only 256 shader cores of the Trinity chip (7660G: 384) and, thanks to Turbo Core, will operate anywhere between 497 to 686 MHz depending on the current application demand. On average, the performance of the HD 7640G GPU is comparable to a dedicated Radeon HD 7610M and is even faster than the HD Graphics 4000 as found in Intel’s Ivy Bridge.

The power consumption of the A8-4500M APU is rated at 35 Watt TDP and is therefore comparable to mid-range dual-core Ivy Bridge processors. Consequently, the A8-4500M is best suited for 14-inch notebooks or larger.

ModelAMD A8-5550MAMD A8-4500M
CodenameRichlandTrinity
SeriesAMD AMD A-SeriesAMD AMD A-Series
Series: AMD A-Series Trinity
AMD A10-5750M compare2.5 - 3.5 GHz4 / 4 cores
AMD A10-5757M compare2.5 - 3.5 GHz4 / 4 cores
AMD A10-5745M compare2.1 - 2.9 GHz4 / 4 cores
AMD A8-5550M « 2.1 - 3.1 GHz4 / 4 cores
AMD A8-5557M compare2.1 - 3.1 GHz4 / 4 cores
AMD A8-5545M compare1.7 - 2.7 GHz4 / 4 cores
AMD A6-5350M compare2.9 - 3.5 GHz2 / 2 cores
AMD A6-5357M compare2.9 - 3.5 GHz2 / 2 cores
AMD A4-5150M compare2.7 - 3.3 GHz2 / 2 cores
AMD A6-5345M compare2.2 - 2.8 GHz2 / 2 cores
AMD A4-5145M compare2 - 2.6 GHz2 / 2 cores
AMD A10-4600M compare2.3 - 3.2 GHz4 / 4 cores
AMD A10-4657M compare2.3 - 3.2 GHz4 / 4 cores
AMD A10-4655M compare2 - 2.8 GHz4 / 4 cores
AMD A8-4500M « 1.9 - 2.8 GHz4 / 4 cores
AMD A8-4557M compare1.9 - 2.8 GHz4 / 4 cores
AMD A8-4555M compare1.6 - 2.4 GHz4 / 4 cores
AMD A6-4400M compare2.7 - 3.2 GHzcores
AMD A4-4300M compare2.5 - 3 GHzcores
AMD A6-4455M compare2.1 - 2.6 GHzcores
AMD A4-4355M compare1.9 - 2.4 GHzcores
Clock2100 - 3100 MHz1900 - 2800 MHz
L2 Cache4 MB4 MB
Cores / Threads4 / 44 / 4
TDP35 Watt35 Watt
Technology32 nm32 nm
FeaturesSSE (1, 2, 3, 3S, 4.1, 4.2, 4A), x86-64, AES, AVX, FMA, DDR3-1600 ControllerSSE (1, 2, 3, 3S, 4.1, 4.2, 4A), x86-64, AES, AVX, FMA
iGPUAMD Radeon HD 8550G (515 - 720 MHz)AMD Radeon HD 7640G (496 - 685 MHz)
Architecturex86x86
Announced
Transistors1303 Million
Die Size246 mm2

Benchmarks

Cinebench R15 - Cinebench R15 CPU Multi 64 Bit
188 Points (1%)
Cinebench R15 - Cinebench R15 CPU Single 64 Bit
68 Points (19%)
Cinebench R11.5 - Cinebench R11.5 CPU Multi 64 Bit
min: 1.9     avg: 2     median: 2.1 (3%)     max: 2.06 Points
min: 1.68     avg: 1.7     median: 1.7 (2%)     max: 1.76 Points
Cinebench R11.5 - Cinebench R11.5 CPU Single 64 Bit
min: 0.78     avg: 0.8     median: 0.8 (19%)     max: 0.79 Points
min: 0.56     avg: 0.7     median: 0.7 (17%)     max: 0.71 Points
Cinebench R10 - Cinebench R10 Rend. Single (32bit)
min: 2139     avg: 2276     median: 2321 (14%)     max: 2368 Points
min: 1709     avg: 1804     median: 1820.5 (11%)     max: 1862 Points
Cinebench R10 - Cinebench R10 Rend. Multi (32bit)
min: 5334     avg: 5702     median: 5844 (4%)     max: 5929 Points
min: 4536     avg: 4825     median: 4872 (4%)     max: 4950 Points
Cinebench R10 - Cinebench R10 Rend. Multi (64bit)
min: 7526     avg: 7930     median: 8077 (5%)     max: 8186 Points
min: 6524     avg: 6770     median: 6795 (4%)     max: 6958 Points
Cinebench R10 - Cinebench R10 Rend. Single (64bit)
min: 2902     avg: 3081     median: 3155 (4%)     max: 3187 Points
min: 2355     avg: 2476     median: 2475.5 (3%)     max: 2593 Points
wPrime 2.10 - wPrime 2.0 1024m *
min: 863     avg: 900     median: 891 (11%)     max: 947 s
min: 1001     avg: 1028     median: 1039 (12%)     max: 1039 s
wPrime 2.10 - wPrime 2.0 32m *
min: 25.3     avg: 26.2     median: 26 (5%)     max: 27.18 s
min: 30.61     avg: 31.2     median: 31.5 (6%)     max: 31.64 s
WinRAR - WinRAR 4.0
min: 1902     avg: 1933     median: 1932.5 (3%)     max: 1963 Points
1777 Points (3%)
7-Zip 18.03 - 7-Zip 18.03 Multi Thread 4 runs
6631 MIPS (4%)
7-Zip 18.03 - 7-Zip 18.03 Single Thread 4 runs
2646 MIPS (31%)
X264 HD Benchmark 4.0 - x264 Pass 2
min: 13.3     avg: 13.5     median: 13.5 (5%)     max: 13.67 fps
10.8 fps (4%)
X264 HD Benchmark 4.0 - x264 Pass 1
min: 67     avg: 70.6     median: 70.6 (16%)     max: 74.2 fps
58.4 fps (13%)
TrueCrypt - TrueCrypt Serpent
min: 0.141     avg: 0.1     median: 0.1 (4%)     max: 0.148 GB/s
0.1 GB/s (4%)
TrueCrypt - TrueCrypt Twofish
min: 0.256     avg: 0.3     median: 0.3 (5%)     max: 0.269 GB/s
0.2 GB/s (4%)
TrueCrypt - TrueCrypt AES
1.3 GB/s (3%)
1.1 GB/s (3%)
Blender - Blender 2.79 BMW27 CPU *
3223 Seconds (23%)
R Benchmark 2.5 - R Benchmark 2.5 *
1.7 sec (37%)
3DMark 06 - CPU - 3DMark 06 - CPU
min: 2768     avg: 2854     median: 2795 (6%)     max: 2999 Points
Super Pi mod 1.5 XS 1M - Super Pi mod 1.5 XS 1M *
min: 31.4     avg: 31.5     median: 31.4 (7%)     max: 31.61 s
min: 34.59     avg: 38.5     median: 40.8 (9%)     max: 41.28 s
Super Pi mod 1.5 XS 2M - Super Pi mod 1.5 XS 2M *
min: 71     avg: 71.1     median: 71 (3%)     max: 71.4 s
min: 78.2     avg: 87.1     median: 91.9 (4%)     max: 93.8 s
Super Pi Mod 1.5 XS 32M - Super Pi mod 1.5 XS 32M *
min: 1849     avg: 1852     median: 1851.5 (8%)     max: 1854 s
min: 2034     avg: 2306     median: 2396 (11%)     max: 2431 s
SiSoft Sandra Dhrystone (MIPS) - SiSoft Sandra Dhrystone (MIPS)
29660 MIPS (14%)
min: 26660     avg: 27698     median: 26700 (13%)     max: 30470 MIPS
SiSoft Sandra Whetstone (MFLOPS) - SiSoft Sandra Whetstone (MFLOPS)
20870 MFLOPS (16%)
min: 18760     avg: 19672     median: 18780 (14%)     max: 23120 MFLOPS
Windows 7 Experience Index - Win7 CPU
6.7 Points (86%)
3DMark Vantage - 3DM Vant. Perf. CPU no Physx
min: 6035     avg: 6251     median: 6321 (5%)     max: 6398 Points
min: 5119     avg: 5399     median: 5348 (4%)     max: 5665 Points
3DMark 11 - 3DM11 Performance Physics
min: 2274     avg: 2437     median: 2503 (6%)     max: 2535 Points
3DMark - 3DMark Ice Storm Physics
min: 19496     avg: 21244     median: 21872 (18%)     max: 22365 Points
min: 18472     avg: 19251     median: 19286 (16%)     max: 19813 Points
3DMark - 3DMark Ice Storm Extreme Physics
22155 Points (18%)
3DMark - 3DMark Ice Storm Unlimited Physics
25741 Points (21%)
3DMark - 3DMark Cloud Gate Physics
min: 1662     avg: 1771     median: 1777 (4%)     max: 1869 Points
min: 1514     avg: 1548     median: 1540 (4%)     max: 1600 Points
3DMark - 3DMark Fire Strike Standard Physics
min: 2350     avg: 2492     median: 2489 (4%)     max: 2641 Points
min: 2129     avg: 2163     median: 2149 (4%)     max: 2242 Points
Geekbench 5.5 - Geekbench 5.1 - 5.5 64 Bit Single-Core
395 Points (15%)
Geekbench 5.5 - Geekbench 5.1 - 5.5 64 Bit Multi-Core
1073 Points (2%)
Geekbench 3 - Geekbench 3 32 Bit Multi-Core
4417 Points (8%)
Geekbench 3 - Geekbench 3 32 Bit Single-Core
1691 Points (22%)
Geekbench 2 - 32 Bit - Geekbench Stream
4680 Points (25%)
min: 4131     avg: 4177     median: 4131 (22%)     max: 4270 Points
Geekbench 2 - 32 Bit - Geekbench Memory
3498 Points (24%)
min: 3032     avg: 3107     median: 3032 (21%)     max: 3257 Points
Geekbench 2 - 32 Bit - Geekbench Floating Point
4514 Points (9%)
min: 5242     avg: 5272     median: 5242 (10%)     max: 5332 Points
Geekbench 2 - 32 Bit - Geekbench Integer
4814 Points (10%)
min: 3925     avg: 3972     median: 3925 (8%)     max: 4065 Points
Geekbench 2 - 32 Bit - Geekbench Total Score
4432 Points (12%)
min: 4227     avg: 4274     median: 4227 (11%)     max: 4367 Points
Mozilla Kraken 1.1 - Kraken 1.1 Total Score *
min: 2921     avg: 3334     median: 2939 (3%)     max: 4141 ms
Sunspider - Sunspider 1.0 Total Score *
min: 185.5     avg: 235.7     median: 235.7 (3%)     max: 285.8 ms
Octane V2 - Octane V2 Total Score
min: 8435     avg: 11020     median: 11019.5 (8%)     max: 13604 Points
WebXPRT 3 - WebXPRT 3 Score
65.3 Points (12%)

Average Benchmarks AMD A8-5550M → 100% n=30

Average Benchmarks AMD A8-4500M → 86% n=30

- Range of benchmark values for this graphics card
red legend - Average benchmark values for this graphics card
* Smaller numbers mean a higher performance
1 This benchmark is not used for the average calculation

Add one or more devices and compare

In the following list you can select (and also search for) devices that should be added to the comparison. You can select more than one device.

restrict list:
v1.33
log 19. 12:52:52

#0 ran 0s before starting gpusingle class +0s ... 0s

#1 checking url part for id 3779 +0s ... 0s

#2 checking url part for id 3318 +0s ... 0s

#3 redirected to Ajax server, took 1755600771s time from redirect:0 +0s ... 0s

#4 did not recreate cache, as it is less than 5 days old! Created at Tue, 19 Aug 2025 05:19:27 +0200 +0s ... 0s

#5 composed specs +0.007s ... 0.007s

#6 did output specs +0s ... 0.007s

#7 getting avg benchmarks for device 3779 +0.001s ... 0.008s

#8 got single benchmarks 3779 +0.006s ... 0.014s

#9 getting avg benchmarks for device 3318 +0.001s ... 0.014s

#10 got single benchmarks 3318 +0.008s ... 0.022s

#11 got avg benchmarks for devices +0s ... 0.022s

#12 min, max, avg, median took s +0.033s ... 0.055s

#13 return log +0.001s ... 0.056s

Please share our article, every link counts!
Mail Logo
> Expert Reviews and News on Laptops, Smartphones and Tech Innovations > Benchmarks / Tech > Processor Comparison - Head 2 Head
Redaktion, 2017-09- 8 (Update: 2023-07- 1)