

Apple A14 Bionic vs Apple M3 vs Apple M3 Max 14-Core
Apple A14 Bionic
► remove from comparison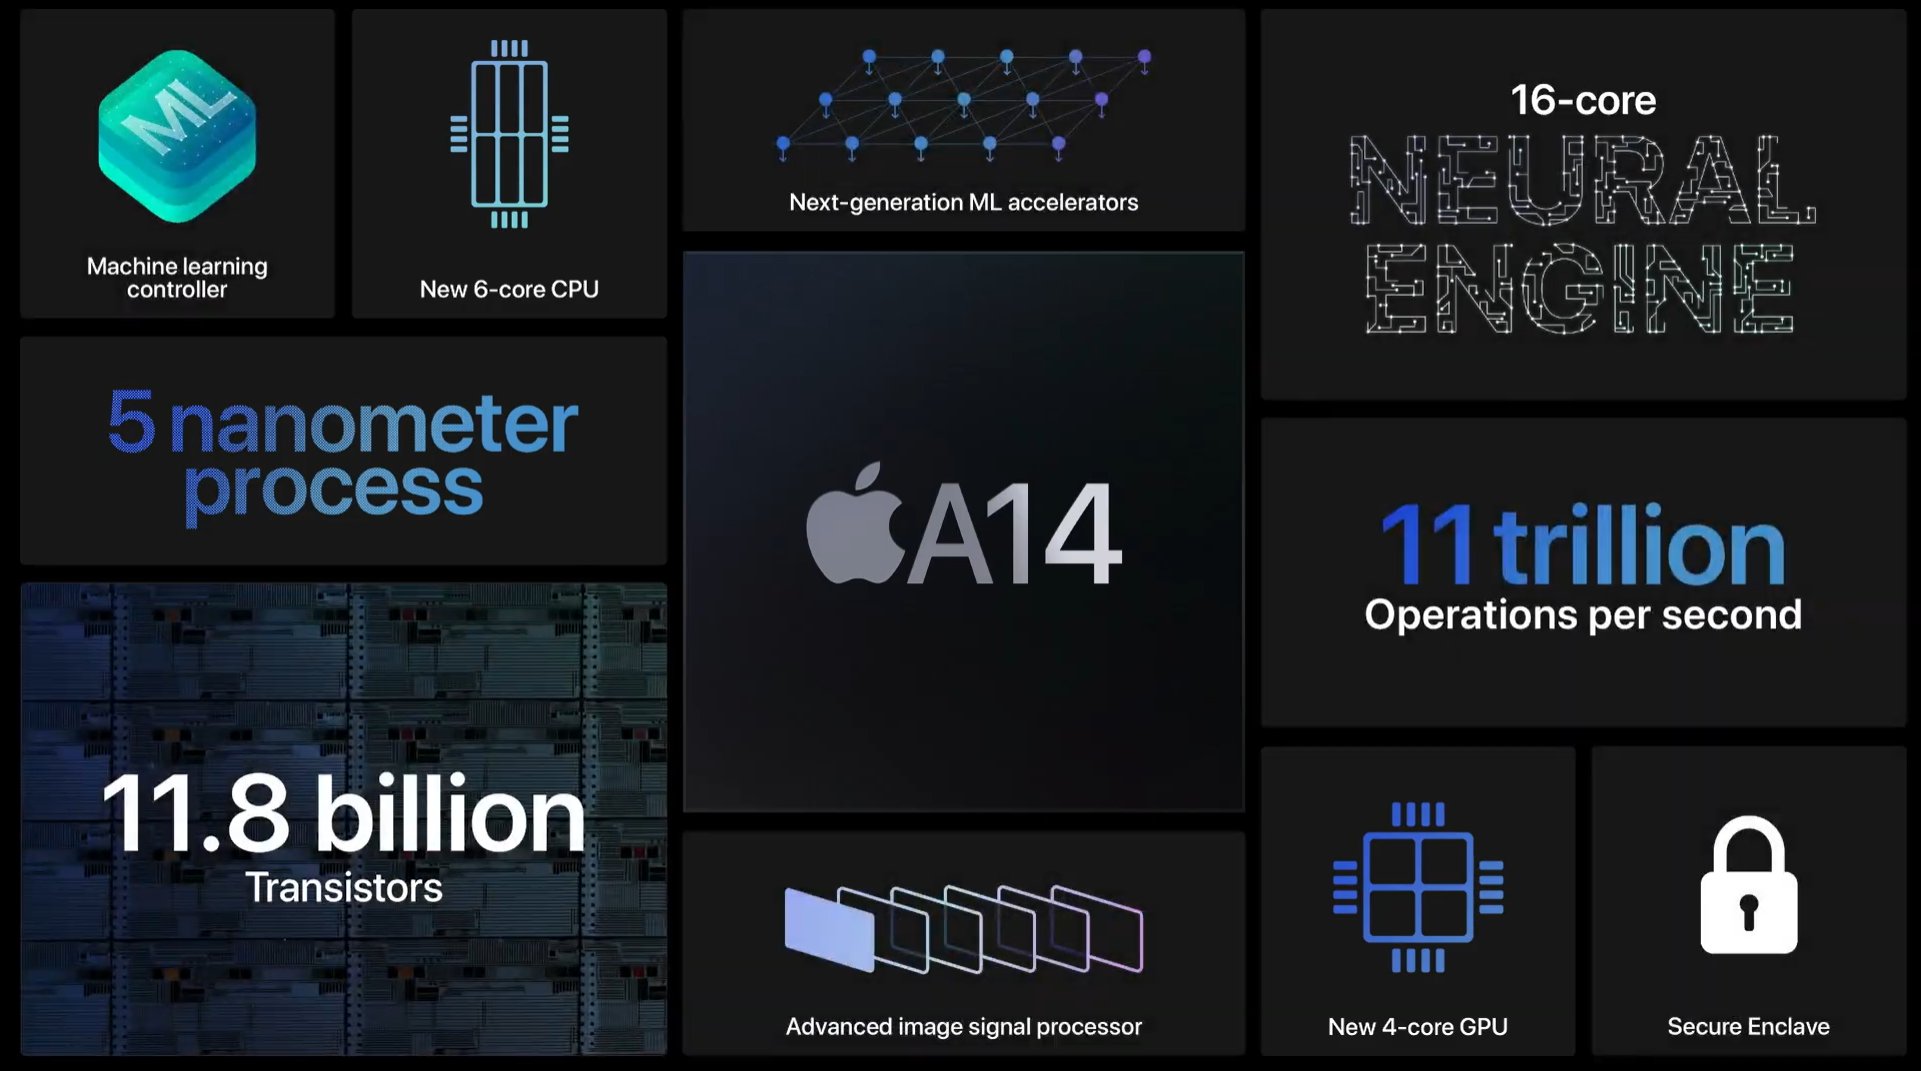
The Apple A14 Bionic is a System on a Chip (SoC) from Apple that is found in the iPhone 12 and iPad Air (2020) models. It was announced late 2020 and offers 6 cores divided in 2 performance cores (Firestorm) and four power efficiency cores (Icestorm). Apple states that the A14 offers a 40 percent higher CPU performance than the old A12 in the iPad Air 2019. That should translate to a modest gain of around 20% compared to the Apple A13. The A14 integrates a fast 4-core-GPU and a 16-core Neural Engine that is able to reach a maximum of 11 TOPS. The memory controller supports LPDDR4X and 4 or 6 GB are directly above the chip (package on package - PoP).
The chip is manufactured in 5nm and integrates 11.8 billion transistors.
Apple M3
► remove from comparison
The Apple M3 is a system on a chip (SoC) from Apple for notebooks that was introduced in late 2023. It integrates a new 8-core CPU with 4 performance cores with up to 4.06 GHz and 4 efficiency cores running at up to 2.75 GHz. Apple claims that the CPU is up to 20% faster than in the old Apple M2 (3.5 GHz).
Due to the higher clock speeds and architecture improvements, the processor performance is also significantly better than the M2 in benchmarks (see e.g. Geekbench below) and can keep up with the fastest CPUs in short single-core tests (like the Raptor Lake i9-13950HX).
The M3 also integrates a new graphics adapter with dynamic caching, mesh shading and ray tracing acceleration called Apple M3 10-Core GPU. According to Apple, it is 20% faster than the GPU in the M2. The chip integrates again 10 GPU cores, but the cheaper variant only offers 8 cores (e.g. in the entry iMac). Later in early 2025 Apple also introduced a 9-core variant in the new iPad Air models. Furthermore, the GPU only supports 2 displays (an additional 6K60 display to the internal one).
Both GPU and CPU can access the unified memory on the package together. It is still available in 8, 16 and 24 GB variants and offers the same 100 GB/s maximum bandwidth (unlike the Pro models that feature a reduced memory bandwidth).
The integrated 16-core Neural Engine has also been revised and now offers 18 TOPS peak performance (versus 15.8 TOPS in the M2 but 35 TOPS in the new A17 Pro). The video engine now supports AV1 decoding in hardware. H.264, HEVC and ProRes (RAW) can still be decoded and encoded.
Unfortunately, the integrated wireless network module only supports Wi-Fi 6E (no Wi-Fi 7) and due to the support of only a single external monitor, the chip also has to make do with no Thunderbolt 4 (Thunderbolt 3 / USB 4 support only for up to 40 Gbit/s).
The chip is manufactured on the current 3nm TSMC process (N3B most likely) and contains 25 billion transistors (+25% vs. Apple M2). The 3nm process should also contribute to the excellent efficiency of the chip. Under load, the M3 CPU consumes approximately 20 Watt.
Apple M3 Max 14-Core
► remove from comparison
The Apple M3 Max 14 core CPU is a system on a chip (SoC) from Apple for notebooks that was introduced towards the end of 2023. It integrates a new 14-core CPU with 10 performance cores with up to 4.06 GHz and 4 efficiency cores with 2.8 GHz. There is also a more powerful 16-core variant with 40 GPU cores.
Thanks to the higher clock rates and architectural improvements, the processor performance is also significantly better than the M2 Max in benchmarks and can keep up with the fastest mobile CPUs.
The M3 also integrates a new graphics card with dynamic caching, mesh shading and ray tracing acceleration via hardware. In the cheaper model, 30 of the chip's 40 cores are used and support up to 5 displays simultaneously (internal and 4 external).
GPU and CPU can jointly access the shared memory on the package (unified memory). This is available in 36 and 96 GB variants and offers 400 GB/s maximum bandwidth (512 bit bus).
The integrated 16-core Neural Engine has also been revised and now offers 18 TOPS peak performance (compared to 15.8 TOPS in the M2 but 35 TOPS in the new A17 Pro). The video engine now also supports AV1 decoding in hardware. H.264, HEVC and ProRes (RAW) can still be decoded and encoded. Like its predecessor, the Max chip offers two video engines and can therefore encode and decode two streams simultaneously.
Unfortunately, the integrated WLAN only continues to support WiFi 6E (no WiFi 7), unlike the small M3 SoC thunderbolt 4 is also supported (max 40 Gbit/s).
The chip is manufactured in the current 3nm process (N3B) at TSMC and contains 92 billion transistors (+37% vs. Apple M2 Max).
| Model | Apple A14 Bionic | Apple M3 | Apple M3 Max 14-Core | ||||||||||||||||||||||||||||||||||||||||
| Codename | Firestorm, Icestorm | ||||||||||||||||||||||||||||||||||||||||||
| Series | Apple Apple A-Series | Apple M3 | Apple M3 | ||||||||||||||||||||||||||||||||||||||||
| Clock | 1800 - 3100 MHz | 2748 - 4056 MHz | 2748 - 4056 MHz | ||||||||||||||||||||||||||||||||||||||||
| L2 Cache | 12 MB | 4 MB | |||||||||||||||||||||||||||||||||||||||||
| L3 Cache | 16 MB | ||||||||||||||||||||||||||||||||||||||||||
| Cores / Threads | 6 / 6 | 8 / 8 4 x 4.1 GHz Apple M3 P-Core 4 x 2.7 GHz Apple M3 E-Core | 14 / 14 10 x 4.1 GHz Apple M3 P-Core 4 x 2.7 GHz Apple M3 E-Core | ||||||||||||||||||||||||||||||||||||||||
| Transistors | 11800 Million | 25000 Million | 92000 Million | ||||||||||||||||||||||||||||||||||||||||
| Technology | 5 nm | 3 nm | 3 nm | ||||||||||||||||||||||||||||||||||||||||
| Features | ARMv8 Instruction Set, Machine Learning Controller, 16-Core Neural Engine, Secure Enclave, Advanced Image Signal Processor | ARMv8 Instruction Set | ARMv8 Instruction Set | ||||||||||||||||||||||||||||||||||||||||
| iGPU | Apple A14 Bionic GPU | Apple M3 10-Core GPU | Apple M3 Max 30-Core GPU | ||||||||||||||||||||||||||||||||||||||||
| Architecture | ARM | ARM | ARM | ||||||||||||||||||||||||||||||||||||||||
| Announced | |||||||||||||||||||||||||||||||||||||||||||
| Series: M3 |
|
| |||||||||||||||||||||||||||||||||||||||||
| Manufacturer | www.apple.com | www.apple.com | |||||||||||||||||||||||||||||||||||||||||
| TDP | 78 Watt |

Benchmarks

Average Benchmarks Apple A14 Bionic → 100% n=4
Average Benchmarks Apple M3 → 194% n=4
Average Benchmarks Apple M3 Max 14-Core → 275% n=4
* Smaller numbers mean a higher performance
1 This benchmark is not used for the average calculation