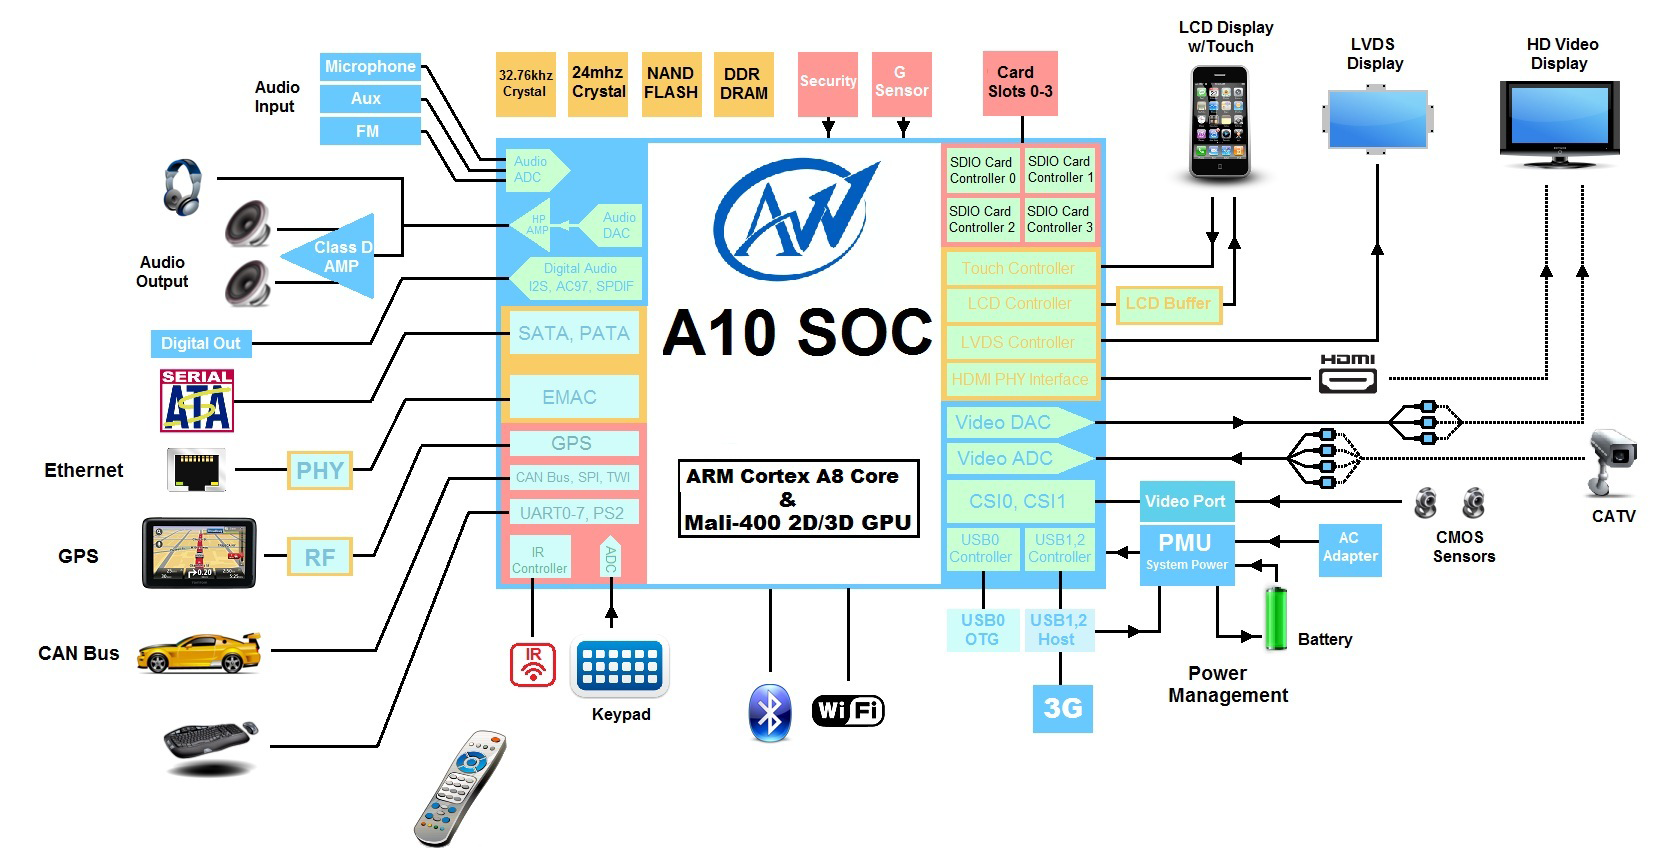
The AllWinner A13 is a cheap SoC for smartphones and tablets of 2012. Compared to the Allwinner A10, the A13 is acost reduced version without HDMI or SATA support. It contains a single 1.0 GHz ARM Cortex A8 core (ARMv7), a ARM Mali 400 (single core) graphics card and a video processing unit. It is produced in 55nm and mostly used for systems using Android or Linux.
The Apple M1 Max is a System on a Chip (SoC) from Apple that is found in the late 2021 MacBook Pro 14 and 16-inch models. It offers all 10 cores available in the chip divided in eight performance cores (P-cores with 600 - 3220 MHz) and two power-efficiency cores (E-cores with 600 - 2064 MHz). There is no Turbo Boost for single cores or short burst periods. The cores are similar to the cores in the Apple M1.
The big cores (codename Firestorm) offer 192 KB instruction cache, 128 KB data cache, and 24 MB shared L2 cache (up from 12 MB in the M1). The four efficiency cores (codename Icestorm) are a lot smaller and offer only 128 KB instruction cache, 64 KB data cache, and 4 MB shared cache. CPU and GPU can both use the 48 MB SLC (System Level Cache). The efficiency cores (E cluster) clock with 600 - 2064 MHz, the performance cores (P cluster) with 600 - 3228 MHz.
The unified memory (32 or 64 GB LPDDR5-6400) next to the chip is connected by a 512 bit memory controller (200 GB/s bandwidth) and can be used by the GPU and CPU. This is the main difference to the M1 Pro and the CPU performance is quite similar.
The biggest difference to the M1 Pro is the bigger integrated GPU with 24 or 32 cores (up from 16).
Furthermore, the SoC integrates a fast 16 core neural engine, a secure enclave (e.g., for encryption), a unified memory architecture, Thunderbolt 4 controller, an ISP, and media de- and encoders (including two ProRes engines).
The M1 Pro is manufactured in 5 nm at TSMC and integrates 57 billion transistors. The peak power consumption of the chip was advertised around 30W for CPU intensive tasks.
The Apple M2 Pro 10-Core is a System on a Chip (SoC) from Apple that is found in the early 2023 MacBook Pro 14 and Mac Mini entry level models. It offers 10 of the 12 cores available in the chip divided in six performance cores (P-cores) and four power-efficiency cores (E-cores). The E-cores clock with up to 3.4 GHz, the P-Cores up to 3.7 GHz (mostly 3.3 GHz in multi-threaded workloads and 3.4 GHz in single threaded).
The big cores (codename Avalanche) offer 192 KB instruction cache, 128 KB data cache, and 36 MB shared L2 cache (up from 24 MB in the M1 Pro). The four efficiency cores (codename Blizzard) are a lot smaller and offer only 128 KB instruction cache, 64 KB data cache, and 4 MB shared cache. CPU and GPU can both use the 24 MB SLC (System Level Cache).
The unified memory (16 or 32 GB LPDDR5-6400) next to the chip is connected by a 256 Bit memory controller (200 GB/s bandwidth) and can be used by the GPU and CPU.
The performance of the M2 Pro 10-Core should be similar to the old M1 Pro with all 10 cores. The multi-threaded performance should be slower, as the M2 10-core has two p-cores less (and 2 e-cores more) but the single-threaded performance should be better due to the faster clock speed and architectural improvements. The old M1 Pro 8-core should be noticeably slower.
The integrated graphics card in the M1 Pro 10-core offers all 16 of the 19 cores.
Furthermore, the SoC integrates a fast 16 core neural engine (faster than M1 Pro), a secure enclave (e.g., for encryption), a unified memory architecture, Thunderbolt 4 controller, an ISP, and media de- and encoders (including ProRes).
The M2 Pro is manufactured in 5 nm at TSMC (second generation) and integrates 40 billion transistors.
- Range of benchmark values for this graphics card - Average benchmark values for this graphics card * Smaller numbers mean a higher performance 1 This benchmark is not used for the average calculation
v1.27
log 17. 20:19:23
#0 checking url part for id 3713 +0s ... 0s
#1 checking url part for id 13843 +0s ... 0s
#2 checking url part for id 14977 +0s ... 0s
#3 not redirecting to Ajax server +0s ... 0s
#4 did not recreate cache, as it is less than 5 days old! Created at Sun, 16 Jun 2024 05:37:17 +0200 +0.001s ... 0.001s
#5 composed specs +0.047s ... 0.048s
#6 did output specs +0s ... 0.048s
#7 getting avg benchmarks for device 3713 +0.003s ... 0.051s
#8 got single benchmarks 3713 +0.006s ... 0.057s
#9 getting avg benchmarks for device 13843 +0.003s ... 0.06s
#10 got single benchmarks 13843 +0.009s ... 0.068s
#11 getting avg benchmarks for device 14977 +0.003s ... 0.071s
#12 got single benchmarks 14977 +0.007s ... 0.078s
#13 got avg benchmarks for devices +0s ... 0.078s
#14 min, max, avg, median took s +0.108s ... 0.186s
 Deutsch
 English
 Español
 Français
 Italiano
 Nederlands
 Polski
 Português
 Русский
 Türkçe
 Svenska
 Chinese
 Magyar