Notebookcheck Logo

Qualcomm Snapdragon 400 MSM8928 vs MediaTek Helio X27 MT6797X

Qualcomm Snapdragon 400 MSM8928

► remove from comparison Qualcomm 400 MSM8928

The Qualcomm Snapdragon 400 MSM8928 is an entry-level ARM-SoC for Android smartphones and tablets. It offers four Cortex-A7 cores clocked at up to 1.6 GHz (Quad-Core) as well as an Adreno 305 graphics card. Furthermore, a HSPA+/LTE radio is integrated in the SoC, which is manufactured in a 28-nanometer LP process.

MediaTek Helio X27 MT6797X

► remove from comparison Mediatek MT6797X

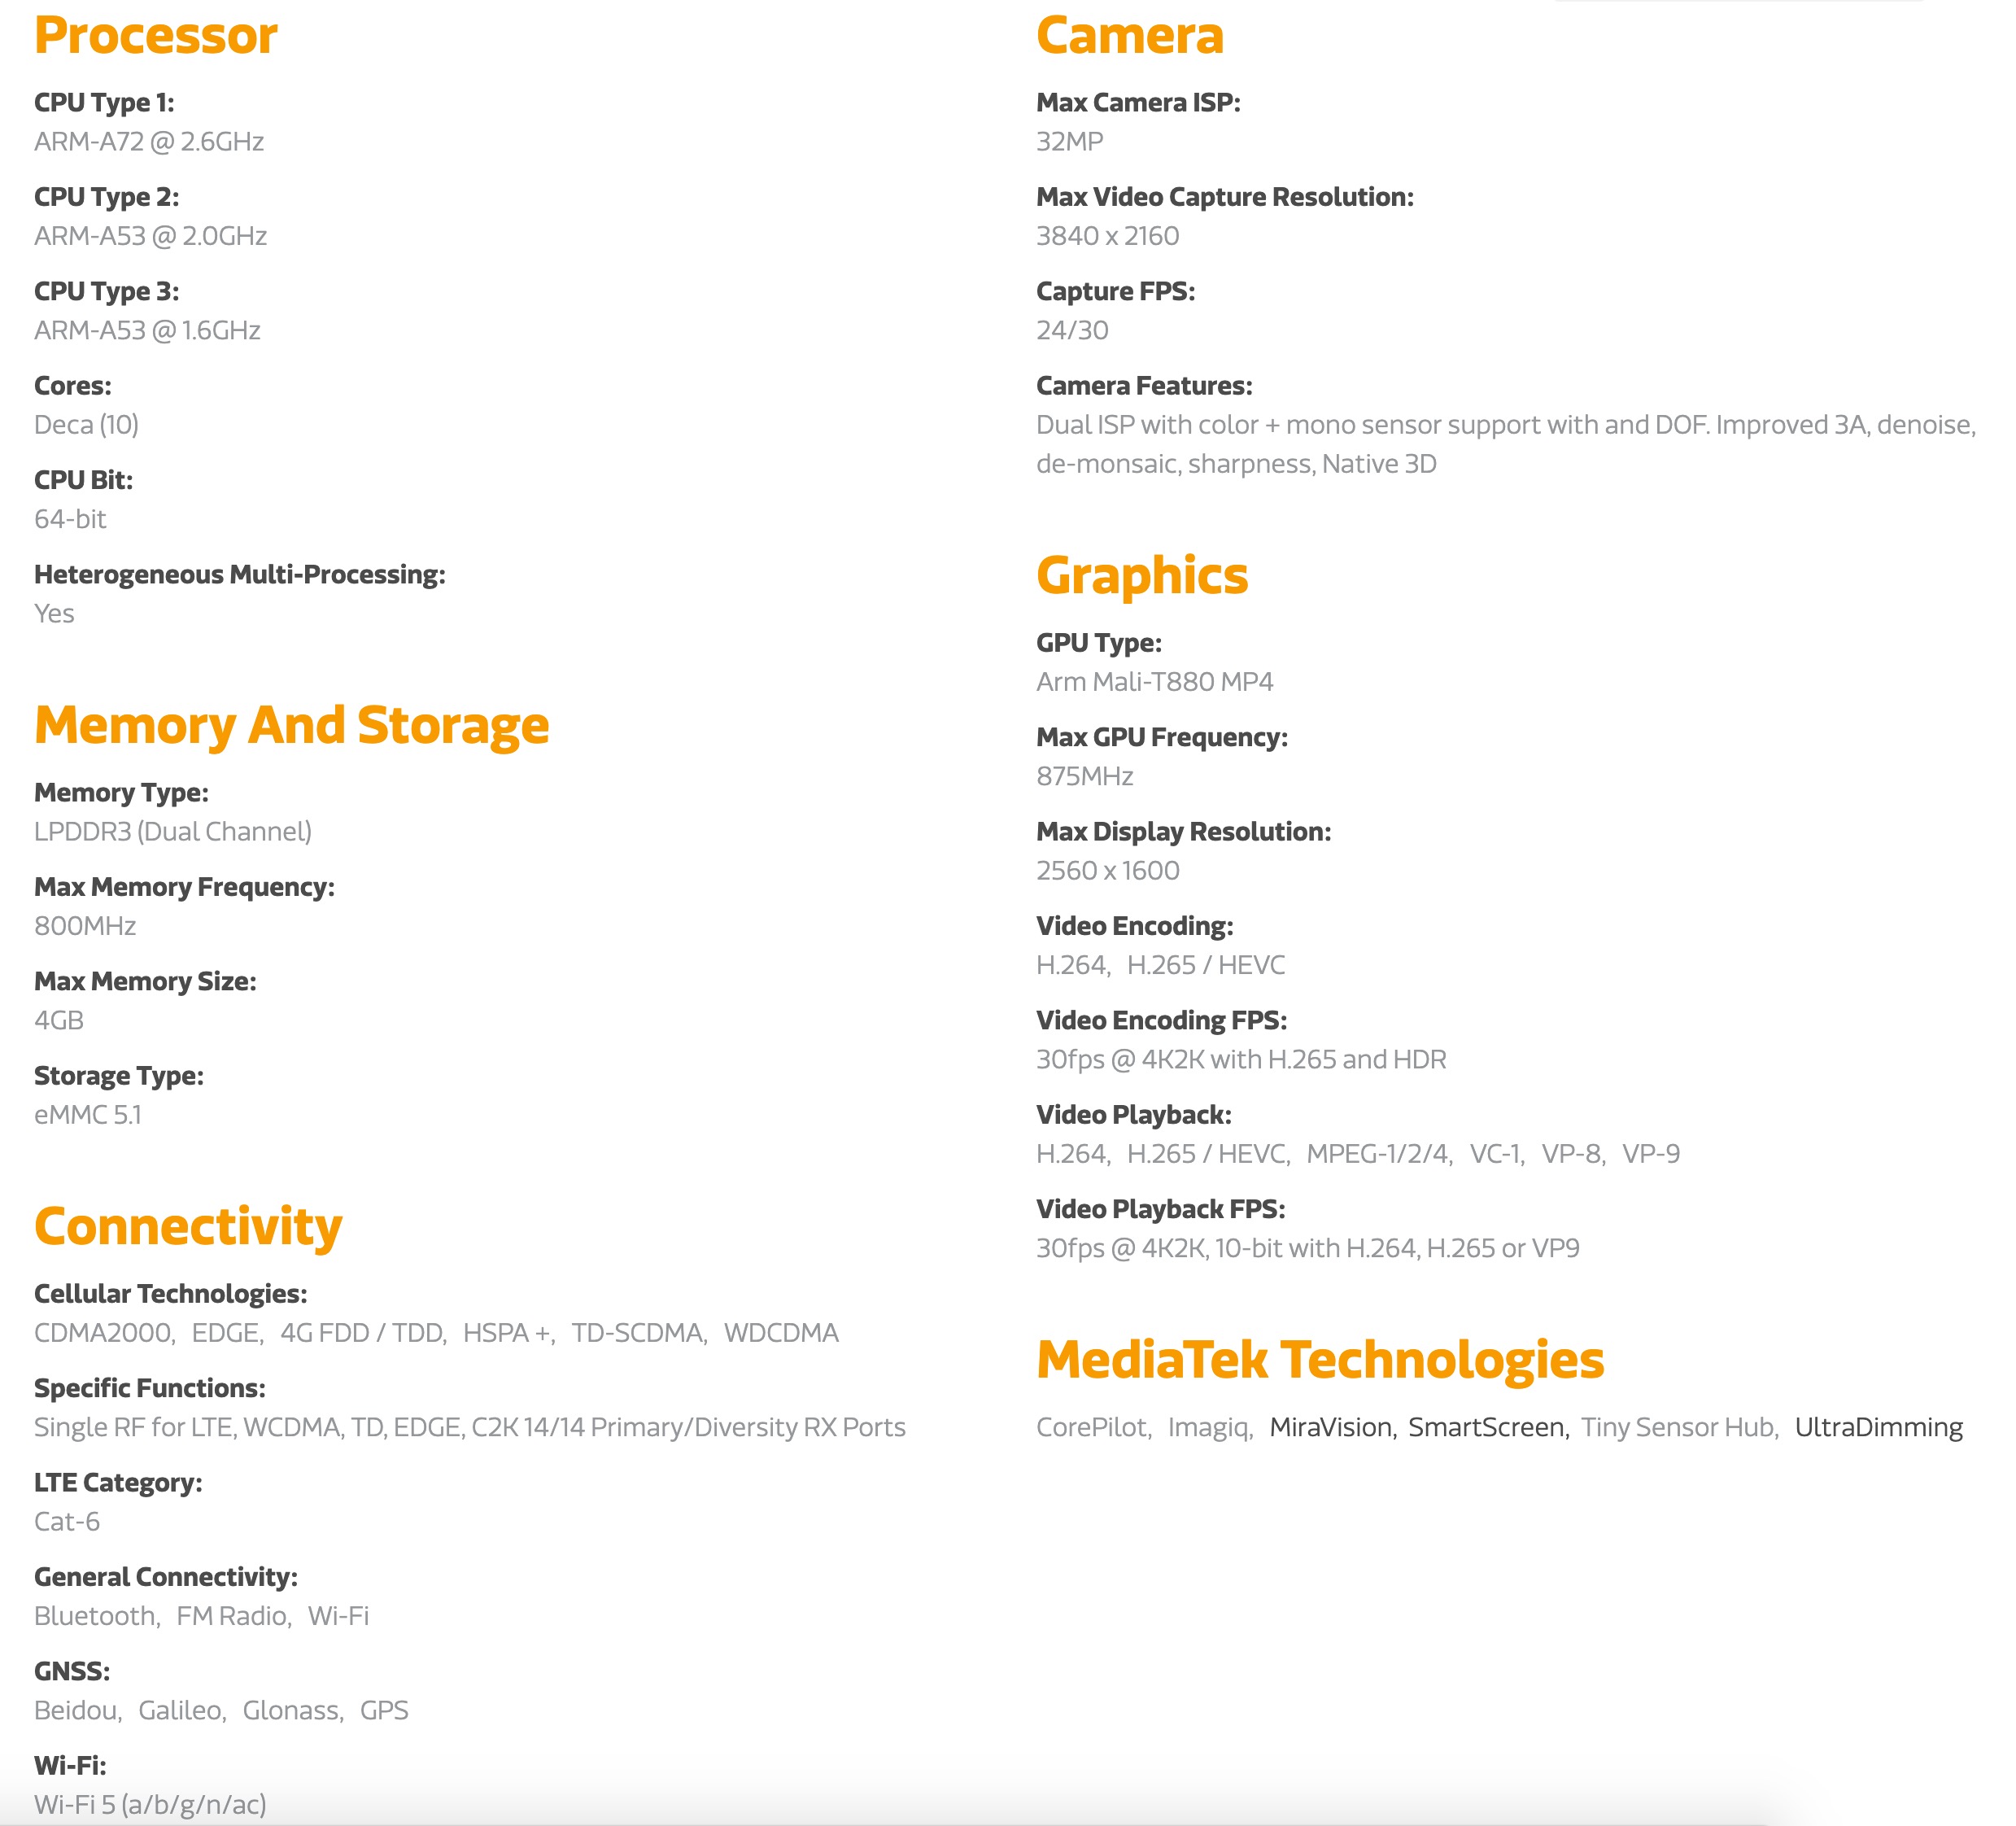
The Mediatek Helio X27 MT6797X is an upper mainstream ARM SoC for smartphones (mainly Android based). It is manufactured in a 20 nm process and is equipped with 10 CPU cores. Two fast Cortex-A72 cores are running at up to 2.6 GHz (performance), four Cortex-A53 cores at up to 2 GHz (balanced) and four Cortex-A53 cores at up to 1.6 GHz (efficiency). All cores support 64-bit and the utilization of three clusters is supposed to improve efficiency according to Mediatek. The two A72 cores are only designed for short "Burst-Performance scenarios" according to Mediatek and are probably not used for sustained workloads. Compared to the similar named MT6797, the MT6797X was introduced later and offers higher clock speeds for CPU and GPU.

The integrated ARM Mali T880 MP4 (according to Wikipedia) GPU is clocked at up to 875 MHz and has four cluster (from 16) from the Midgard (4th Gen) architecture.

The chip also includes an LTE modem (Cat. 6 300/50 Mbps, DC-HSPA+, TD-SCDMA, EDGE, CDMA2000, ...) as well as a WLAN 802.11ac (280 Mbps) modem. GPS/Glonass/BeiDou is supported for location. The integrated video encoder can handle up to 4Kx2K H.265 at 30 fps and HDR. The SoC can also decode H.265, H.264 and VP9 in 4K30. 

Power Consumption

The processor is manufactured in a 20 nm process at TSMC and should have an average power consumption under load.

ModelQualcomm Snapdragon 400 MSM8928MediaTek Helio X27 MT6797X
SeriesQualcomm SnapdragonMediatek Mediatek Helio 20
CodenameARMv7
Series: Snapdragon ARMv7
Qualcomm Snapdragon S4 Pro APQ8064A compare1.5 GHz4 / 4 cores ARMv7
Qualcomm Snapdragon 400 MSM8928 « 1.6 GHz4 / 4 cores ARMv7
Qualcomm Snapdragon 400 APQ8028 compare1.6 GHz4 / 4 cores ARMv7
Qualcomm Snapdragon S4 Pro MSM8960T compare1.7 GHz2 / 2 cores ARMv7
Qualcomm Snapdragon 400 8930AB compare1.7 GHz2 / 2 cores ARMv7
Qualcomm Snapdragon S4 Plus APQ8060A compare1.5 GHz2 / 2 cores ARMv7
Qualcomm Snapdragon S4 Plus MSM8960 compare1.5 GHz2 / 2 cores ARMv7
Qualcomm Snapdragon S4 Plus MSM8260A compare1.7 GHz2 / 2 cores ARMv7
Qualcomm Snapdragon 400 MSM8926 compare1.2 GHz4 / 4 cores ARMv7
Qualcomm Snapdragon 400 MSM8226 compare1.2 GHz4 / 4 cores ARMv7
Qualcomm Snapdragon 400 APQ8026 compare1.2 GHz4 / 4 cores ARMv7
Qualcomm Snapdragon S4 Plus MSM8930 compare1.2 GHz2 / 2 cores ARMv7
Qualcomm Snapdragon S4 Plus MSM8230 compare1.2 GHz2 / 2 cores ARMv7
Qualcomm Snapdragon S4 Plus MSM8227 compare1 GHz2 / 2 cores ARMv7
Qualcomm Snapdragon S3 MSM8660 compare1.7 GHz2 / 2 cores ARMv7
Qualcomm Snapdragon S3 MSM8260 compare1.5 GHz2 / 2 cores ARMv7
Qualcomm Snapdragon S1 QSD8250 compare1 GHz1 / 1 cores ARMv7
Clock1600 MHz2600 MHz
Cores / Threads4 / 410 / 10
Technology28 nm
FeaturesAdreno 305 GPU, LPDDR2/3 Memory Controller, GSM/UMTS/WCDMA/LTE2x Cortex-A72 2.6 GHz (Performance), 4x Cortex-A53 2 GHz (Balance), 4x Cortex-A53 1.6 GHz (Efficiency)
iGPUQualcomm Adreno 305ARM Mali-T880 MP4 ( - 875 MHz)
ArchitectureARMARM
Announced
Manufacturerwww.qualcomm.comwww.mediatek.com

Benchmarks

3DMark - 3DMark Ice Storm Physics
min: 7756     avg: 8177     median: 8177 (7%)     max: 8598 Points
8427 Points (7%)
3DMark - 3DMark Ice Storm Extreme Physics
min: 7704     avg: 8386     median: 8696 (7%)     max: 8759 Points
8496 Points (7%)
3DMark - 3DMark Ice Storm Unlimited Physics
min: 7913     avg: 8927     median: 9016 (8%)     max: 9761 Points
min: 9771     avg: 10915     median: 10713 (9%)     max: 12462 Points
3DMark - 3DMark Sling Shot Extreme (ES 3.1) Unlimited Physics
100%
1 MT6797X +
min: 1372     avg: 1626     median: 1702 (20%)     max: 1804 Points
3DMark - 3DMark Sling Shot (ES 3.0) Unlimited Physics
785 Points (9%)
min: 1547     avg: 1709     median: 1709 (20%)     max: 1871 Points
Geekbench 4.4 - Geekbench 4.1 - 4.4 64 Bit Single-Core
100%
1 MT6797X +
min: 1352     avg: 1632     median: 1690 (17%)     max: 1797 Points
Geekbench 4.4 - Geekbench 4.1 - 4.4 64 Bit Multi-Core
100%
1 MT6797X +
min: 3590     avg: 4554     median: 4781.5 (5%)     max: 5064 Points
Geekbench 4.0 - Geekbench 4.0 64 Bit Single-Core
441 Points (6%)
Geekbench 4.0 - Geekbench 4.0 64 Bit Multi-Core
1100 Points (3%)
Geekbench 3 - Geekbench 3 32 Bit Multi-Core
min: 1109     avg: 1309     median: 1338 (2%)     max: 1451 Points
Geekbench 3 - Geekbench 3 32 Bit Single-Core
min: 338     avg: 393.3     median: 398.5 (8%)     max: 438 Points
Linpack Android / IOS - Linpack Multi Thread
min: 150.1     avg: 221.7     median: 249.9 (8%)     max: 265 MFLOPS
Linpack Android / IOS - Linpack Single Thread
min: 67.9     avg: 87.9     median: 97.7 (10%)     max: 98 MFLOPS
Mozilla Kraken 1.1 - Kraken 1.1 Total Score *
min: 12714     avg: 14100     median: 13858 (16%)     max: 15968 ms
min: 4261     avg: 7150     median: 7244 (8%)     max: 9851 ms
Sunspider - Sunspider 1.0 Total Score *
min: 1207     avg: 1429     median: 1404.5 (15%)     max: 1701 ms
Sunspider - Sunspider 0.9.1 Total Score *
1529 ms (14%)
Octane V2 - Octane V2 Total Score
min: 1894     avg: 2330     median: 2335 (2%)     max: 2755 Points
min: 5909     avg: 6943     median: 6031.5 (5%)     max: 9798 Points
WebXPRT 3 - WebXPRT 3 Score
0 Points (0%)
Vellamo 3.x - Vellamo 3.x Metal
771 Points (21%)
Vellamo 3.x - Vellamo 3.x Multicore Beta
1248 Points (28%)
Vellamo 3.x - Vellamo 3.x Browser
1881 Points (25%)
Quadrant Standard Edition 2.0 - Quadrant Standard 2.0 Total Score
min: 9699     avg: 9949     median: 9948.5 (23%)     max: 10198 points
AnTuTu v4 - AnTuTu v4 Total Score
17354 Points (40%)
AnTuTu v5 - AnTuTu v5 Total Score
19444 Points (20%)
AnTuTu v6 - AnTuTu v6 Total Score
24799 Points (8%)
75939 Points (26%)
AnTuTu v7 - AnTuTu v7 MEM
100%
1 MT6797X +
min: 5405     avg: 6054     median: 6097.5 (19%)     max: 6616 Points
AnTuTu v7 - AnTuTu v7 UX
100%
1 MT6797X +
min: 23733     avg: 25991     median: 26498.5 (33%)     max: 27232 Points
AnTuTu v7 - AnTuTu v7 GPU
100%
1 MT6797X +
min: 26786     avg: 27756     median: 27779 (9%)     max: 28680 Points
AnTuTu v7 - AnTuTu v7 CPU
100%
1 MT6797X +
min: 44590     avg: 48162     median: 49155 (30%)     max: 49746 Points
AnTuTu v7 - AnTuTu v7 Total Score
100%
1 MT6797X +
min: 105872     avg: 107962     median: 107561 (19%)     max: 110854 Points
AndEBench - AndEBench Java
min: 290     avg: 341     median: 341 (10%)     max: 392 Iter./s
AndEBench - AndEBench Native
min: 5540     avg: 6590     median: 6590 (22%)     max: 7640 Iter./s
PassMark PerformanceTest Mobile V1 - PerformanceTest Mobile V1 CPU Tests
min: 7044     avg: 7929     median: 7929 (1%)     max: 8814 Points
159874 Points (21%)
PCMark for Android - PCM f. Android Work Score
2383 Points (12%)
min: 4922     avg: 5353     median: 5252 (26%)     max: 5984 Points
PCMark for Android - PCM f. Android Computer Vision
100%
1 MT6797X +
2807 Points (15%)
PCMark for Android - PCM f. Android Storage
100%
1 MT6797X +
2598 Points (6%)
PCMark for Android - PCM f. Android Work Score 2.0
100%
1 MT6797X +
min: 4077     avg: 4427     median: 4467 (29%)     max: 4695 Points

Average Benchmarks Qualcomm Snapdragon 400 MSM8928 → 100% n=6

Average Benchmarks MediaTek Helio X27 MT6797X → 451% n=6

- Range of benchmark values for this graphics card
- Average benchmark values for this graphics card
* Smaller numbers mean a higher performance
1 This benchmark is not used for the average calculation

Add one or more devices and compare

In the following list you can select (and also search for) devices that should be added to the comparison. You can select more than one device.

restrict list:

show all (including archived), 2024, 2023
v1.26
log 05. 05:32:15

#0 checking url part for id 6034 +0s ... 0s

#1 checking url part for id 10102 +0s ... 0s

#2 not redirecting to Ajax server +0s ... 0s

#3 did not recreate cache, as it is less than 5 days old! Created at Sat, 04 May 2024 05:40:37 +0200 +0.001s ... 0.001s

#4 composed specs +0.025s ... 0.026s

#5 did output specs +0s ... 0.026s

#6 getting avg benchmarks for device 6034 +0.003s ... 0.029s

#7 got single benchmarks 6034 +0.022s ... 0.05s

#8 getting avg benchmarks for device 10102 +0.003s ... 0.054s

#9 got single benchmarks 10102 +0.014s ... 0.068s

#10 got avg benchmarks for devices +0s ... 0.068s

#11 No cached benchmark found, getting uncached values +0.063s ... 0.131s

#12 No cached benchmark found, getting uncached values +0.018s ... 0.15s

#13 No cached benchmark found, getting uncached values +0.002s ... 0.152s

#14 No cached benchmark found, getting uncached values +0.034s ... 0.186s

#15 No cached benchmark found, getting uncached values +0.012s ... 0.198s

#16 No cached benchmark found, getting uncached values +0.021s ... 0.219s

#17 min, max, avg, median took s +0.009s ... 0.228s

#18 return log +0.03s ... 0.258s

Please share our article, every link counts!
> Expert Reviews and News on Laptops, Smartphones and Tech Innovations > Benchmarks / Tech > Processor Comparison - Head 2 Head
Redaktion, 2017-09- 8 (Update: 2023-07- 1)