 Deutsch
 English
 Español
 Français
 Italiano
 Nederlands
 Polski
 Português
 Русский
 Türkçe
 Svenska
 Chinese
 Magyar
Face Off: Apple MacBook 12 Core m3, Core m5, and Core m7

For the original German article, see here.
We reviewed the current MacBook 12 (Early 2016) from Apple in April of this year. It was equipped with the smallest available processor, the Intel Core m3-6Y30 with a clocking speed of between 1.1 and 1.2 GHz. The performance was sufficient for everyday office tasks, but the small notebook quickly started to struggle with more demanding tasks. The two optional Core m5 and Core m7 processors could help in this case. Their base clocks are just slightly higher (1.2 and 1.3 GHz, respectively), but the difference is more significant when we look at the Turbo clocks. The Core m5 can reach up to 2.7 GHz and the Core m7 even up to 3.1 GHz. The MacBook could therefore be able to compete with regular ULV chips for a limited amount of time. Another interesting aspect is how long you will be able to use the additional performance since the devices are cooled passively.
We want to thank the online shop Notebooksbilliger.de, which provided two MacBooks for this comparison. The differences are limited to the processor and the storage equipment, so we will not cover the sections Case, Connectivity, Display, and Speakers in this article. The corresponding information is available in our two reviews for the 2016 MacBook as well as the 2015 MacBook.
We start with an overview of our test models:
| Apple MacBook 12 Core m3 | Apple MacBook 12 Core m5 | Apple MacBook 12 Core m7 | |
| Processor | Intel Core m3-6Y30 | Intel Core m5-6Y54 | Intel Core m7-6Y75 |
| max. Turbo Boost (Single/Multi) | 2.2/2.0 GHz | 2.7/2.4 GHz | 3.1/2.7 GHz |
| RAM | 8 GB DDR3L | 8 GB DDR3L | 8 GB DDR3L |
| Graphics Card | Intel HD Graphics 515 (up to 850 MHz) | Intel HD Graphics 515 (up to 900 MHz) | Intel HD Graphics 515 (up to 1000 MHz) |
| SSD | 256 GB NVMe | 512 GB NVMe | 256 GB NVMe |
| Display | 12-inch, 2304 x 1440 pixels | 12-inch, 2304 x 1440 pixels | 12-inch, 2304 x 1440 pixels |
| Prices at Apple | 1,449 Euros | 1,799 Euros | - |
| Current street price | ~1,300 Euros | ~1,550 Euros | ~1,600 Euros |
We can see that there are not many differences. Except for the processor, users can only influence the storage capacity of the NVMe-SSD (256 or 512 GB), although the smaller Core m3 is only available in combination with the 256 GB SSD. Every MacBook 12 is shipped with 8 GB DDR3L-RAM, Intel's HD Graphics 515 as well as the 12-inch display with a resolution of 2304x1440 pixels.
A pretty interesting aspect is the current pricing, because the notebooks are much cheaper in online stores compared to Apple’s stores. The small price difference between the two more powerful SKUs (Core m5/512 GB and Core m7/256 GB) is also interesting.
Performance
As we have already mentioned in the review of the MacBook 12 with the Core m3 the performance is easily sufficient for everyday tasks and subjectively, you always have a responsive system thanks to the fast SSD. Only more demanding tasks such as video editing will result in performance drops. The reason is the passive cooling of the system and therefore, the temperature is a limiting factor.
Another limiting factor is usually the consumption, which is typically specified at 4.5 watts for the Core m chips and can be increased up to 7.5 watts by the manufacturer. Apple ignores these values though and lets the chips consume as much as they want, which can result in up to 13 watts for the Core m7 (2x 2.7 GHz). The question is how long this performance level can be maintained.
All three available processors are dual-cores with Hyperthreading and can therefore execute up to four threads simultaneously. The chips differ only in terms of clocks, but the features are identical. As with the faster ULV chips, however, the vPro support is reserved for the Core m7.
Single-Core Performance
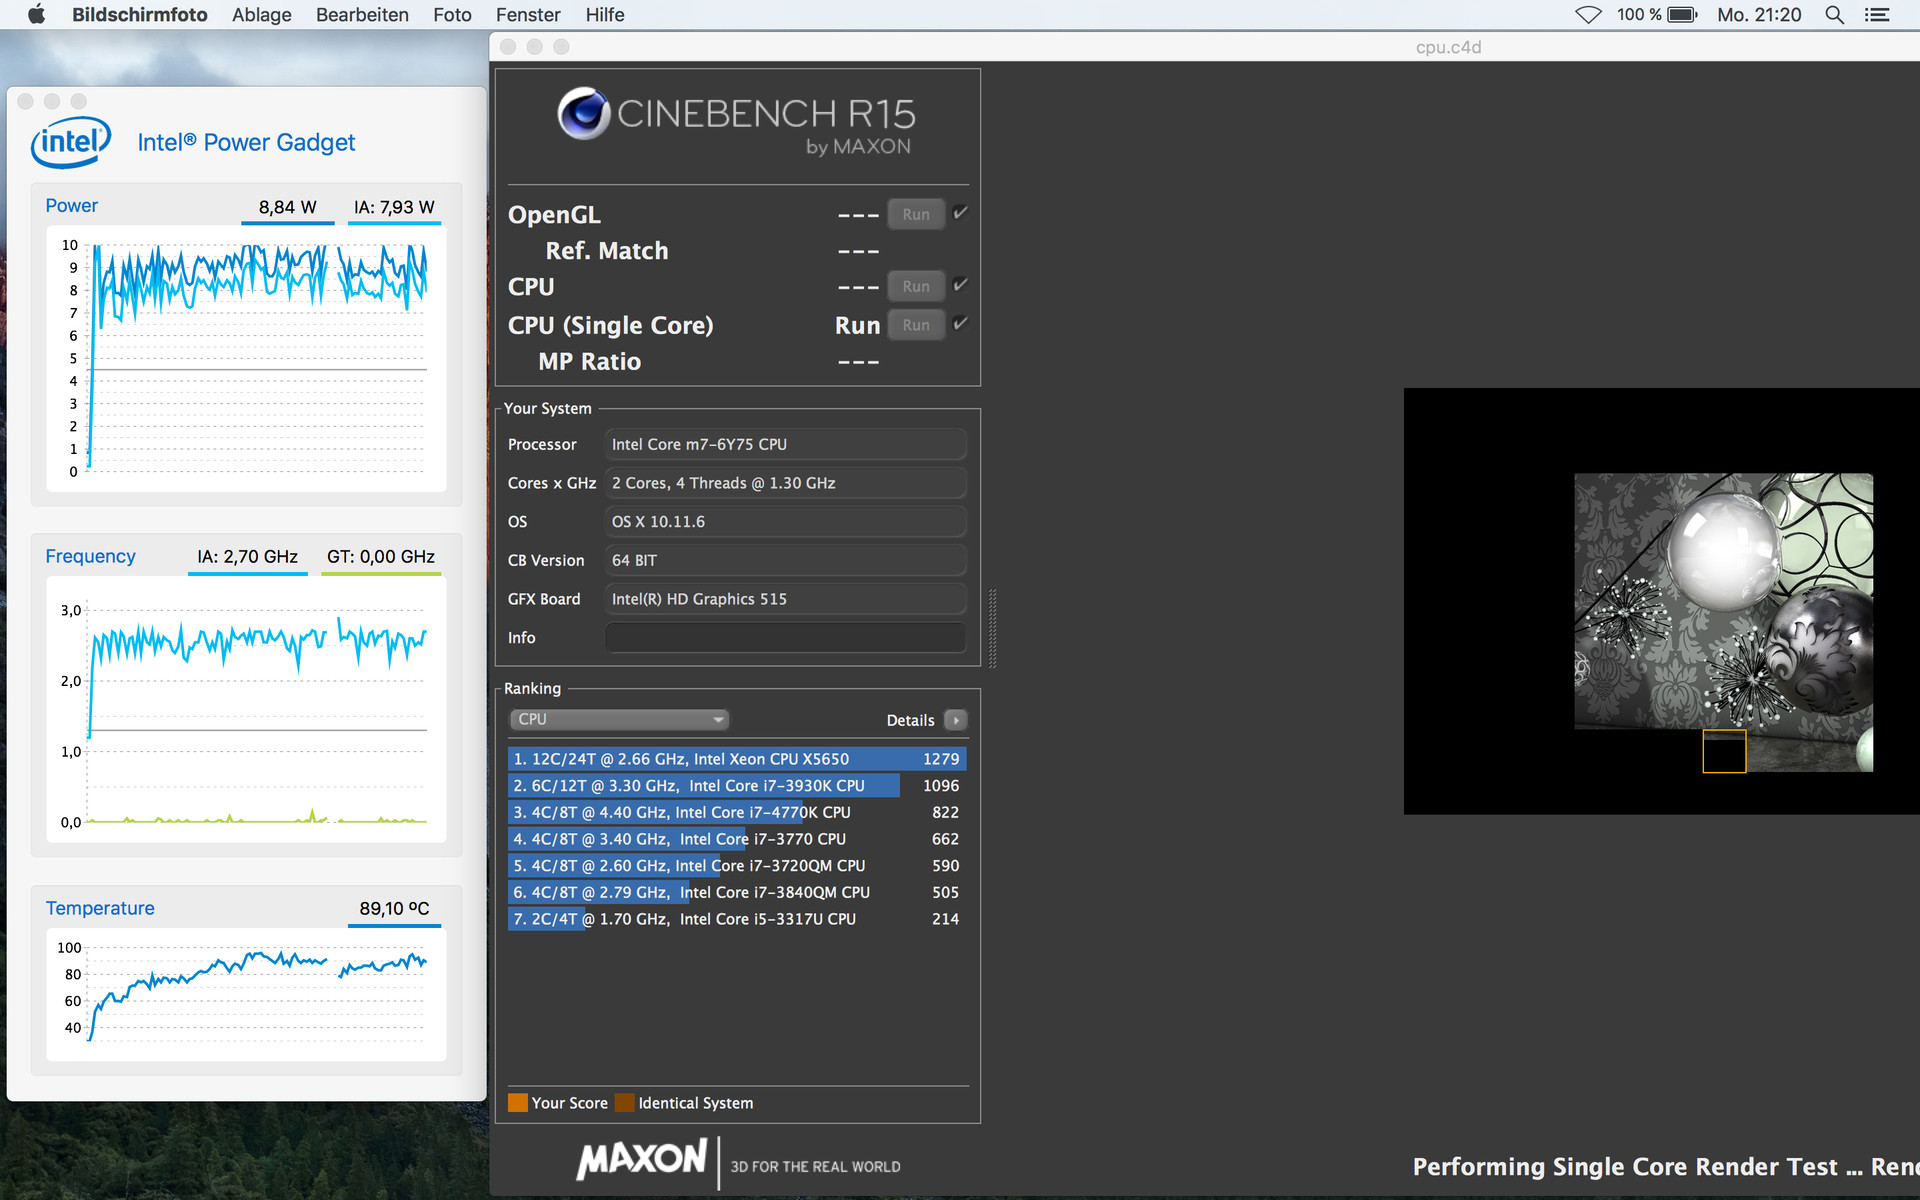
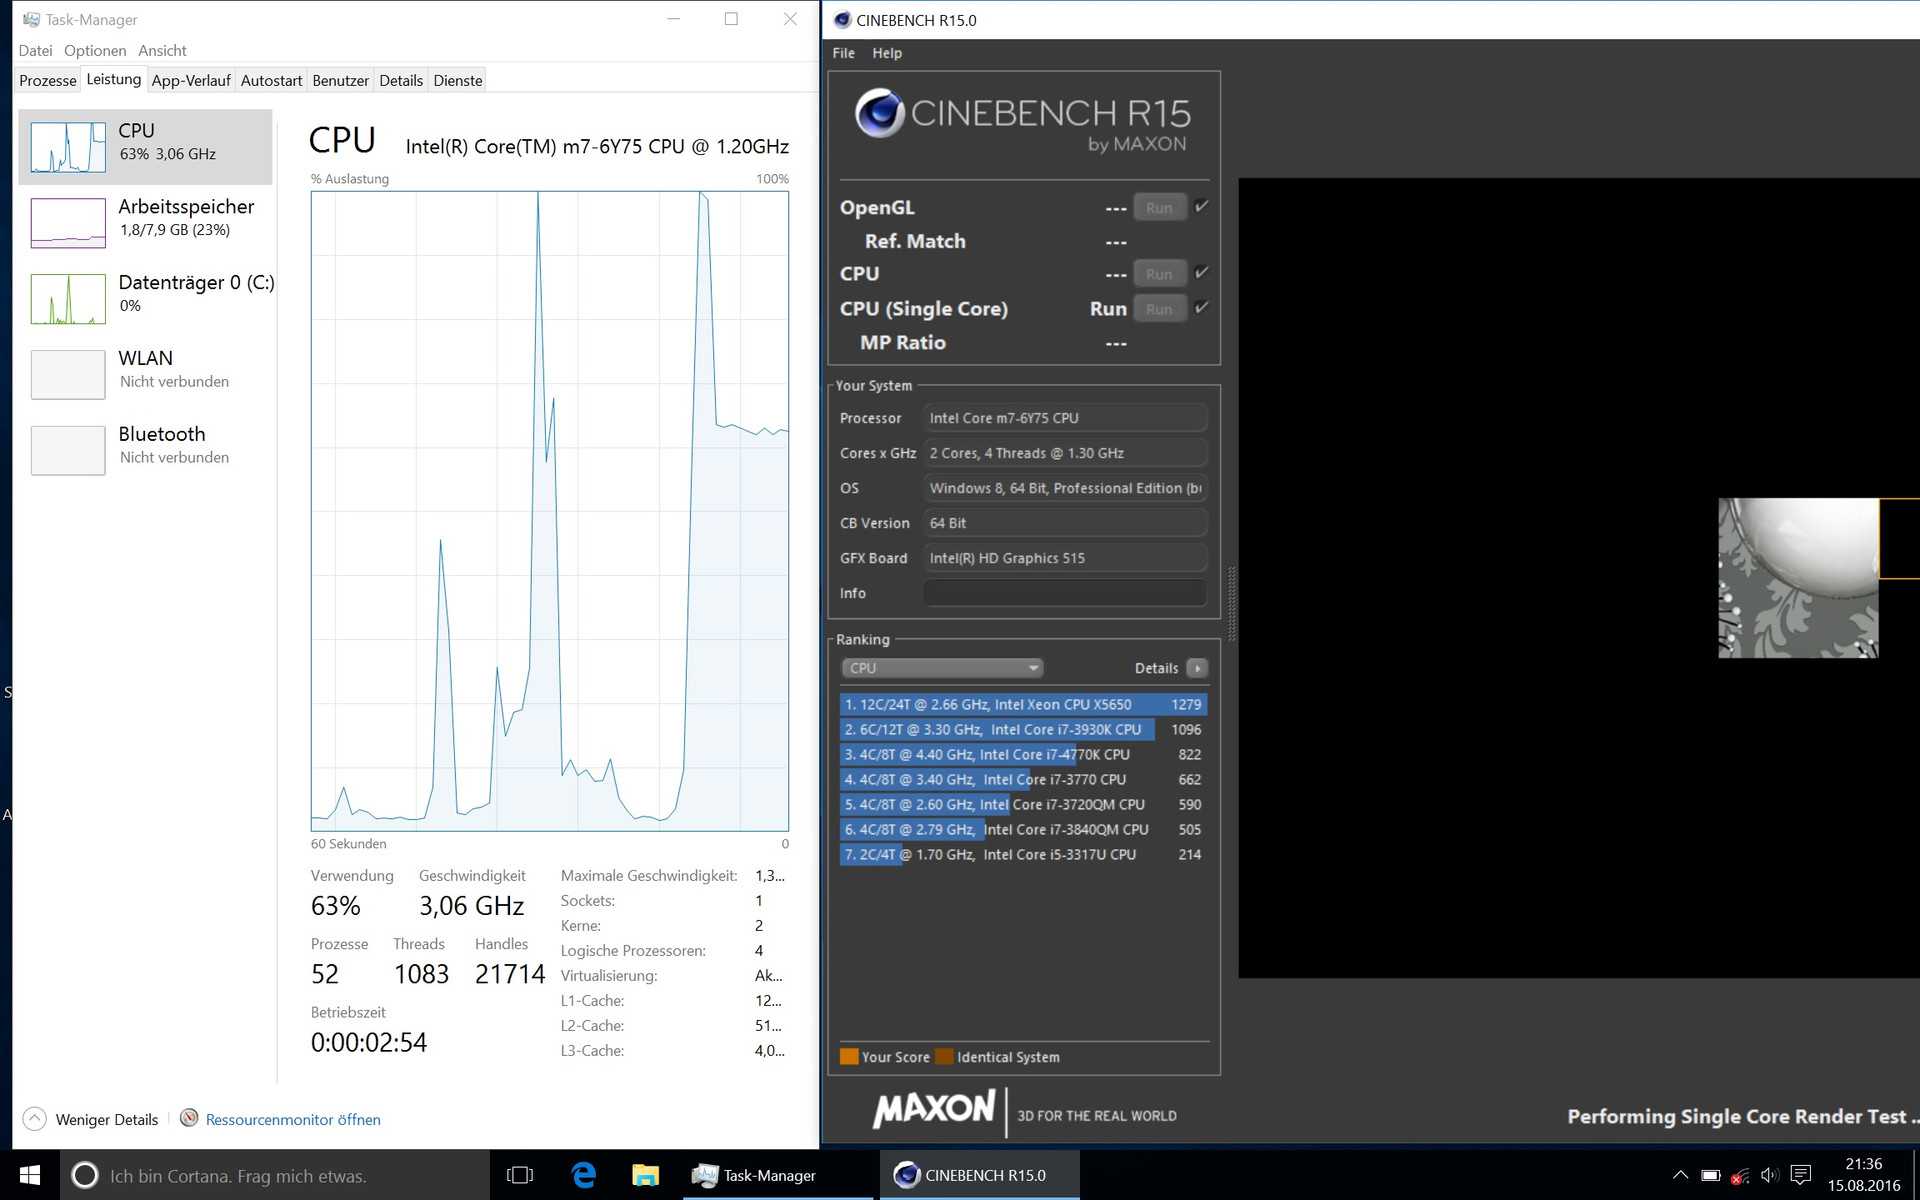
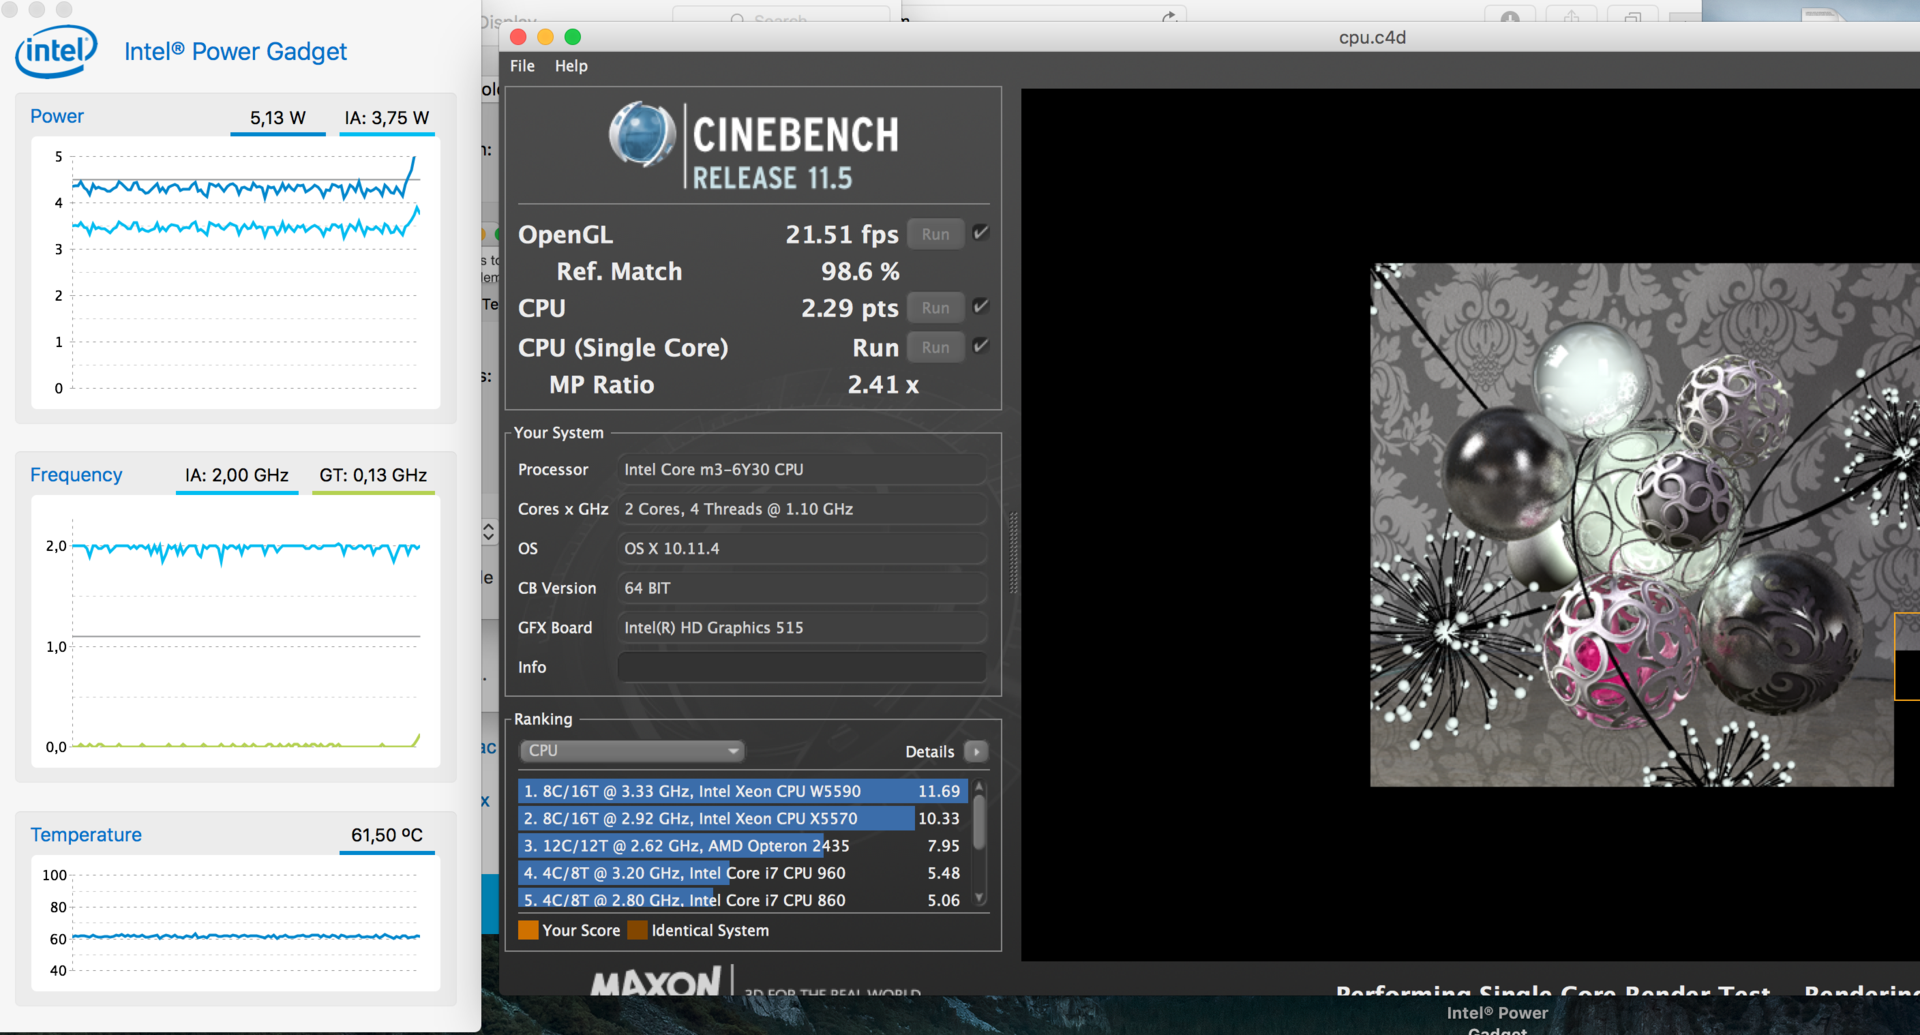
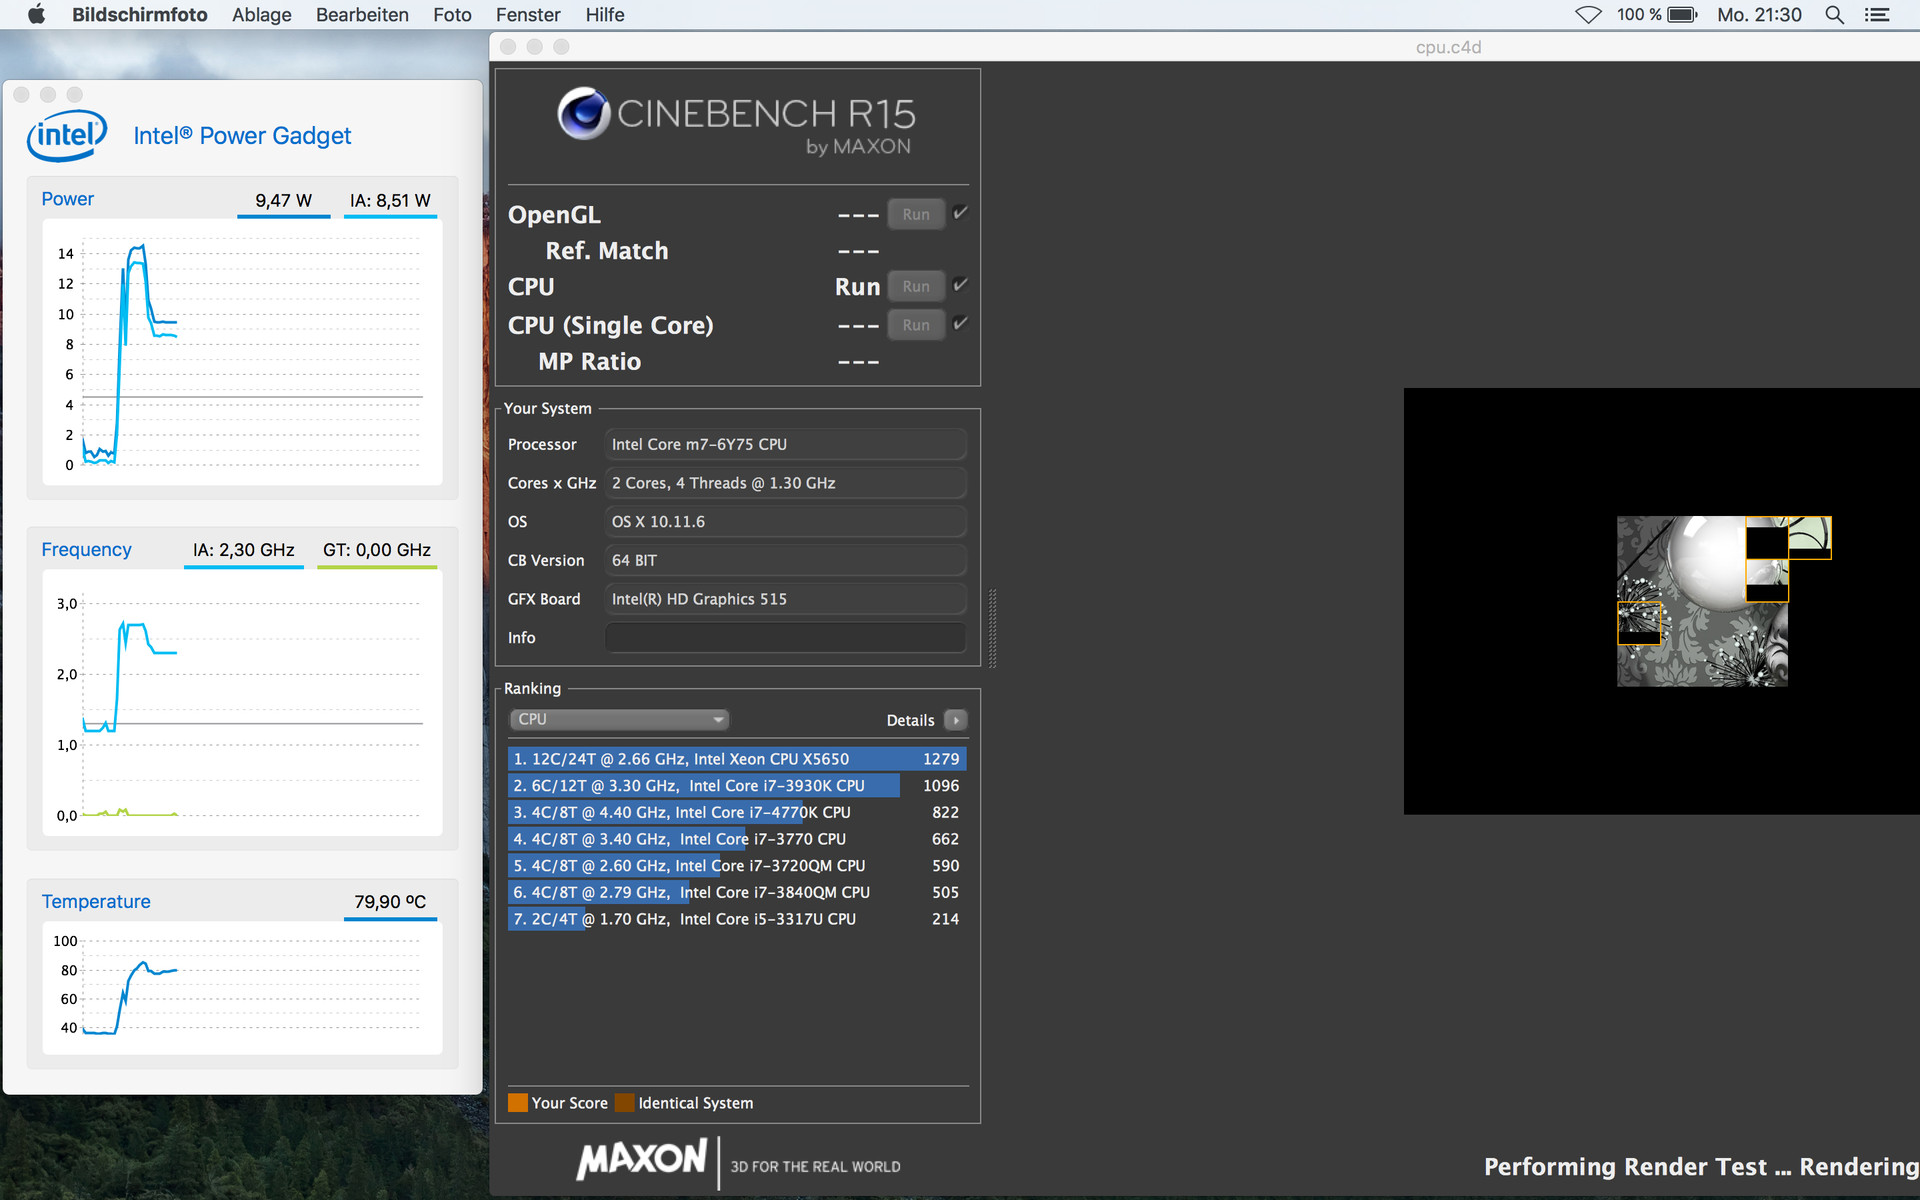
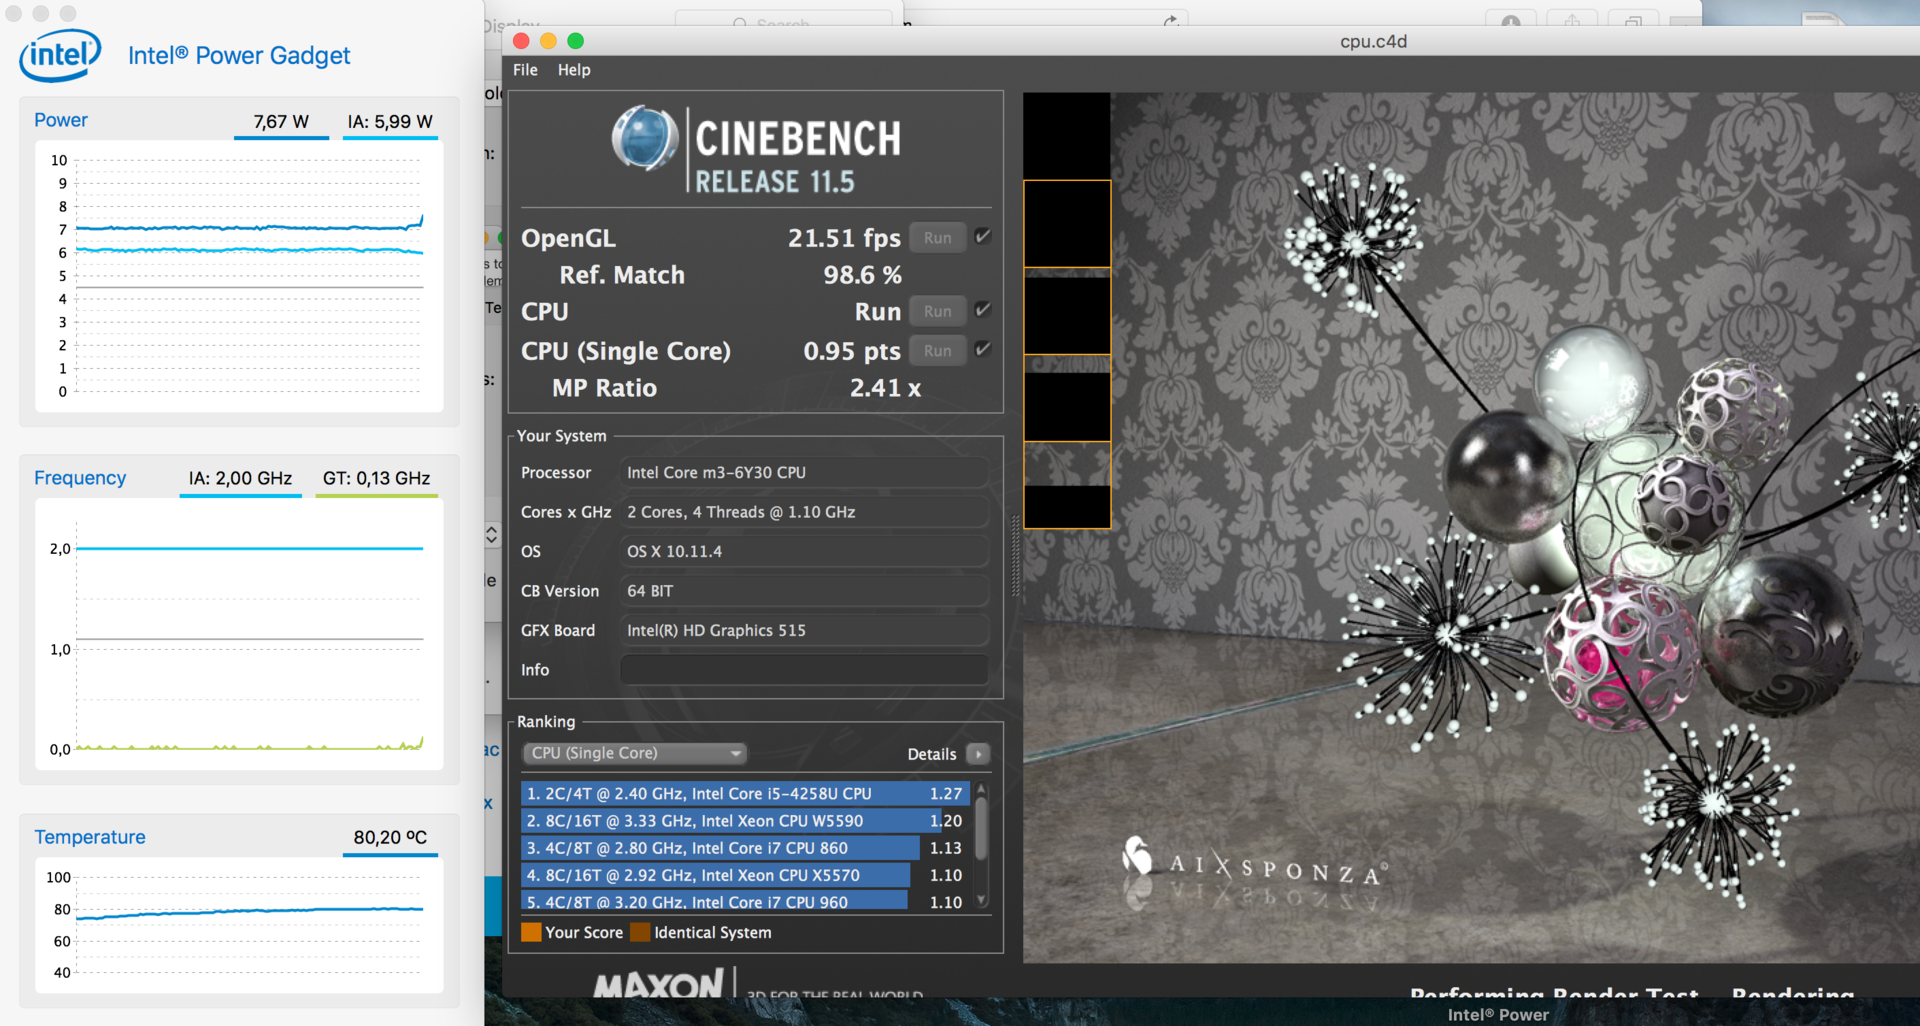
We start with the processor performance when we stress only one core. The Core m7 should have a big advantage in theory, because it reaches up to 3.1 GHz via Turbo Boost. We cannot see this value under OS X though and the clock will level off between 2.5 and 2.8 GHz in the Cinebench R15 Single test. The temperature quickly climbs to 96 °C (~205 °F) and then stabilizes at around 88 to 94 °C (~190 to 201 °F). After a few minutes, the clock will drop further to between 2.3 and 2.6 GHz. Under Window, the Turbo utilization initially is better and we can see up to 3.06 GHz, but it will drop to around 2.6 to 2.8 GHz after about 20 seconds and then further down to 1.9 GHz over the course of the test. This means that the OS X result is slightly better (110 vs. 104 points), but the chip still cannot utilize its full potential due to the temperatures.
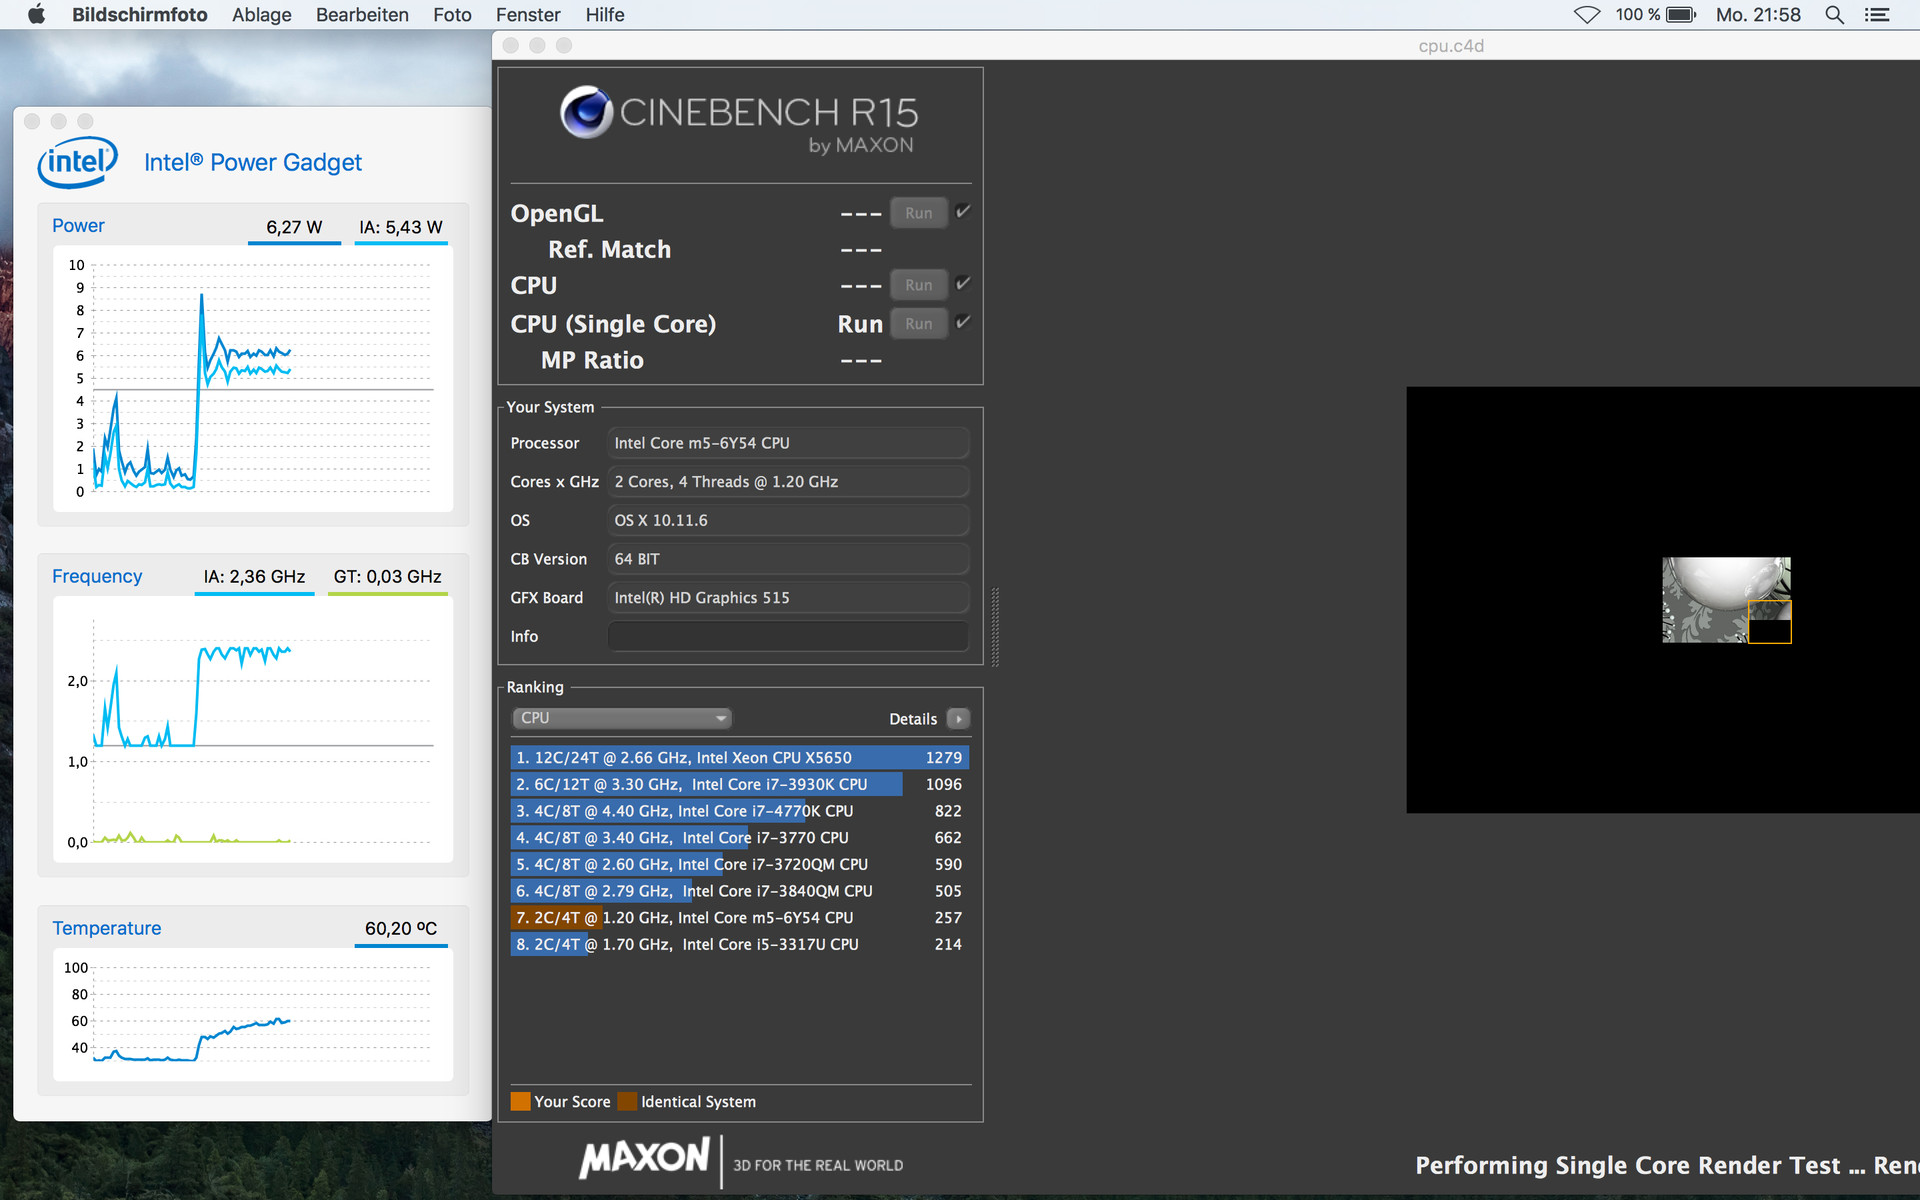
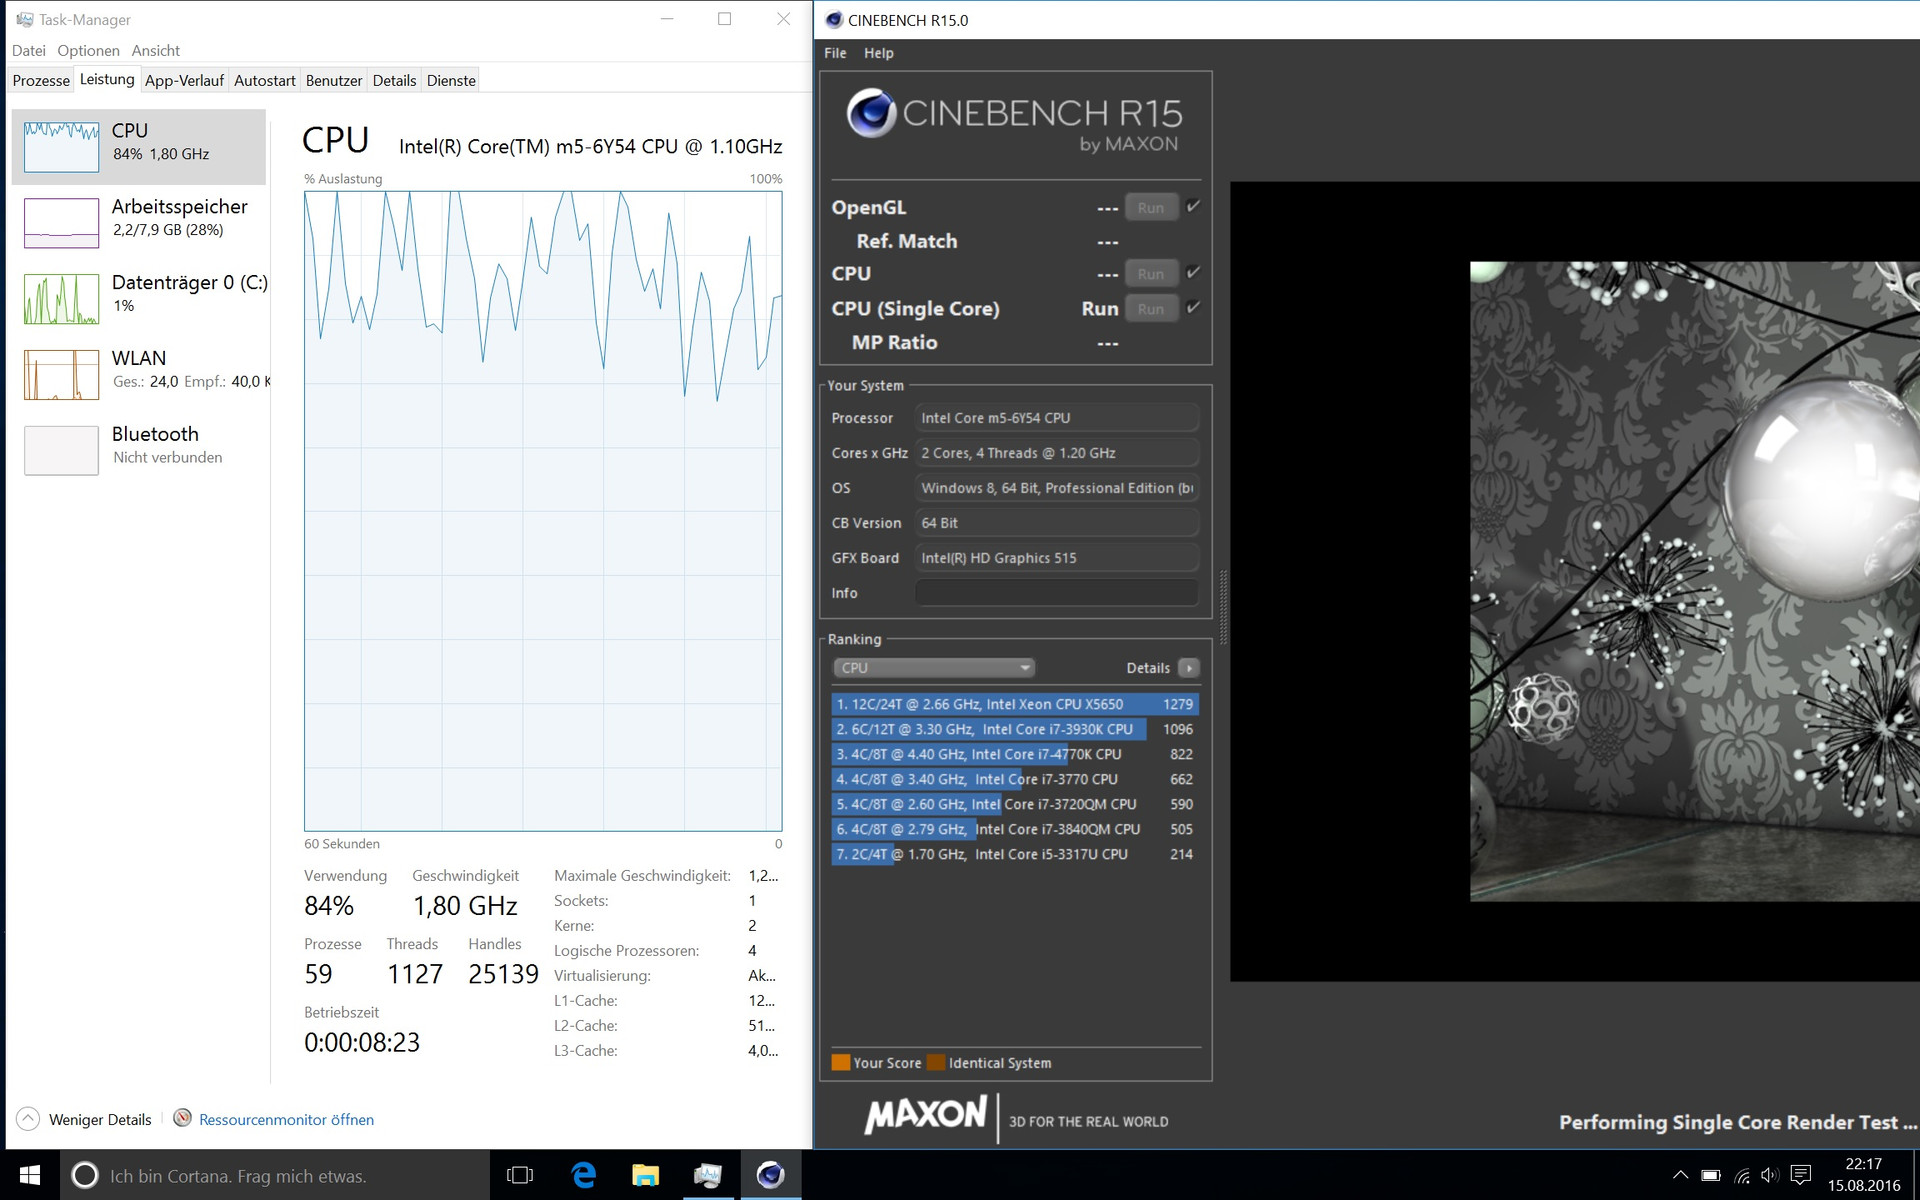
The Core m5 has a maximum Boost clock of 2.7 GHz, but it levels off at about 2.2 to 2.4 GHz (5 to 6 watts) in the Single test under OS X. The level is maintained pretty steadily, because the temperature increase is slower compared to the Core m7 and stabilizes at 68 to 70 °C (~154 to 158 °F). The clock starts at 2.4 to 2.6 GHz under Windows and then stabilizes at 2.4 GHz, but the clock has to be reduced about halfway through the benchmark run (1.6 to 2.0 GHz). Once again, the OS X result is higher.
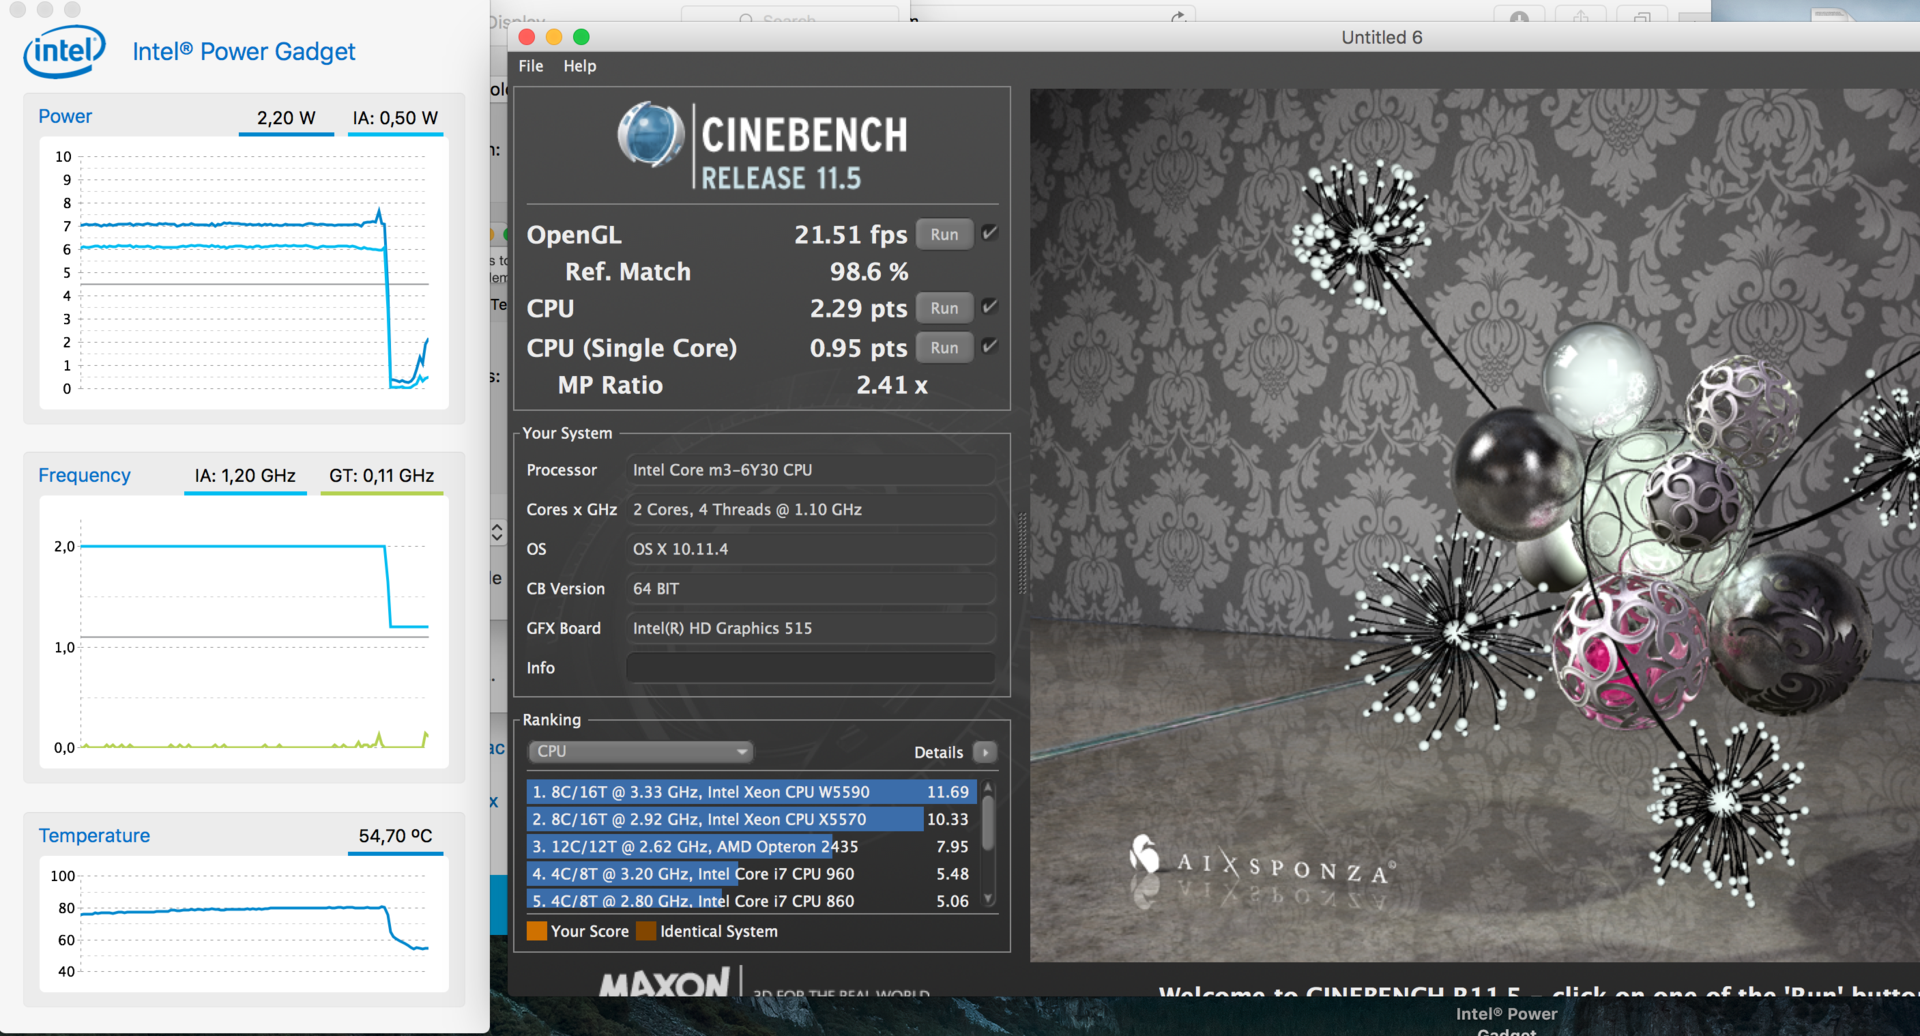
The Core m3 cannot reach its maximum Turbo of 2.2 GHz, despite the lower temperatures. The clock will be steady at 1.9 to 2.0 GHz in the Cinebench R15 Single test, which corresponds with a consumption of around 4 watts. The Windows performance is also much more stable thanks to lower temperatures, and the Windows result is even slightly better (91 vs. 90 points @CB R15 Single).
All three processors cannot utilize their maximum potential in the single-core tests. However, this problem is not surprising for passively cooled devices. The Core m7 is only slightly ahead of the Core m5 (+7%). A ULV chip such as the Core i5-6200U in the Acer Aspire Switch 12 Alpha is a few percent faster than the Core m7, even though the difference should become bigger under sustained loads.
Multi-Core Performance
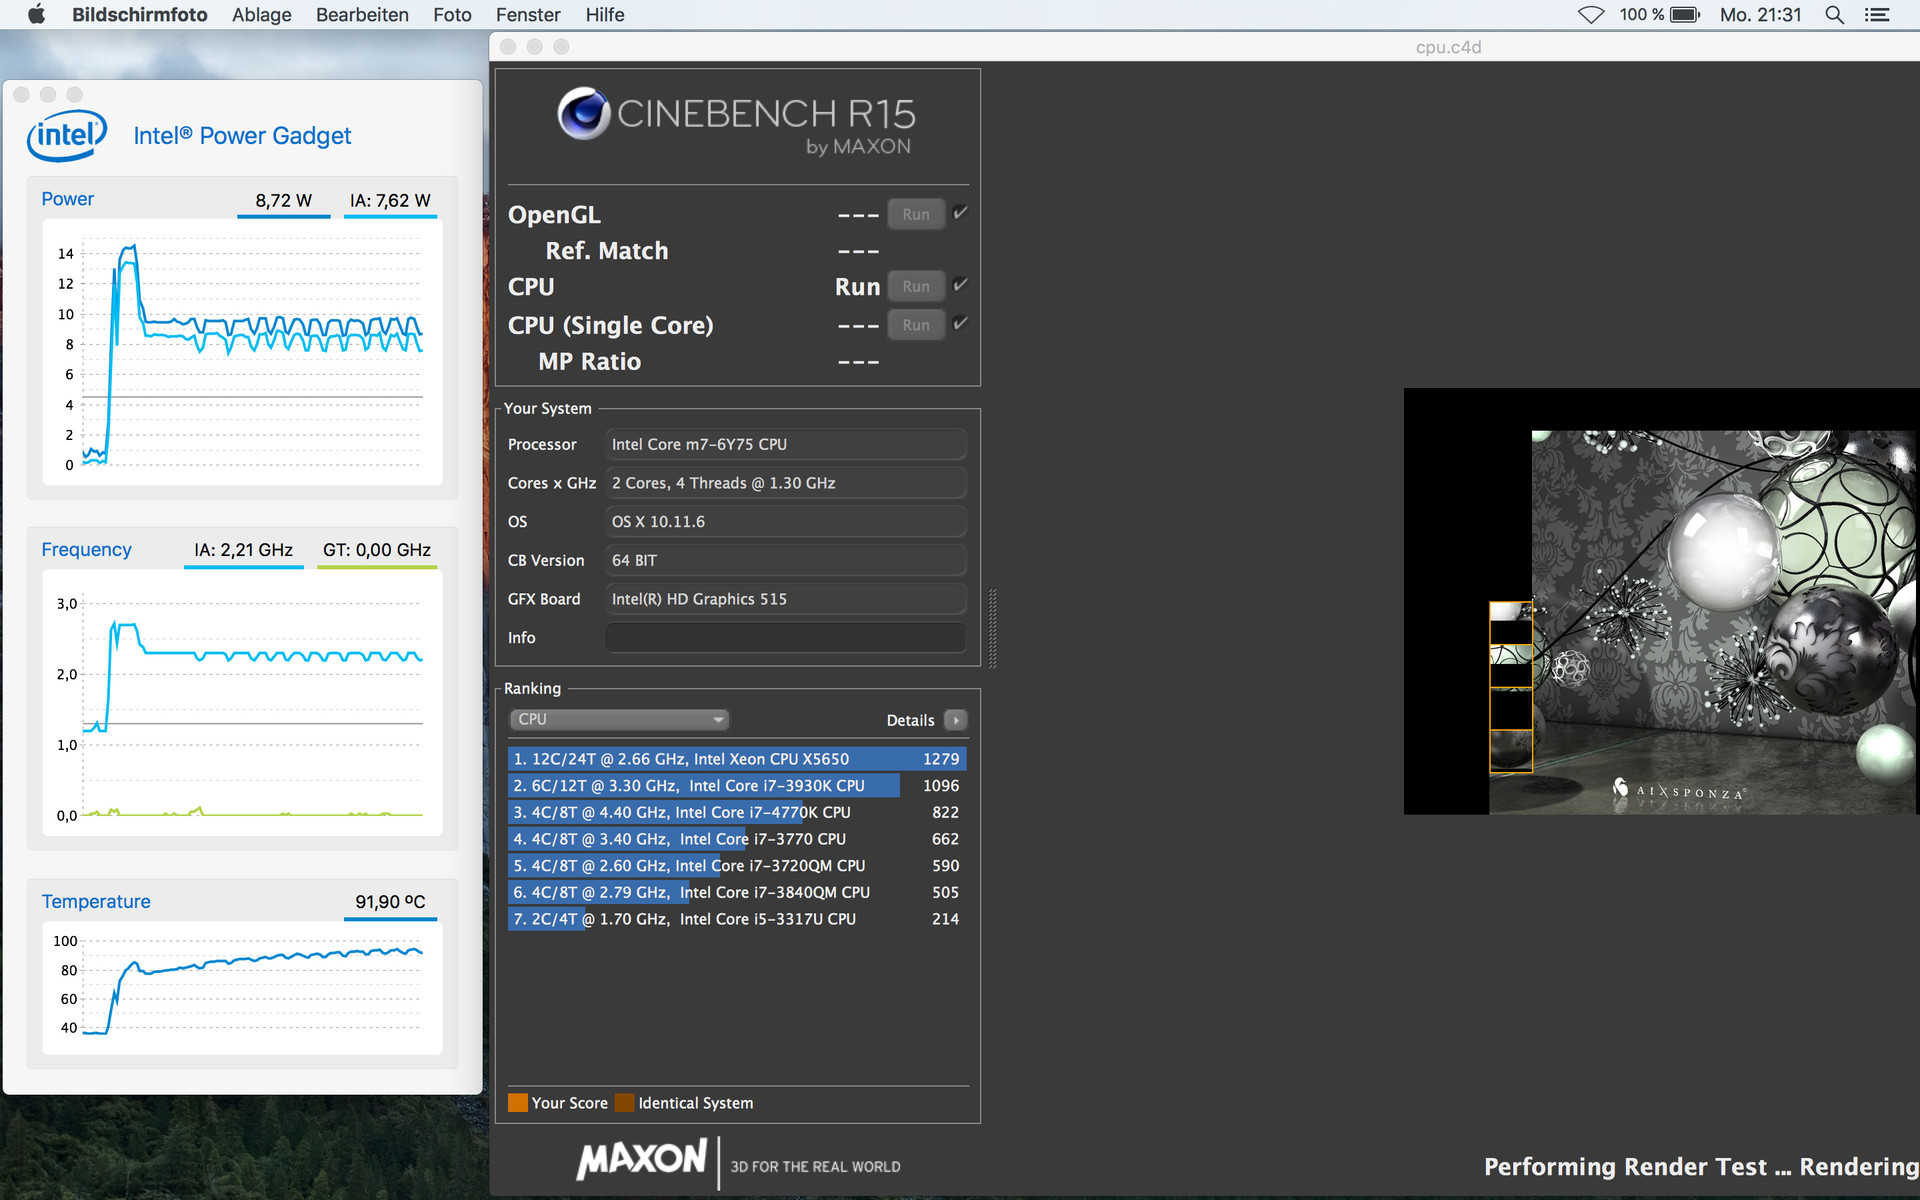
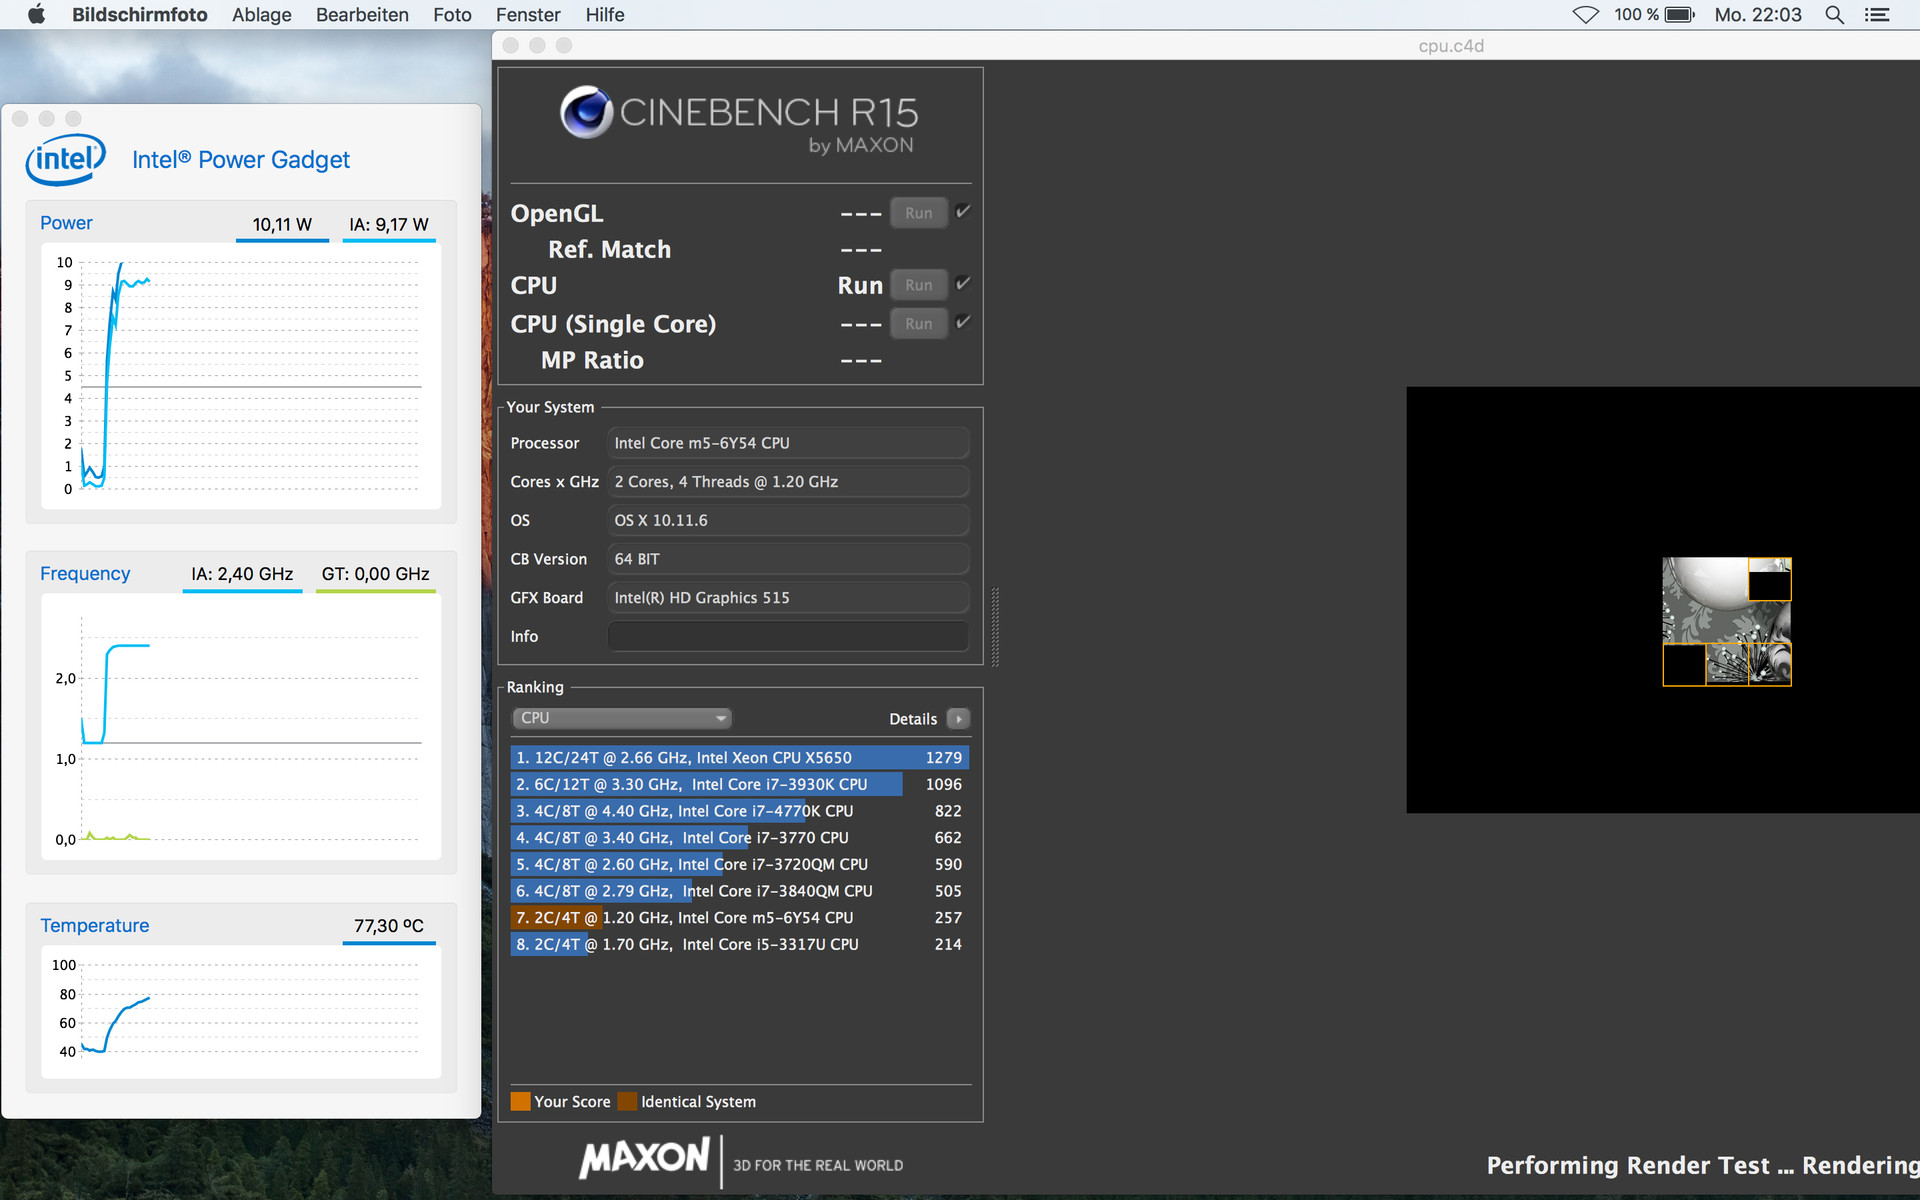
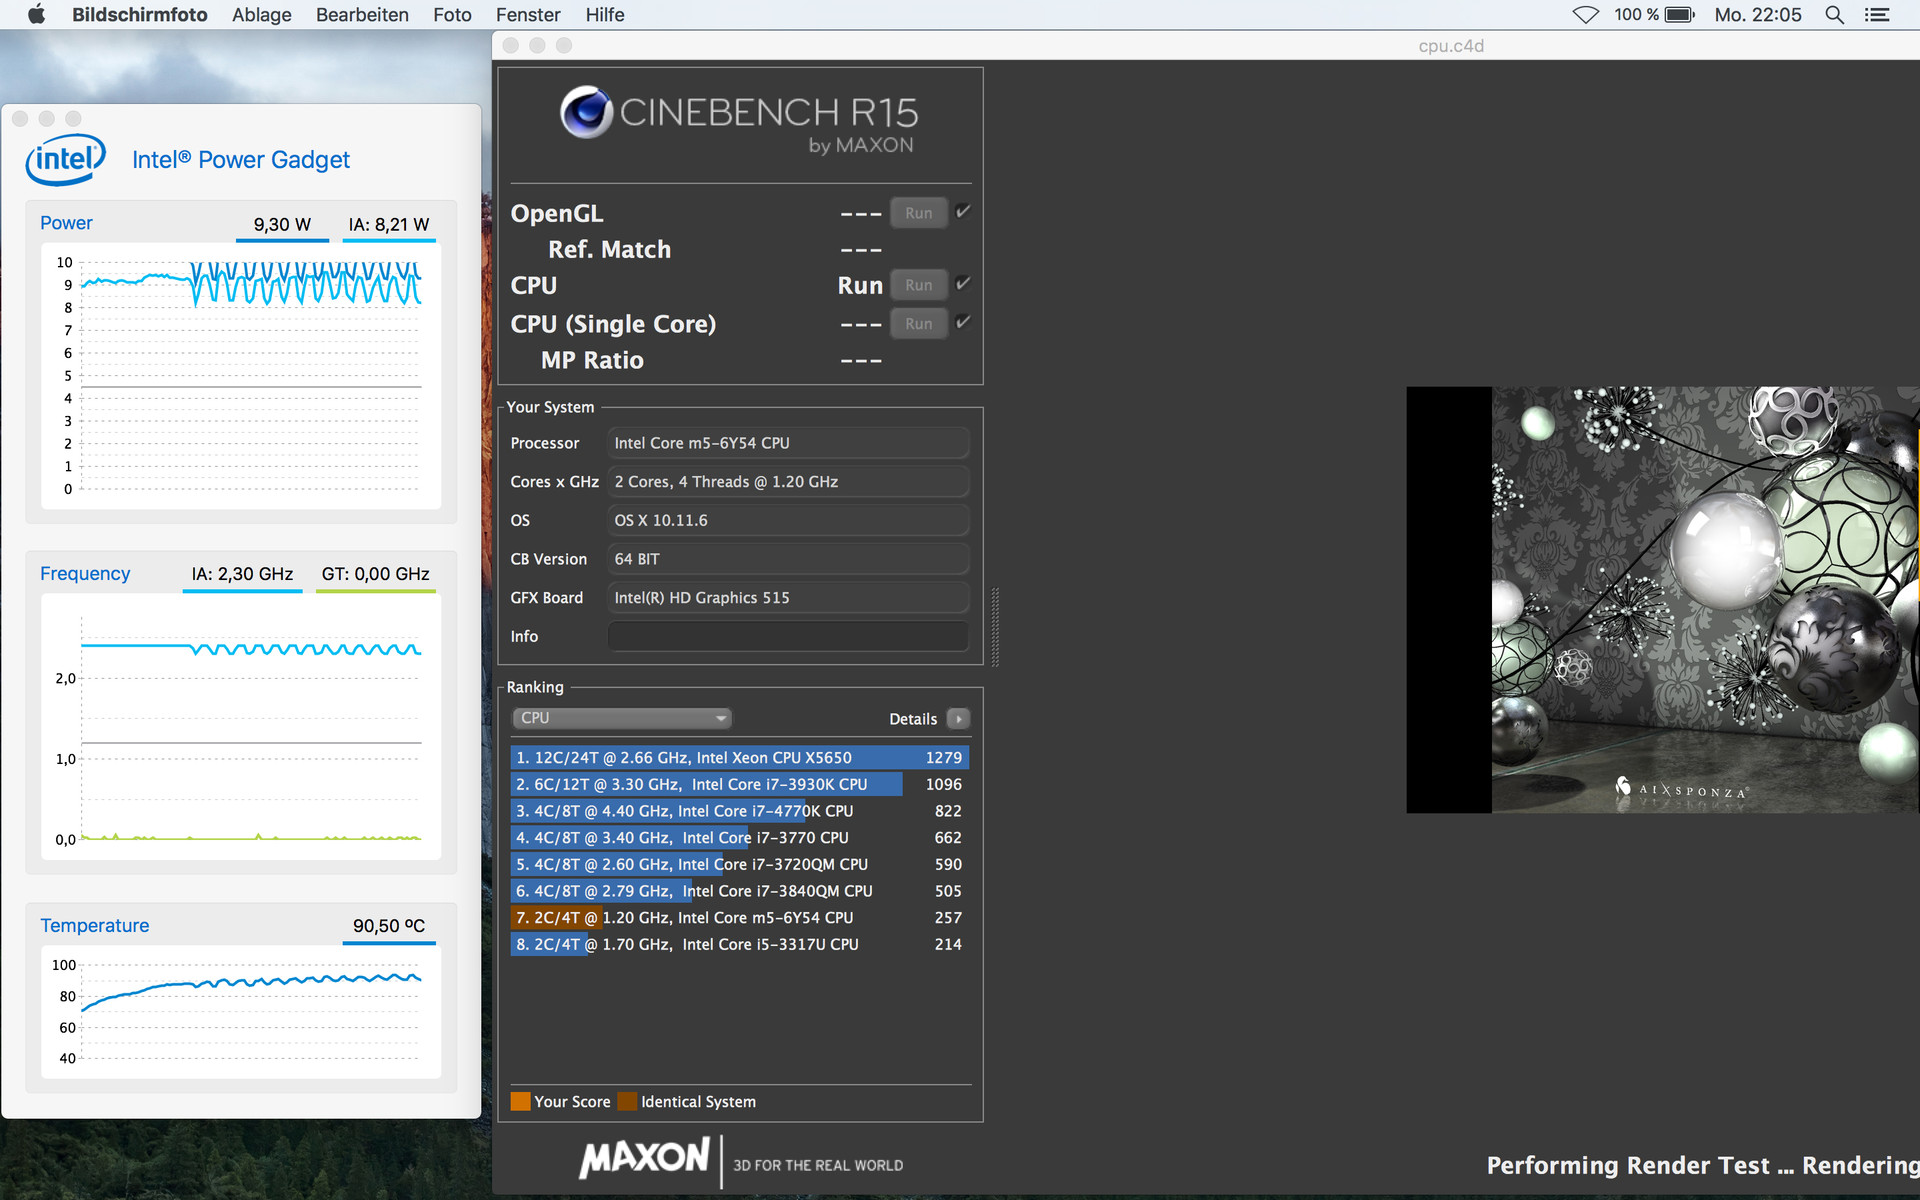
The full 2.7 GHz of the Core m7 can only be maintained for a few seconds in the Multi test (~13 watts) before the clock is reduced to 2.3 GHz (~8.5 W). The temperatures are still climbing pretty quickly and the chip will soon start to fluctuate between 2.2 to 2.3 GHz. It will drop even further over the course of the test. The processor also has to throttle its clock significantly after a short time under Windows, so the result in the CB R15 Multi test (1st run) drops to just 155 points (OS X: 251 points). Once again, the processor cannot utilize its full potential.
The Core m5 can maintain its maximum Turbo of 2.4 GHz in the Multi test at first (9.5 W) and starts to reduce the clock to 2.3 to 2.4 GHz as soon as the temperature reaches 90 °C (~194 °F). After prolonged load periods (like multiple Cinebench runs), the clock is further reduced so the case does not get too warm. The 2.4 GHz is only available for a few seconds under Windows before the clock drops dramatically to just 1.2 to 1.5 GHz. The result is much better under OS X (260 vs. 138 points), and the Core m5 is on par with the Broadwell chip Core i5-5200U, which was a very popular choice for Ultrabooks.
The Core m3 can maintain its Turbo Boost of 2 GHz (~6 watts) in the first benchmark run, while the temperature is at around 80 °C (~176 °F). It will only drop to 1.7 GHz (~4.5 GHz) and a core temperature of around 74 °C (~165 °F) after several runs. OS X and Windows are on par in this case.

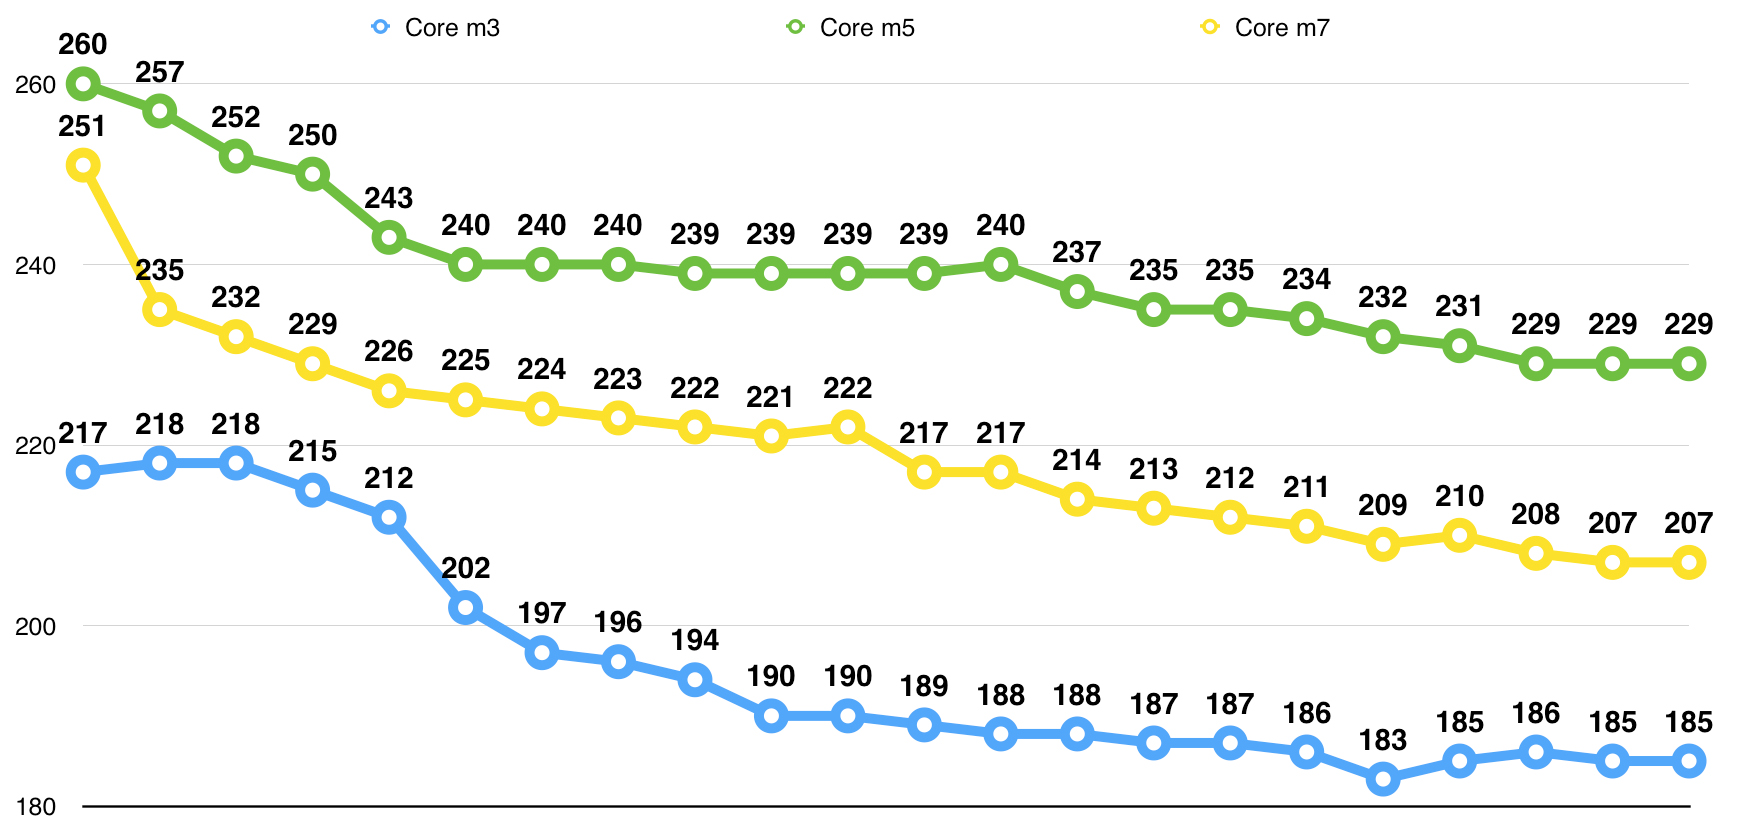
We have now seen how the processors handle short load situations. We also ran a loop of the Cinebench R15 Multi test on all three devices (OS X). The results of 22 runs (~1 hour) are shown in the diagram below. We can clearly see that the supposedly slower Core m5 can maintain its performance for a longer period and it is also faster than the Core m7 over the entire test. The curves of both chips are going down, but this is still a very good performance for a passively cooled system. The Core m3 drops significantly after a few runs, but will then level off at around 85% of the maximum performance.
Storage Devices
The MacBook 12 is only available with NVMe-SSDs. Even the smallest model already comes with a decent storage capacity of 256 GB, but faster processors are also available with 512 GB drives. The performance is slightly better for the 512 GB drive according to CrystalDiskMark, where it is around 15% ahead of the 256 GB drive. You will have a hard to time to notice the difference in practice, though.
The transfer rates of the NVMe-SSD surpass the typical SATA-III limit at 500 to 550 MB/s, but other competitors show that there is still a lot of headroom. Samsung's SM951 in the HP EliteBook Folio G1 in particular is much faster in terms of the sequential transfer rates.
| Apple MacBook 12 (Early 2016) 1.1 GHz Apple SSD AP0256 | Apple MacBook 12 (Early 2016) 1.2 GHz | Apple MacBook 12 (Early 2016) 1.3 GHz Apple SSD AP0256 | Apple MacBook 12 (Early 2015) 1.1 GHz Apple SSD AP0256 | Asus Zenbook UX305CA-FB055T Micron M600 MTFDDAV512MBF M.2 | HP EliteBook Folio G1 V1C37EA Samsung SM951 MZVPV256 m.2 | Apple MacBook Air 13 inch 2015-03 Apple SSD SD0256F | Apple MacBook Air 11 inch 2015-03 Apple SSD SM0128F | |
|---|---|---|---|---|---|---|---|---|
| CrystalDiskMark 3.0 | 15% | -1% | -23% | 29% | 121% | 41% | -18% | |
| Write 4k QD32 | 315 | 331.3 5% | 223.9 -29% | 95.8 -70% | 242.3 -23% | 292.1 -7% | 342.9 9% | 220.5 -30% |
| Read 4k QD32 | 464 | 458.4 -1% | 271.9 -41% | 176.1 -62% | 288.9 -38% | 464 0% | 339.5 -27% | 313.9 -32% |
| Write 4k | 20.5 | 24.68 20% | 24.87 21% | 27.34 33% | 90.7 342% | 100.7 391% | 30.94 51% | 32.84 60% |
| Read 4k | 14.6 | 16.17 11% | 16.28 12% | 16.56 13% | 28.57 96% | 46.96 222% | 21.93 50% | 20.36 39% |
| Write 512 | 678 | 894 32% | 737 9% | 430.8 -36% | 396.2 -42% | 1220 80% | 1023 51% | 260.6 -62% |
| Read 512 | 616 | 680 10% | 672 9% | 376.7 -39% | 404.8 -34% | 1191 93% | 880 43% | 345.7 -44% |
| Write Seq | 638 | 829 30% | 660 3% | 499.5 -22% | 423.7 -34% | 1232 93% | 1111 74% | 312.1 -51% |
| Read Seq | 754 | 844 12% | 821 9% | 725 -4% | 475.2 -37% | 1482 97% | 1352 79% | 567 -25% |
System Performance
The SSD in particular ensures a responsive system in practice. Subjectively, we could not notice any disadvantages compared to a much more powerful device like the MacBook Pro 13 in everyday tasks such as web browsing, writing mails or edit reviews in our web interface. The situation changes slightly when you use Windows via Boot Camp, where we occasionally noticed some stutters or short delays, respectively. This is probably caused by the BootCamp driver, which is just not perfectly optimized. The EliteBook Folio G1 with similar hardware equipment did not have these problems with Windows 10. This assumption is also supported in the two PCMark 8 tests, where the EliteBook Folio G1 is ahead of the three MacBooks.
GPU Performance
The graphics output of all three models is handled by the integrated Intel HD Graphics 515. Its performance is at the lower end of the performance ranking and the GPU will only manage smooth frame rates in simple games such as “World of Warships” or “FIFA 16” with low details. The GPU is still more than sufficient for normal multimedia tasks (also 4K videos) thanks to the integrated video decoder. Depending on the processor, the maximum core clocks of the GPU will differ slightly (Core m3: 850 MHz, Core m5: 900 MHz, Core m7: 1000 MHz), although they are also affected by the temperatures. This ranking is also supported by the two Graphics sub-scores of the current 3DMark. The Core m5 is, however, closer to the Core m7 than the m3, which suggests a suboptimal Turbo utilization of the m7. All three devices are still on a really low level to begin with, so the small differences will not have a big impact in practice.
Emissions & Energy
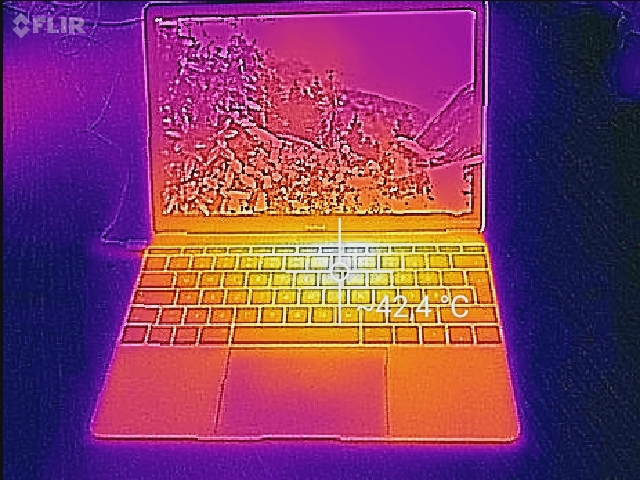
Temperature
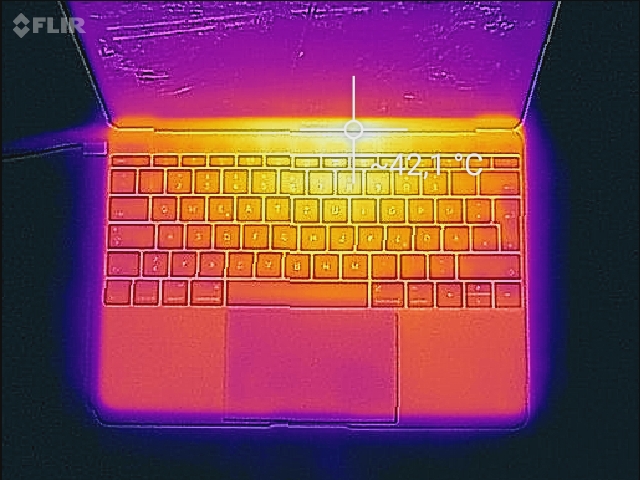
As expected, the temperature development is very similar for all three MacBooks. All three models stay conveniently cool while idling and we cannot measure more than 45 °C (~113 °F) even under extreme load. The warming is also focused on the upper central area where the processor is located. The temperatures were never an issue in practice and you can also use the devices on the lap without any restrictions.
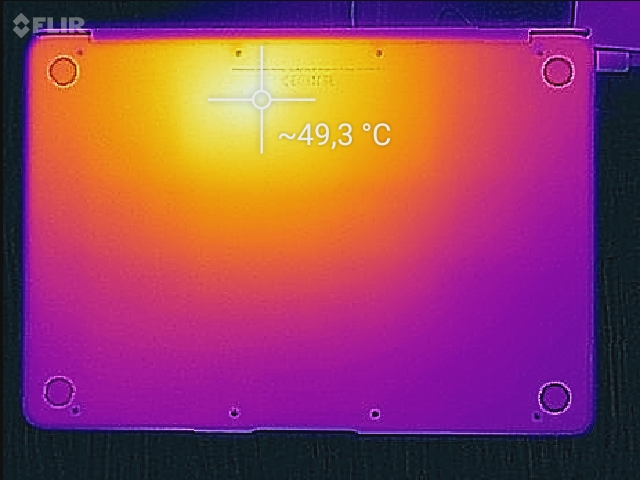
Heat Distribution Core m3
(+) The maximum temperature on the upper side is 39 °C / 102 F, compared to the average of 35.9 °C / 97 F, ranging from 21.4 to 59 °C for the class Subnotebook.
(±) The bottom heats up to a maximum of 44 °C / 111 F, compared to the average of 39.4 °C / 103 F
(+) In idle usage, the average temperature for the upper side is 28.4 °C / 83 F, compared to the device average of 30.7 °C / 87 F.
(+) The palmrests and touchpad are cooler than skin temperature with a maximum of 30 °C / 86 F and are therefore cool to the touch.
(±) The average temperature of the palmrest area of similar devices was 28.3 °C / 82.9 F (-1.7 °C / -3.1 F).

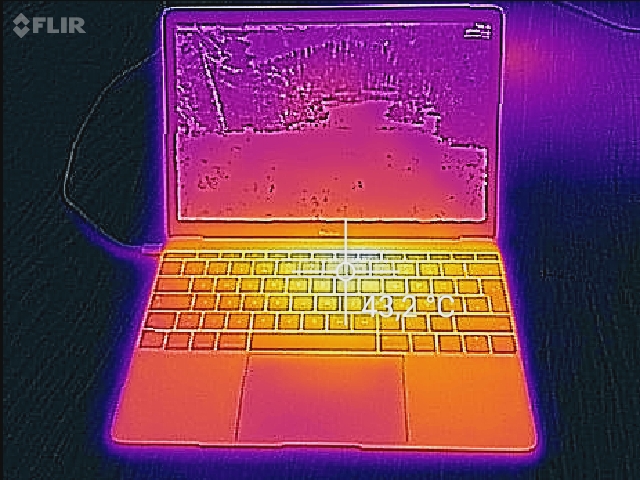
Heat Distribution Core m5
(±) The maximum temperature on the upper side is 40.8 °C / 105 F, compared to the average of 35.9 °C / 97 F, ranging from 21.4 to 59 °C for the class Subnotebook.
(-) The bottom heats up to a maximum of 45.3 °C / 114 F, compared to the average of 39.4 °C / 103 F
(+) In idle usage, the average temperature for the upper side is 27.7 °C / 82 F, compared to the device average of 30.7 °C / 87 F.
(+) The palmrests and touchpad are reaching skin temperature as a maximum (33.3 °C / 91.9 F) and are therefore not hot.
(-) The average temperature of the palmrest area of similar devices was 28.3 °C / 82.9 F (-5 °C / -9 F).
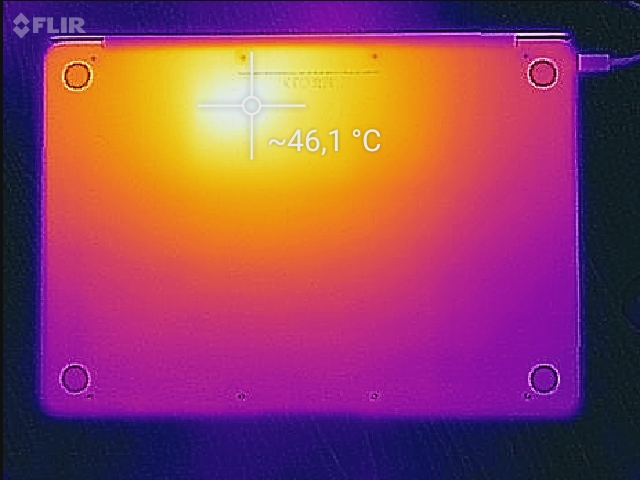
Heat Distribution Core m7
(±) The maximum temperature on the upper side is 40.4 °C / 105 F, compared to the average of 35.9 °C / 97 F, ranging from 21.4 to 59 °C for the class Subnotebook.
(±) The bottom heats up to a maximum of 44.4 °C / 112 F, compared to the average of 39.4 °C / 103 F
(+) In idle usage, the average temperature for the upper side is 27.2 °C / 81 F, compared to the device average of 30.7 °C / 87 F.
(+) The palmrests and touchpad are cooler than skin temperature with a maximum of 31.9 °C / 89.4 F and are therefore cool to the touch.
(-) The average temperature of the palmrest area of similar devices was 28.3 °C / 82.9 F (-3.6 °C / -6.5 F).
Power Consumption
Once again, the three MacBooks are very similar in our consumption measurements. The only noticeable aspect is the idle measurements, where the m3 model needs slightly more power. We reviewed this model shortly after its launch in April. The two Core m5 and m7 models, on the other hand have already received several software updates, which most probably have an effect on the energy management as well.
The consumption of all three models will jump to 30 watts under load for a short time before the clocks and therefore the consumption is reduced. Both the m5 as well as the m7 model drop to an average value of 24 to 25 watts at the end of the stress test. The compact 29-watt power adapter does not have a lot of headroom.
| Apple MacBook 12 (Early 2016) 1.1 GHz 41.4 Wh | Apple MacBook 12 (Early 2016) 1.2 GHz 41.4 Wh | Apple MacBook 12 (Early 2016) 1.3 GHz 41.4 Wh | Apple MacBook 12 (Early 2015) 1.1 GHz 40 Wh | Asus Zenbook UX305CA-FB055T 45 Wh | HP EliteBook Folio G1 V1C37EA 38 Wh | Apple MacBook Air 13 inch 2015-03 54 Wh | Apple MacBook Air 11 inch 2015-03 38 Wh | |
|---|---|---|---|---|---|---|---|---|
| Power Consumption | 6% | 6% | -14% | -55% | -45% | -43% | -50% | |
| Idle Minimum * | 2.7 | 2.1 22% | 2 26% | 1.7 37% | 4.2 -56% | 4.3 -59% | 2.7 -0% | 2.5 7% |
| Idle Average * | 2.7 | 2.15 20% | 2.06 24% | 5.3 -96% | 8.4 -211% | 6 -122% | 5.7 -111% | 5.1 -89% |
| Idle Maximum * | 7.2 | 6.99 3% | 6.94 4% | 6 17% | 8.9 -24% | 6.4 11% | 6 17% | 6.1 15% |
| Load Average * | 22 | 21.2 4% | 22.52 -2% | 18.5 16% | 15.9 28% | 22.7 -3% | 32.1 -46% | 37.6 -71% |
| Load Maximum * | 20.5 | 23.96 -17% | 24.87 -21% | 29.3 -43% | 22.5 -10% | 31.2 -52% | 36.2 -77% | 43.4 -112% |
* ... smaller is better
Battery Runtime
When we look at the battery runtimes, we can notice a rather big discrepancy in the video test. While the Core m3 model played our sample video for around 8.5 hours, both the m5 as well as the m7 model have much more stamina with 10:57 h and 10:19 h, respectively. We suspect the hardware video acceleration did not work properly in our initial review, because the m3 should last even longer in this scenario.
The faster components are noticeable in the load test. With minimum runtimes of 3:28 h (m7) and 3:36 h (m5), the two models do not last as long as the Core m3 MacBook (3:51 h).
Our practical WLAN test simulates web browsing at an adjusted luminance of around 150 nits (level 11/16) produces more interesting results. The m7 model (9:14 h) has a small advantage over the m5 model (8:57 h), while the m3-MacBook falls behind even further. This might be rather surprising at first, but the faster processor can handle short peak load better and therefore reduce the clock sooner ("Race to idle"). The keyboard illumination costs around 20 to 30 minutes at the brightest setting in this scenario.
The three compact MacBooks also leave a good impression compared to the rivals. The m3 model should perform better with all the current software updates, especially in the video test.
| Apple MacBook 12 (Early 2016) 1.1 GHz 41.4 Wh | Apple MacBook 12 (Early 2016) 1.2 GHz 41.4 Wh | Apple MacBook 12 (Early 2016) 1.3 GHz 41.4 Wh | Apple MacBook 12 (Early 2015) 1.1 GHz 40 Wh | Asus Zenbook UX305CA-FB055T 45 Wh | HP EliteBook Folio G1 V1C37EA 38 Wh | Apple MacBook Air 13 inch 2015-03 54 Wh | Apple MacBook Air 11 inch 2015-03 38 Wh | Acer Aspire Switch Alpha 12 SA5-271-56HM 37 Wh | |
|---|---|---|---|---|---|---|---|---|---|
| Battery Runtime | 10% | 7% | -20% | -20% | -27% | -17% | -29% | -32% | |
| H.264 | 512 | 657 28% | 619 21% | 426 -17% | 418 -18% | 413 -19% | 468 -9% | ||
| WiFi v1.3 | 501 | 537 7% | 554 11% | 456 -9% | 402 -20% | 355 -29% | 620 24% | 512 2% | 321 -36% |
| Load | 231 | 216 -6% | 208 -10% | 155 -33% | 182 -21% | 152 -34% | 97 -58% | 92 -60% | 112 -52% |
Verdict
Our comparison of the three MacBooks did produce interesting results in some sections. The main point is obviously the mediocre performance of the supposedly faster Core m7. Compared to the Core m5, it reached higher temperatures much quicker and therefore has an advantage under sustained loads. There can be differences between other devices (the processors are never completely identical), but you can save the additional charge for the Core m7 in terms of the performance. The latter is only necessary if you also rely on Intel's vPro technology.
If you only need the MacBook 12 for simple tasks and do not handle large amount of files, there is no reason why you should not get the less expensive model.
The choice is rather more difficult between the Core m5 and Core m3, because you also have to consider the storage capacity of the SSD. The smaller Core m3 is only available with the 256 GB SSD, while the Core m5 model is shipped with 512 GB by default. If you only need the MacBook 12 for simple tasks and do not have to store a huge amount of files, there is no doubt the less expensive model will be sufficient. If you plan to perform more demanding tasks (e. g. picture or video editing), however, we would recommend the Core m5 model.